This document contains lists of real estate investment trusts (REITs) organized by property sector, including apartment REITs, healthcare REITs, hotel/lodging REITs, industrial REITs, mortgage REITs, office REITs, and retail REITs. For each REIT, the last price and change from the previous day is provided, as well as the current dividend yield. Non-traded REITs are also listed with their offering and current yields.
The document summarizes a presentation on annuity-based retirement income solutions. It discusses:
1) Demographic trends showing a growing retiree population increasing the need for guaranteed retirement income.
2) Annuities make up a small portion of total US personal financial assets and income annuity sales remain low.
3) Acquisitions have reshaped the fixed indexed annuity and variable annuity markets in recent years.
4) Fixed indexed annuities, variable annuities, and income annuities are the main products offering guaranteed retirement income and each have different features around income, cash value, and death benefits.
Use Investment PowerPoint Presentation Slides to educate your clients about various investment schemes, long term investments, benefits, and more. Investment manager can present their different portfolios to the potential investors. This content-ready investment PowerPoint complete presentation deck aims to meet particular investment goals for the benefit of the investors. Incorporate templates like investment objectives, investment instruments, mutual funds, types of mutual funds, SIPs, exchange traded funds, and more. This investment complete presentation slideshow can be used on various other topics like asset allocation, financial statement analysis, stock selection, monitoring of existing investments, plan implementation, etc. Investment management PowerPoint templates are completely customizable. You can edit the PPT slides as per your convenience. Edit the color, text, icon, and font size as per your need. Add or delete the content from presentation if needed. Download ready-to-use investment PowerPoint presentation templates to create an investment portfolio for your clients. Get folks familiar with the field of computers with our Investment Powerpoint Presentation Slides. Be able to increase digital exposure.
Lincoln crowne Engineering Contractors Weekly Report Edition 134 30102015Lincoln Crowne & Company
Lincoln Crowne & Company Weekly market update on the Australian Engineering & Mining Services Contracting Sector.
Edition 134 covers valuations of companies in sector and recent deals announced and advanced
Winfield Refuse Management is considering financing options to acquire Mott-Pliese Integrated Solutions for $125 million. The options considered are: debt with fixed principal repayments, debt, equity, and a combination of debt and equity.
Debt with fixed principal repayments of $6.25 million annually over 15 years has the lowest net present value of financing costs. It also provides the highest expected earnings per share and return on equity under likely earnings scenarios. Monte Carlo simulations show Winfield can meet debt obligations and maintain strong interest, debt, and dividend coverage ratios under varying earnings outcomes.
Therefore, the recommendation is for Winfield to finance the acquisition through the issuance of bonds with no principal repayments
Winfield Refuse Management Inc.Raising Debt vs. Equitysubhash kalal
Winfield Refuse Management is considering financing options for a $125M acquisition of Mott-Pliese Integrated Solutions. The options considered are: 1) Debt with fixed principal repayments, 2) Debt only, 3) Equity, 4) Debt and equity. Debt only has the lowest NPV cost of financing, while equity has the highest. Debt options provide the highest expected earnings per share and return on equity under likely earnings scenarios. Monte Carlo simulations show Winfield can meet debt obligations and dividend payments under varying earnings outcomes for all financing alternatives. Winfield should finance through issuing bonds with no principal repayments.
Dividend weekly 13 2013 By http://long-term-investments.blogspot.comDividend Yield
The Dividend Weekly is a weekly published Fact Book with focus on dividend stocks. With this book, investors get a full overview of major leaders and laggards. In addition, they get a feeling of which dividend stocks are popular and which ones are the best investment opportunities in markets that are going up and down.
The book has the following items:
- Best 1-Week Performing Dividend Stocks
- Best Dividend Stocks Year-To-Date
- Best Yielding Stocks At New Highs
- Most Recommended Dividend Stocks
- Overbought Dividend Stocks
- Most Shorted Dividend Stocks
- Best Dividend Aristocrats in Canada and USA
- Stocks With Dividend Growth From Last Week
- Best Yielding Stocks From the World's Leading Stock Exchanges and Indices
- Ex-Dividend Stocks For Next Week
Thanks to http://long-term-investments.blogspot.com
GreensKeeper Asset Management, AGM presentation 2016 Michael McCloskey
GreensKeeper hosted our 5th Annual General Meeting at the Mississauga Golf and Country Club on June 9th, 2016. We presented our philosophy, our results, and some select stock picks, to a record number of attendees. Net of all fees and expenses, we have compounded our clients' capital at a rate of 11.2%, over the past four years.
Best defense of capital tax charity 15sep2013Hans Goetze
This 5 page document provides an update on StockTakers Limited's TaxCharityTM portfolios as of September 15, 2013. It lists numerous equities traded on the NYSE and TSX that are considered "likeables" based on trading above the risk price and tend to continue rising. The portfolios have achieved returns of 36.68% for NYSE stocks and 17.98% for TSX stocks over the past 9 months. It encourages maximizing tax shelter limits and investing in a diversified portfolio of these "likeables" equities.
This document provides an overview of Six Flags Entertainment Corporation presented by four investment managers. It includes an agenda, screening process, company overview, SWOT analysis, financial analysis, comparable company analysis, financial projections, and discounted cash flow valuation. The valuation estimates the company's fair value at $40.35 per share based on comparable company multiples and a discounted cash flow model valuing future free cash flows at $1.4 billion.
This document summarizes the 2014 annual shareholder meeting of First Financial. It includes lists of senior management and their years of experience, as well as lists of board members and their committee appointments. It also provides an overview of First Financial's financial performance in 2013, including increased earnings, strong returns, growth in assets and loans, and capital ratios above regulatory minimums. The document concludes with a forward-looking statement and summaries of First Financial's performance in the first quarter of 2014.
This document provides an analysis of Sears Holding Corporation (SHLD) and recommends shorting its stock. It notes that SHLD has been losing money at an accelerating rate, resulting in negative valuation metrics. The main shareholders, Eddie Lampert and Bruce Berkowitz, control 84.6% of SHLD stock and have been stripping the company of its most valuable assets through sale-leaseback deals and loans to enrich themselves at the expense of minority shareholders. SHLD is hemorrhaging cash and facing risks from suppliers who may reduce credit or demand better terms, making bankruptcy inevitable.
Whitemont Financial Services Inc. is an independent financial services firm founded by actuarial science graduates. It offers services including finance, insurance, investments, taxes, retirement, and legal aspects in collaboration with its partner Peak Financial Group, Quebec's largest independent broker. The firm's investment philosophy focuses on diversifying globally across equities and bonds using mutual funds with proven management teams. It aims to outperform benchmarks like the MSCI World Index by following principles such as buy-and-hold investing and minimizing risk for the investment horizon. The firm selects managers using strict quantitative and qualitative criteria and builds portfolios to meet clients' objectives.
This document provides an analysis of Rice Midstream Partners LP (RMP) conducted by Nathan Judge, CFA of Janney Montgomery Scott LLC. It recommends buying RMP based on its attractive 5.1% yield that is expected to grow over 25% annually through 2017, making it the top performer in the covered universe. Key points include RMP's low-risk growth profile requiring little capital, improving returns on capital, and undervalued unit price given its yield and growth relative to peers. The initiation report provides an overview of RMP's business, financial forecasts, valuation, and risks.
Lincoln Crowne & Company Engineering & Contractors Report No 102 20150320Lincoln Crowne & Company
Lincoln Crowne & Company weekly update on deal and valuation activity in the Australian Engineering & Mining Services Sector for the week ended 20th March 2015
This document discusses debt valuations for private equity and business development companies. It provides an overview of the middle market loan environment, key trends, new issuance volumes, and statistics on issuers with EBITDA of $50 million or less. Examples are given of calibration analyses, credit analyses, recovery methods, and market and income approaches to valuation. Methods for assessing debt pricing, credit ratings, broker quotes, and recovery rates for different asset classes are also outlined.
The Ontario Teachers' Pension Plan annual meeting addressed the economic crisis and its impact on the pension fund. The fund experienced a 18% rate of return loss in 2008, in line with average losses for other large Canadian pension plans. Several strategies were discussed to protect the fund from ongoing recession impacts and deploy strategies with appropriate risk levels, including reducing equity exposure from 45% to 40% and shifting to more conservative fixed income investments. The meeting also discussed resolving a 2008 funding shortfall and ongoing efforts to pay pensions over the long term despite challenges from low interest rates and increased life expectancies.
FIA GLWBs offer strong income guarantees while preserving flexibility compared to income annuities and VA GLWBs. The top annuity writers have changed since 2008, now including companies with less variable annuity sales. Mortality, policyholder behavior, and interest rates are key risk factors that determine profitability for income guarantee products.
The reality is now one of every 9.5 dollars we create through our employment is consigned to pension fund coffers, a 7.9% increase in 2 years. Every dollar lost in ineffective market myths requires we make another 9.5 more to replace it. Sispyhus is no myth, we live it every year. We keep-on having to roll that burden of losses from conventional market myths and their methods. All society must pick-up their slack from those losses. We must bend our knee as a society and push the rock, again and again. The financial industry managers, and politicians at their prompting, just keep telling us to push harder, "Sisyphus, shoulder your rock."
This document analyzes alternative investments and Schedule BA assets for several life and non-life insurance companies. It begins with an overview of "other long-term invested assets" for the U.S. life insurance industry as a whole. It then provides a deep dive into the Schedule BA filings of six life insurers (AIG, HIG, LNC, MET, PFG, PRU) and one non-life insurer (VOYA), reviewing their alternative allocations and investment strategies. The document aims to give investors greater insight into insurers' pursuit of yield through alternative asset classes.
This report resumes coverage of eight life insurance stocks and initiates coverage of four additional stocks. The analyst assigns ratings of Outperform to CNO Financial, Principal Financial, and MetLife based on catalysts such as an internal audit at CNO and the separation of Brighthouse Financial from MetLife. Torchmark receives an Underperform rating due to its stretched valuation. The report identifies four key themes for the life insurance sector: exposure to interest rates and equity markets; changing demographics and business models; technological changes; and potential for M&A activity. Overall, the analyst maintains a Market Weight outlook for the sector given macro headwinds but sees potential catalysts at the individual stock level.
The document is a weekly report on the Australian engineering and mining services sector that includes a disclaimer, market commentary, news headlines, and company performance data. It summarizes that the market made gains as the resources sector recovered, though China's lower growth expectations caused some losses late in the week. It also notes analysts expect Australian corporate capex outside of mining to decline 12% this year due to slowing mining investment. Company news and stock price movements are presented.
This document summarizes a presentation on guaranteed retirement income products. It discusses trends in annuity sales, features of different income guarantee products like fixed indexed annuities with guaranteed lifetime withdrawals (FIA GLWBs) and income annuities. It analyzes how the guaranteed income, cash value, and death benefits of these products vary based on market conditions. Key risks to profitability like policyholder behavior and interest rates are also summarized. Overall, the presentation finds that FIA GLWBs offer strong guaranteed income while maintaining flexibility, and correlates decreasing product guarantees with industry de-risking activities in response to regulations and market conditions.
The document discusses different guaranteed income products for retirement including income annuities, fixed indexed annuities with guaranteed lifetime withdrawal benefits (FIA GLWBs), and variable annuities with guaranteed lifetime withdrawal benefits (VA GLWBs). It finds that FIA GLWBs offer the strongest guaranteed income while also providing some flexibility and upside potential in cash value. Sales of pure income annuities have remained low while FIA GLWB sales have increased, though VA GLWB sales have declined due to product de-risking. Mortality risk and investment income are the main determinants of profitability for income annuities, while policyholder behavior and interest rates pose the greatest risks for FIA GLWBs.
2018 Market Outlook Presentation - Vancouver Victoria Grady
Strategic decisions for an uncertain future:
John Nicola, Chairman & CEO addresses several issues facing
high net worth families:
• How will the Liberals’ tax changes affect financial planning for Canadians?
• How will inflated prices impact future returns?
• Are there best practices for navigating the current environment?
Rob Edel, Chief Investment Officer provides an investment roadmap for 2018:
• After a record-breaking period for the S&P 500, what signs might indicate an economic downturn?
• What current events could most affect the economy and investment strategy?
• What should one make of bitcoin, marijuana stocks, electric vehicles, and other hot topics for the upcoming year?
GRESB 2016 Results Event - NAIOP Washington DCGRESB
The document summarizes the results of the 2016 GRESB assessment. Some key points:
- GRESB assesses the ESG performance of over 750 real estate entities across 63 countries, representing over $4 trillion in assets under management.
- Participation in the GRESB assessment has grown significantly each year, with North American participation nearly doubling from 2013 to 2016.
- Research has found a correlation between higher GRESB scores and higher returns, with the top 10% of entities outperforming the bottom 10% by 2.75-3.9% annually.
- The 2016 GRESB cohort improved their sustainability performance over the previous year, reducing energy, carbon, water and waste impacts
This document provides an overview of First Financial Bank's annual shareholder meeting in 2015. It includes information on senior management, regional CEOs and presidents, board of directors, auditors, and financial performance highlights for 2014 and the first quarter of 2015. Key details include 28 consecutive years of increased earnings, continued growth in assets, loans, and deposits, and sound capital ratios and credit quality. The acquisition of First Bank of Conroe and 4Trust Mortgage are also announced.
Borrw.com is a private real estate fund that aims to purchase 1,000 single family homes in distressed housing markets like Oakland, Riverside, and Phoenix. It plans to rent the homes at above-market rates with lease-to-own options for tenants. After 3-5 years, homes will be sold to tenants with crowdfunded mortgages. The team has experience in real estate, marketing, and distressed housing. Financial projections estimate growing rental income, expenses, and dividends through 2016 as more homes are acquired.
This document summarizes the business strategy and past performance of SAFE, Ltd., a commercial real estate investment partnership. SAFE targets government-leased properties and acquires them using fixed-rate, non-recourse loans for 60-80% of the purchase price. Each property is owned by a separate LLC. Past funds have achieved annual cash-on-cash returns of 6-12% and have provided consistent cash flow to investors. The document outlines several example properties and funds, and projections suggest SAFE investments outperform treasury notes and mutual funds over 10 years.
The document provides financial information for a company considering a share buyback. It shows that the buyback of $1.2 billion would retire 57.6 million shares at an average price of $20.90 per share. This would reduce diluted shares from 156.2 million to 98.6 million, increasing EPS from $1.17 to $1.67, a 42% increase. The buyback would reduce cash on hand from $741 million to $174 million and increase debt from $137 million to $800 million.
Pyatt Broadmark Real Estate Fund I Fact Sheet Sept 2015Alan Chu
The portfolio currently holds 141 active loans totaling $159.3 million, secured by $275.3 million in collateral. 182 loans have been repaid totaling $106 million, secured by $180.9 million in collateral. The Pyatt Broadmark Real Estate Lending Fund I is an evergreen fund that provides short-term loans secured by real estate in the Pacific Northwest, with a focus on high monthly returns while minimizing risk of loss. Prospective investors should be aware of risks including potential loss of principal, liquidity, interest rates, and income.
The document contains a jumbled collection of letters, words and symbols with no clear meaning. It includes the names of people, monetary policy terms, company listings, stock comparisons, investment scenarios and calculations, and a discussion of ETFs and shorting Brazilian stocks. There is no coherent message or main idea that can be discerned from the document.
The portfolio currently holds 133 active loans totaling $139.5 million, secured by $241.8 million in collateral. 155 loans have been repaid totaling $83.1 million, secured by $143.3 million in collateral. The fund provides short-term, first position loans for real estate projects in the Pacific Northwest, with an average loan size of $1 million at 58% loan-to-value. Prospective investors should review the risks associated with this type of investment including potential loss of principal.
Performance US and Global REIT Income Funds Managed by Randy Newsomenewsomer
Randy Newsome managed two income funds at Heitman that aimed to provide high monthly yields: the Nomura US High Income Fund and the Sumishin Global REIT Income Fund. Both funds consistently outperformed 90% of their peers over various time periods. In 2009, Heitman closed both funds to focus on their total return strategy, despite the funds' superior performance and against Newsome's view that income will become increasingly important to investors like retiring baby boomers. The two funds had combined assets of $130 million when closed.
This document contains an excerpt from an Excel underwriting template used to analyze the purchase of a multi-family property in Austin, TX. The template provides key details about the property such as unit mix and sizes, existing rental income, purchase price, projected returns, and financing. It projects stabilized net operating income, cash flows, returns, and potential refinancing amounts over a 7 year period. The property is described as an institutional grade asset with 336 units appealing to young tech tenants. Projected returns include a 12% IRR in year 1, 17% in year 3, and cash-on-cash returns of 6-7% in years 2-7.
The Knights of Columbus Investment Review provides an overview of their commitment to prudent, conservative investing by focusing on investment grade securities while avoiding risky or speculative investments. They detail their portfolio holdings, which are high quality with an average rating of A+ and emphasize bonds, mortgages, and asset-backed securities. The review also outlines their investment management approach, historical returns and growth rates, and strong financial ratings demonstrating their ability to fulfill their obligations.
AMI Perspective On Current Economic Crisis March 09jbenedict3
The document provides an overview of the current economic crisis from the perspective of AMI Investment Management. It discusses [1] how the crisis developed from the boom brought on by low interest rates and easy credit conditions, leading to overindebtedness; [2] the state of overindebtedness among households, firms, and governments; and [3] how the crisis unfolded as default rates rose and asset prices fell, destabilizing the financial system. It examines events like the Bear Stearns and AIG bailouts and the passage of TARP. The document considers where the economy and markets may be headed as the massive deleveraging process continues.
Managing Abu Dhabi's $627 Billion Sovereign Wealth Fund (ADIA), Presentation ...Aaron Beydoun
Aaron-Micael Beydoun has estimated the depletion of Abu Dhabi's oil reserves in 93 years in a course on investment management at Harvard University. Managing the USD 620 Billion of the Emirate's sovereign wealth vis-à-vis the Abu Dhabi Investment Authority, ADIA, he has proposed the following: Although an optimization of financial assets has established the portfolio strategic asset allocation, this ignores that underlying commodity asset i.e. oil, that forms the majority of client’s implied existing portfolio. Since the oil that forms the bulk of implied national wealth is highly volatile, then traditional portfolio investment risk management that only includes invested financial assets may not properly account for total wealth risk. Therefore, so as to properly account for national wealth risk, we recommend a strategic asset allocation that broadens the asset base to include the non-monetized commodity asset i.e. oil so as to properly account for national wealth risk.
Mercer Capital's Business Development Companies Quarterly Newsletter | Q4 2013Mercer Capital
Business development companies are an important and growing source of funding for middle market companies. Along with private equity and other investment funds, BDCs provide billions of dollars of investment capital to private companies in every segment of the economy.
For over thirty years, Mercer Capital has met the valuation needs of the same middle market companies to which BDCs and other funds provide capital.
This quarterly newsletter tracks the financial and stock market performance of the public BDCs.
An article in the Wall Street Journal (http://online.wsj.com/news/articles/SB10001424052702303819704579320581924300124) focused on whether REIT stock prices typically decline when interest rates increase. They usually don't, because the pace of economic growth is generally more important--and interest rates generally increase as a result of improving economic conditions. When demand conditions (employment, income, consumer spending, etc.) are strengthening, commercial real estate usually becomes more valuable because prospects improve for future growth in rents and occupancy levels.
I have done many other versions of this analysis, updated by several years.
Questions? Contact me at bcase@nareit.com.
The document provides information on Wisdom Capital LLC, a New York-based debt fund that provides mezzanine and preferred equity financing for commercial real estate. It summarizes key details of the US Bank Tower property in Los Angeles, including its location in the downtown submarket, leasing activity, vacancy rates, employment and population trends in LA. It also includes the lender's underwriting assumptions and valuation of the property at $432.6 million based on a 5.5% capitalization rate and compares it to other sponsor submissions.
Mercer Capital\'s Business Development Companies Quarterly Newsletter: Q3 201...traviswharms
Business development companies are an important and growing source of funding for middle market companies. Along with private equity and other investment funds, BDCs provide billions of dollars of investment capital to private companies in every segment of the economy.
For over thirty years, Mercer Capital has met the valuation needs of the same middle market companies to which BDCs and other funds provide capital.
This quarterly newsletter tracks the financial and stock market performance of the public BDCs.
Realty Income is a real estate investment trust that owns commercial properties and leases them to retailers on long-term net leases. It owns over 2300 properties across 49 states with a focus on retail properties leased to tenants in industries that provide necessities. While its financials have weakened due to the economic downturn, it maintains a strong portfolio occupancy rate and has access to capital to acquire more properties when opportunities arise. However, risks include a potential disconnect between dividends and earnings growth and retail tenant defaults increasing due to the recession.
Mercer Capital's Business Development Companies Quarterly Newsletter | Q3 2013Mercer Capital
"Business development companies are an important and growing source of funding for middle market companies. Along with private equity and other investment funds, BDCs provide billions of dollars of investment capital to private companies in every segment of the economy.
For over thirty years, Mercer Capital has met the valuation needs of the same middle market companies to which BDCs and other funds provide capital.
This quarterly newsletter tracks the financial and stock market performance of the public BDCs."
This document summarizes market share data for several major US airlines. It shows that in the most recent year, Delta Air Lines increased its market share the most at 3 percentage points, while AirTran's market share remained flat. It also notes that JetBlue has a larger market share in New York than AirTran does in Atlanta, and that AirTran has been losing share in Atlanta due to competition from Delta. The document questions whether Southwest should have considered acquiring JetBlue instead of AirTran, given JetBlue's stronger position in key markets like New York.
- U.S. and European stock futures fell, while Asian markets also declined, as concerns over global growth and the outcome of Greece's debt swap weighed on investor sentiment.
- European stocks dropped with banks and resources stocks falling the most. Eurozone GDP contracted 0.3% in Q4, driven by declines in investment, exports and consumer spending.
- Private investors holding around 20% of Greek bonds involved in the debt swap have agreed to participate in the exchange, which aims to reduce privately held Greek debt by 53.5% and help secure Greece's bailout.
The Federal Reserve announced its third round of quantitative easing (QE3) with no set timeframe, committing to buy $40 billion in mortgage-backed securities each month until it decides to stop. This caused stock markets to rise last week. Producer and consumer price indexes both increased in August, driven mainly by higher energy costs. Retail sales and consumer sentiment also improved in August.
This presentation was provided by Rebecca Benner, Ph.D., of the American Society of Anesthesiologists, for the second session of NISO's 2024 Training Series "DEIA in the Scholarly Landscape." Session Two: 'Expanding Pathways to Publishing Careers,' was held June 13, 2024.
A Free 200-Page eBook ~ Brain and Mind Exercise.pptxOH TEIK BIN
(A Free eBook comprising 3 Sets of Presentation of a selection of Puzzles, Brain Teasers and Thinking Problems to exercise both the mind and the Right and Left Brain. To help keep the mind and brain fit and healthy. Good for both the young and old alike.
Answers are given for all the puzzles and problems.)
With Metta,
Bro. Oh Teik Bin 🙏🤓🤔🥰
This document provides an overview of wound healing, its functions, stages, mechanisms, factors affecting it, and complications.
A wound is a break in the integrity of the skin or tissues, which may be associated with disruption of the structure and function.
Healing is the body’s response to injury in an attempt to restore normal structure and functions.
Healing can occur in two ways: Regeneration and Repair
There are 4 phases of wound healing: hemostasis, inflammation, proliferation, and remodeling. This document also describes the mechanism of wound healing. Factors that affect healing include infection, uncontrolled diabetes, poor nutrition, age, anemia, the presence of foreign bodies, etc.
Complications of wound healing like infection, hyperpigmentation of scar, contractures, and keloid formation.
A Visual Guide to 1 Samuel | A Tale of Two HeartsSteve Thomason
These slides walk through the story of 1 Samuel. Samuel is the last judge of Israel. The people reject God and want a king. Saul is anointed as the first king, but he is not a good king. David, the shepherd boy is anointed and Saul is envious of him. David shows honor while Saul continues to self destruct.
Level 3 NCEA - NZ: A Nation In the Making 1872 - 1900 SML.pptHenry Hollis
The History of NZ 1870-1900.
Making of a Nation.
From the NZ Wars to Liberals,
Richard Seddon, George Grey,
Social Laboratory, New Zealand,
Confiscations, Kotahitanga, Kingitanga, Parliament, Suffrage, Repudiation, Economic Change, Agriculture, Gold Mining, Timber, Flax, Sheep, Dairying,
Elevate Your Nonprofit's Online Presence_ A Guide to Effective SEO Strategies...TechSoup
Whether you're new to SEO or looking to refine your existing strategies, this webinar will provide you with actionable insights and practical tips to elevate your nonprofit's online presence.
THE SACRIFICE HOW PRO-PALESTINE PROTESTS STUDENTS ARE SACRIFICING TO CHANGE T...indexPub
The recent surge in pro-Palestine student activism has prompted significant responses from universities, ranging from negotiations and divestment commitments to increased transparency about investments in companies supporting the war on Gaza. This activism has led to the cessation of student encampments but also highlighted the substantial sacrifices made by students, including academic disruptions and personal risks. The primary drivers of these protests are poor university administration, lack of transparency, and inadequate communication between officials and students. This study examines the profound emotional, psychological, and professional impacts on students engaged in pro-Palestine protests, focusing on Generation Z's (Gen-Z) activism dynamics. This paper explores the significant sacrifices made by these students and even the professors supporting the pro-Palestine movement, with a focus on recent global movements. Through an in-depth analysis of printed and electronic media, the study examines the impacts of these sacrifices on the academic and personal lives of those involved. The paper highlights examples from various universities, demonstrating student activism's long-term and short-term effects, including disciplinary actions, social backlash, and career implications. The researchers also explore the broader implications of student sacrifices. The findings reveal that these sacrifices are driven by a profound commitment to justice and human rights, and are influenced by the increasing availability of information, peer interactions, and personal convictions. The study also discusses the broader implications of this activism, comparing it to historical precedents and assessing its potential to influence policy and public opinion. The emotional and psychological toll on student activists is significant, but their sense of purpose and community support mitigates some of these challenges. However, the researchers call for acknowledging the broader Impact of these sacrifices on the future global movement of FreePalestine.
THE SACRIFICE HOW PRO-PALESTINE PROTESTS STUDENTS ARE SACRIFICING TO CHANGE T...
Reit list
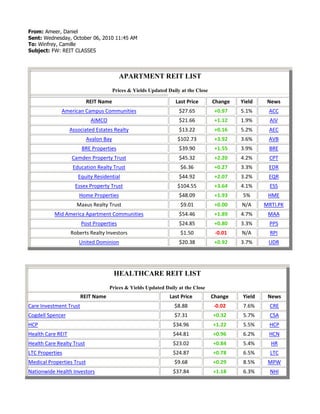
1. From: Ameer, Daniel Sent: Wednesday, October 06, 2010 11:45 AMTo: Winfrey, CamilleSubject: FW: REIT CLASSES<br />APARTMENT REIT LISTPrices & Yields Updated Daily at the CloseREIT NameLast PriceChangeYieldNewsAmerican Campus Communities$27.65+0.975.1%ACCAIMCO$21.66+1.121.9%AIVAssociated Estates Realty$13.22+0.165.2%AECAvalon Bay$102.73+3.923.6%AVBBRE Properties$39.90+1.553.9%BRECamden Property Trust$45.32+2.204.2%CPTEducation Realty Trust$6.36+0.273.3%EDREquity Residential$44.92+2.073.2%EQREssex Property Trust$104.55+3.644.1%ESSHome Properties$48.09+1.935%HMEMaxus Realty Trust$9.01+0.00N/AMRTI.PKMid America Apartment Communities$54.46+1.894.7%MAAPost Properties$24.85+0.803.3%PPSRoberts Realty Investors$1.50-0.01N/ARPIUnited Dominion$20.38+0.923.7%UDR<br />HEALTHCARE REIT LISTPrices & Yields Updated Daily at the Close REIT NameLast PriceChangeYieldNewsCare Investment Trust$8.88-0.027.6%CRECogdell Spencer$7.31+0.325.7%CSAHCP$34.96+1.225.5%HCPHealth Care REIT$44.81+0.966.2%HCNHealth Care Realty Trust$23.02+0.845.4%HRLTC Properties$24.87+0.786.5%LTCMedical Properties Trust$9.68+0.298.5%MPWNationwide Health Investors$37.84+1.186.3%NHINationwide Health Properties$37.14+1.165%NHPOmega Healthcare Investors$22.45+0.716.6%OHISenior Housing Properties Trust$21.74+0.536.8%SNHUniversal Health Realty Trust$32.77+0.377.5%UHTVentas REIT$49.83+1.674.4%VTR<br />HOTEL/LODGING REIT LISTPrices & Yields Updated Daily at the Close REIT NameLast PriceChangeYieldNewsAshford Hospitality Trust$8.41+0.53N/AAHTChatham Lodging Trust$15.10+0.15N/ACLDTChesapeake Lodging Trust$16.36+0.35N/ACHSPDiamond Rock Hospitality$8.73+0.3015.7%DRHEntertainment Properties Trust$41.34+1.906.6%EPRFelcor Lodging Trust$5.25+0.32N/AFCHGolf Trust of America$1.99+0.21N/AGTAHersha Hospitality Trust $4.81+0.174.3%HTHospitality Realty Trust$20.19+0.599.2%HPTHost Hotels$13.95+0.370.3%HSTInnSuites Trust$1.31+0.210.8%IHTLasalle Hotel Properties$22.76+1.100.2%LHOPebble Brook Hotels$17.09-0.02N/APEBStrategic Hotels & Resorts$4.09+0.25N/ABEESunstone Hotel Investors$5.25+0.2113.00%SHOSupertel Hospitality, Inc.$1.33+0.21N/ASPPR<br />INDUSTRIAL REIT LISTPrices & Yields Updated Daily at the Close REIT NameLast PriceChangeYieldNewsAMB Property Corp$22.95+0.455%AMBDCT Industrial Trust$4.40+0.156.6%DCTDigital Realty Trust$62.57+2.213.2%DLRDuPont Fabros$25.03+1.002%DFTEastGroup Properties$35.41+1.286.1%EGPFirst Industrial Realty Trust$4.03+0.27N/AFRFirst Potomac Realty Trust$15.23+1.005.6%FPOGladstone Commercial$17.00+0.379%GOODMonmouth Real Estate Investment Corp$7.23+0.218.5%MNRTAProLogis$10.97+0.585.8%PLDTerreno Realty Trust$18.08+0.52N/ATRNO<br />MORTGAGE REIT DIRECTORYPrices & Yields Update Daily at the CloseREIT NameFocusLast PriceChangeYieldNewsAmerican Capital AgencyAgency$27.42+0.1720.6%AGNCAnnaly Capital MgmtAgency$17.68+0.1415.5%NLYAnthracite CapitalCMBS$.11+0.00EliminatedACPI.PKAnworth MortgageAgency$7.33+0.1113.9%ANHAppollo Real Estate FinanceCommercial$16.75+0.398.6%ARIArbor Realty TrustCommercial$6.05-0.05N/AABRAshford Hospitality TrustHybrid/Hotel$8.41+0.53N/AAHTBimini Capital MgmntResidential$1.21+0.00EliminatedBMNMBRT Realty TrustCommercial$5.35-0.02N/ABRTCapital LeaseCommercial$4.93+0.265.1%LSECapital TrustCommercial$1.71+0.02N/ACTCapstead Mortgage CorpAgency$12.14+0.3012.2%CMOChimera Investment CorpNon-Agency$3.77+0.0918.5%CIMColony CapitalCommercial$17.90+0.384.8%CLNYCreXus InvestmentCommercial$12.20+0.144%CXSCrystal River CapitalCommercial$.41+0.00N/ACYRV.OBCypress SharpridgeAgency$12.93+0.1718.8%CYSDeerfield Capital Management (now “Wisdom Tree”)Commercial$15.12+0.210.5%DRFDynex CapitalCommercial$9.52+0.3710.1%DXEastern Light CapitalResidential Jumbo (concentration in CA) $4.50+0.21N/AELCECC Capital CapitalResidential Subprime$0.08+0.00EliminatedECRO.PKFirst Republic Preferred Capital CorpCommercial/Residential$21.25-0.200.1%FRCCOFirst Trust/FIDAC Commercial/Residential$19.15-0.097.5%FMYGrammercy Capital CorpHybrid/Commercial$1.41+0.07N/AGKKHatteras FinancialAgency$29.58+0.3615.1%HTSInvesco Mortgage CapitalRMBS/CMBSAgency/Non-Agency$20.32+0.2414.7%IVRiStar FinancialCommercial$4.20+0.25N/ASFIJER Investors TrustCommercial$.12+0.00EliminatedJERT.OBMFA MortgageResidential Agency$7.44+0.1310.4%MFANewcastle Investment CorpCommercial/Agency$2.54+0.11N/ANCTNew York Mortgage TrustResidential/Agency$6.34-0.0511.3%NYMTNorthstar Realty FinanceCommercial Whole Loans/Net Lease$3.11+0.0813.2%NRFNovastarResidential$0.83-0.05EliminatedNOVS.PKPenny MacResidential$16.39+0.23N/APMTPMC TrustCommercial/Small Balance$8.30+0.358.1%PCCRAIT Financial TrustCommercial/Net Lease$2.10+0.11N/ARASRealty Finance CorpCommercial$0.03+0.00EliminatedRTYFZ.PKRedwood TrustMajority Residential$15.11+0.636.9%RWTResource Capital CorpCommercial$5.61+0.1118.2%RSOStarwood Capital GroupCommercial, CMBS$17.64+0.555.9%STWDThornburg MortgageResidential Jumbo$0.01+0.00EliminatedTHMRQ.PKTwo Harbors InvestmentResidential Agency$9.59+0.21N/ACLAVestin Realty Mortgage TrustCommercial$1.37+0.21N/AVRTBWalter Investment ManagementResidential Subprime$17.15+0.1111.7%WACWebster Preferred Capital Corp.Commercial/Residential$10.00+0.210.12%WBSTPWinthrop Realty TrustCommercial$11.37+0.265.9%FUR<br />NON TRADED REIT DIRECTORYLast Update: March 27, 2010 REIT NAMEOFFERING YIELDCURRENT YIELDREDEMPTION POLICYAmerican Realty Capital New York Recovery REITIn RegistrationIn RegistrationIn RegistrationAmerican Capital Realty Trust6.5%6.7%DRIP proceedsApple REIT Six8%8.2%5% of shares outstandingApple REIT Seven8%7%3% of shares outstandingApple REIT Eight8%7%3% of shares outstandingApple REIT Nine8%8%3% of shares outstandingBehringer Harvard REIT I6.5%3.25%Not Even if You’re DeadBehringer Harvard Multi-Family REIT I7%7%DRIP Proceeds plus 1% of operating cash flowBehringer Harvard Opportunity REIT I6.5%3.25%SuspendedBluerock RealtyIn RegistrationIn RegistrationIn RegistrationClarion Properties TrustIn RegistrationIn RegistrationIn RegistrationCM REITIn RegistrationIn RegistrationIn RegistrationCNL Lifestyle Properties6.15%6.25%5% of shares outstandingCNL Macquarie Global Growth TrustIn RegistrationIn RegistrationIn RegistrationCNL Macquarie Global Income TrustIn RegistrationIn RegistrationIn RegistrationCole REIT II7%6.25%SuspendedCole REIT III6.5%6.75%<DRIP proceeds or 5% of shares outstandingCornerstone Core Properties REIT5%4.8%<DRIP proceeds or 5% of shares outstandingCornerstone Healthcare Plus REIT (f/k/a Cornerstone Growth & Income REIT)5.607.605% of shares outstandingDesert Capital9%SuspendedSuspendedDividend Capital Total Realty Trust6%6%<DRIP proceeds or 5% of shares outstandingGC Net Lease REIT6.75%6.75%5% of shares outstandingGrubb & Ellis Apartment REIT7%6%SuspendedGrubb & Ellis Healthcare REIT II6.5%6.5%5% of shares outstandingHartman REIT Short Term XXOffering StageOffering Stage<DRIP proceeds plus 1% of cash flow or 5% of shares outstandingHealthcare Trust of America (f/k/a Grubb & Ellis Healthcare REIT)7%6%5% of shares outstandingHines REIT6%6%SuspendedHines Global REIT6.9%6.9%5% of shares outstandingIncome Property Trust of AmericasIn RegistrationIn RegistrationIn RegistrationIndustrial Income Trust6.5%6.5%5% of shares outstandingInland American6%5%SuspendedInland Diversified6%6%3% of shares outstandingInland Western7%1.75%SuspendedKBS REIT I7%5.25%SuspendedKBS REIT II6.5%6.5%5% of shares outstandingKBS REIT IIIIn RegistrationIn RegistrationIn RegistrationKBS Legacy Apartment PropertiesIn RegistrationIn RegistrationIn RegistrationKBS Strategic Opportunity REITEffective 11/9/09Effective 11/9/09Effective 11/9/09Lightstone Value Plus REIT7%7%SuspendedLightstone Value Plus REIT II6.5%6.5%2% of shares outstandingMoody National REIT IOffering StageOffering StageOffering StageNorthEnd Income Properties TrustIn RegistrationIn RegistrationIn RegistrationNorthstar REITIn RegistrationIn RegistrationIn RegistrationPacific Office PropertiesIn RegistrationIn RegistrationIn RegistrationPaladin REIT6%6%10% of shares outstandingPiedmont REIT (formerly Wells REIT)6%5%SuspendedPrime Group Realty Trust6%0%SuspendedPrime Realty Income TrustIn RegistrationIn RegistrationIn RegistrationShopoff Properties TrustNoneNoneNoneStrategic Storage Trust7%7%5% of shares outstandingTNP Strategic Retail Trust6.75%6.75%<DRIP proceeds or 5% of shares outstandingW.P. Carey CPA 146.32%7.94%SuspendedW.P. Carey CPA 156%7.20%SuspendedW.P. Carey CPA 166%6.62%5% of shares outstandingW.P. Carey CPA 176.29%6.34%5% of shares outstandingWells REIT II6%6%SuspendedWells Timberland REIT0%0%SuspendedWhitestone REIT7%4%Suspended<br />OFFICE REIT LISTPrices & Yields Updated Daily at the Close REIT NameLast PriceChangeYieldNewsAlexandria Real Estate Equities$69.73+3.502.1%ARE Biomed Realty Trust$17.31+0.783.6%BMRBrandywine Realty Trust$10.78+0.505.8%BDNBoston Properties$79.14+3.062.6%BXPCorporate Office Properties Trust$38.27+1.504.3%OFCFranklin Street Properties$12.08+0.626.6%FSPGovenment Properties Income Trust$27.61+0.626.1%GOVHRPT Properties Trust$6.21+0.217.7%HRPHudson Pacific Properties$16.15+0.29N/AHPPMack-Cali Realty Corp$31.26+1.016%CLIMaguire Properties$2.87+0.16N/AMPGMission West Properties Trust$6.98+0.118.7%MSWPacific Office Properties$5.19+0.294.1%PCEParkway Properties$15.35+1.282.1%PKYPiedmont Office REIT$18.02+0.347.1%PDMPS Business Parks$57.14+1.963.2%PSBSL Green Realty Corp$56.30+1.490.7%SLG<br />RETAIL REIT LISTPrices & Yields Updated Daily at the CloseREIT NameLast PriceChangeYieldNewsAcadia Realty Trust$17.84+0.844.2%AKRAlexanders, Inc.$319.98+17.413.3%ALXAgree Realty Corp$22.87+0.639.2%ADCCBL & Associates$13.43+0.746.3%CBLCedar Shopping Centers$5.96+0.276.3%CDRDevelopers Diversified Realty$10.72+0.580.8%DDREquity One$16.53+0.685.6%EQYFederal Realty$75.64+2.523.6%FRTGeneral Growth Properties$13.70+0.315.7%GGPGlimcher Realty Trust$6.21+0.286.7%GRTInland Realty$7.90+0.407.6%IRCKimco Realty$14.40+0.754.7%KIMMacerich Company$39.57+1.485.3%MACNational Retail Properties$23.06+0.826.8%NNNPennsylvania Real Estate Investment Trust$11.74+0.725.4%PEIRamco-Gershenson Properties Trust$10.63+0.506.4%RPTRealty Income Corp.$31.86+1.185.6%ORegency Centers$35.57+1.775.5%REGSaul Centers, Inc Mortgage$42.04+1.773.6%BFSSimon Property Group$86.33+3.972.9%SPGTanger Factory Outlet Centers, Inc.$44.18+1.083.6%SKTTaubman Centers$39.57+1.214.3%TCOUrstadt Biddle Properties$16.94+0.495.9%UBAWeingarten Realty Investors$20.56+1.105.3%WRI<br />STORAGE REIT LISTPrices & Yields Updated Daily at the CloseREIT NameLast PriceChangeYieldNewsIn Storage REIT, Inc.$3.99N/AN/AIS-UN.TO Extra Space Storage, Inc.$8.42+0.2112.40%EXRPublic Storage$64.66+0.213.40%PSASovran Self Storage, Inc.$24.13+0.2111.10%SSSU-Store-It Trust$4.75+0.212.20%YSI<br />REITs Paying Dividends In StockPrices & Yields Updated Daily at the CloseREIT NameSectorLast PriceChangeYield% Paid in StockQuotes/NewsAIMCOApartment REIT$21.66+1.121.9%75%AIVAnthracite CapitalMortgage REIT$0.24+0.21516.7%90%**AHRCBL & AssociatesRetail REIT$13.43+0.746.3%90%**CBLDeveloper’s Diversified RealtyRetail REIT$10.72+0.580.8%90%DDRDiamond Rock HospitalityHotel REIT$8.73+0.3015.7%60-90%**DRHHospitality Properties TrustHotel REIT$20.19+0.599.2%TBA**HPTJER Investors TrustMortgage REIT$.32+0.00EliminatedPrevious 90%JERT.OBLexington Realty TrustDiversified REIT$5.99+0.247%10%**LXPMacerichRetail REIT$39.57+1.485.3%90%MACNorthstar Realty FinanceMortgage REIT$3.11+0.0813.2%60%**NRFOne Liberty PropertiesDiversified REIT (NNN)$15.39+0.468%90%OLPRAIT FinancialMortgage REIT$2.10+0.11N/A90%**RASSimon Property GroupRetail REIT$86.33+3.972.9%80%SPGSunstone HotelsHotel REIT$9.72+0.56N/A90%SHOUDRApartment REIT$20.38+0.923.7%75%UDRVornado Realty TrustOffice & Retail REIT$79.10+3.543.4%60%VNO<br />REIT ETF LISTPrices & Yields Updated Daily at the Close REIT NameLast PriceChangeClosing YieldExpense RatioNewsAsia Property Yield Fund (Long Asia REITs)$1,386.50+0.00N/AN/AIASP.L (London)Claymore Global Real Estate (Long Global REITs)$15.61-0.01N/A.65%CGR.TO (Toronto)Cohen & Steers Realty Majors (Long Large Cap US REITs)$31.90+0.952.7%.55%GRICohen & Steers/iShares Realty Majors (Long Large Cap US REITs)$58.85+2.303.2%.35%ICFDirexion Leveraged REIT ETF (Long MSCI U.S. REIT Index)$40.81+4.253.7%.95%DRNDirexion Leveraged REIT ETF(Short MSCI U.S. REIT Index)$30.82-3.97N/A.95%DRVDow Jones Wilshire REIT (Long Dow Jones REIT Index)$54.33+2.113.6%.25%RWRFTSE NAREIT European Property Index Fund (Long Euro REITs)$2,075+2.00N/AN/AIPRP.L (London)First Trust S&P REIT Index (Long S&P REIT Composite)$13.03+0.491.6%.5%FRIFTSE EPRA/NAREIT Asia(Long NAREIT Asia Index)$27.74+0.528.4%.5%IFASFTSE EPRA/NAREIT Europe(Long NAREIT Europe Index)$26.12+0.8710.4%.48%IFEUFTSE EPRA/NAREIT North America(Long NAREIT U.S. Index)$35.61+1.052.7%.48%IFNAFTSE EPRA/NAREIT North America Top 50(Long NAREIT U.S Top 50 Index)$30.54+1.214%.48%FTYFTSE EPRA/NAREIT Global Real Estate (Long NAREIT Global REIT Index) $30.85+1.092.5%.6%FFRFTSE EPRA/NAREIT Global Real Estate ex-US (Long NAREIT Global REIT Index), ex U.S.$27.32+0.719.8%.48%IFGLFTSE NAREIT Global Property Yield Fund (Long NAREIT Global REIT Index)$1048.72+1.23N/AN/AIWDP.L (London)FTSE NAREIT Industrial/Office REIT Index (Long U.S. Industrial & Office REITs)$23.41+0.703.1%.48%FIOFTSE NAREIT Mortgage REIT Index (Long U.S. Mortgage REITs)$14.66+0.2610.9%.48%REMFTSE NAREIT Residential Index Fund(Long U.S. Residential REITs)$35.83+1.272.9%.48%REZFTSE NAREIT Retail Index Fund (Long U.S. Retail REITs)$23.60+0.934%.48%RTLFTSE NAREIT UK Property Fund (Long U.K. REITs)$381.50+1.00N/AN/AIUKP.L (London)FTSE NAREIT US Property Fund (Long U.S. REITs)$953.32+1.01N/AN/AIUSP.L (London)Power Shares Active U.S. REITs (Long U.S REITs – actively managed)$41.12+0.961%.8%PSRVanguard MSCI US REIT Index (Long MSCI U.S REIT Index)$49.31+1.783.9%.15%*VNQ<br />Closed End REIT Funds ListPrices & Yields Updated Daily at the Close Fund NameLast PriceChangeYieldExpense RatioNewsCohen & Steers Advantage Income Realty Fund$5.93+1.27N/A1.13%RLFCohen & Steers Premium Income Realty Fund$13.73-0.01N/A.95%RPFCohen & Steers Quality Income Realty Fund$34.28+1.278.35%1.00%RQICohen & Steers REIT and Preferred Income Fund$34.28+1.278.35%.98%RNPCohen & Steers REIT and Utility Income Fund$34.28+1.278.35%1.04%RTUDividend Capital Realty Allocation Fund$34.28+1.278.35%2.04%DCAING Global Real Estate Fund$34.28+1.278.35%.98%IGRING Clarion Real Estate Income Fund$34.28+1.278.35%.94%IIANeuberger Berman Real Estate Securities Income Fund$34.28+1.278.35%1.95%NRONuveen Diversified Dividend and Income Fund$34.28+1.278.35%1.00%JDDNuveen Real Estate Income Fund$34.28+1.278.35%1.54%JRSLMP Real Estate Income Fund$34.28+1.278.35%1.54%RITRMR Real Estate Income Fund$34.28+1.278.35%2.55%RIFDWS RREEF Real Estate Fund II$34.28+1.278.35%2.55%SRO<br /> HYPERLINK quot;
http://www.dividendgrowthinvestor.com/2010/06/four-high-yield-reits-for-current.htmlquot;
Four High Yield REITs for current income <br />One asset class that dividend investors could use in order to diversify their portfolios is real estate. The sector includes rental real estate on residential buildings, offices, malls etc. Owning a piece of rental real estate outright however comes with headaches, such as dealing with tenants and not being properly diversified. In order to avoid managing buildings and finding tenants, investors could use real estate investment trusts (REITs).Real estate investment trusts own different types of real estate, and they offer instant liquidity to investors, since most are publicly traded. In addition to that REITs are required to distribute almost all of their earnings back to shareholders. As a result REITs are not taxed at the corporate level, but distributions from earnings are typically taxed as ordinary income. The rest of distributions from REITs are typically treated as returns of capital, which reduce your basis and would be taxable as a capital gain if you sell your shares.Real Estate Investment Trusts offer instant diversification to investors, as most of them typically own hundreds of properties across many states. In addition to that, since they distribute all of their earnings to shareholders, their yields are typically much higher than yields on stocks. An important metric for evaluating REITs is Funds from operations (FFO). FFO is defined as net income available to common stockholders, plus depreciation and amortization of real estate assets, reduced by gains on sales of investment properties and extraordinary items.Most REITs have rather stable revenues and as a result are able to maintain and even consistently raise distributions over time. I have highlighted four trusts for further research:Realty Income Corporation (O) engages in the acquisition and ownership of commercial retail real estate properties in the United States. The company leases its retail properties primarily to regional and national retail chain store operators. Realty Income is widely known among its investors as the monthly dividend company. The company is a dividend achiever, which has increased its dividend for 15 years in a row by raising its monthly distributions several times per year. (analysis)Universal Health Realty Income Trust (UHT) operates as a real estate investment trust (REIT) in the United States. The company invests in health care and human service related facilities, including acute care hospitals, behavioral healthcare facilities, rehabilitation hospitals, sub-acute facilities, surgery centers, childcare centers, and medical office buildings. The company is a dividend achiever and has raised distributions for 22 consecutive years. (analysis)Health Care Property Investors, Inc. (HCP) operates as a real estate investment trust in the United States. The company invests in health care-related properties and provides mortgage financing on health care facilities. This dividend achiever has raised distributions for 24 consecutive years. (analysis)National Retail Properties, Inc. (NNN) is a publicly owned equity real estate investment trust. The firm acquires, owns, manages, and develops retail properties in the United States. It provides complete turn-key and built-to-suit development services including market analysis, site selection and acquisition, entitlements, permitting, and construction management. The firm also focuses on purchasing and financing net-leased retail properties. The company is a dividend achiever as well as a component of the S&P 1500 index. It has been increasing its dividends for the past 20 consecutive years. (analysis)While I generally find these companies attractive, each one has its own risks. Realty Income (O) has slowed the growth in distributions, and its FFO payout ratio is above 90%. In addition to that the rate of vacancies there has increased over the past few years, as the number of assets under management has increased.National Retail Properties (NNN) has not raised distributions since 2008. The company does have a lower vacancy rate than Realty Income and in addition to that has a much lower FFO payout ratio. If the company doesn’t raise distributions by the end of 2010, it would lose its dividend achiever status.Fifty-one percent of Universal Health Realty Income's revenues are derived from leases to Universal Health Services. UHT’s advisor is a subsidiary of UHS, and all officers of Universal Health Realty are employees of UHS, which could create conflicts of interest.One warning statistic for Health Care Property Investors, Inc. (HCP) is the fact that average occupancy percentage for Senior Housing has dropped from 95% in 2005 to 86% in 2009. This occupancy ratio represents occupancy and unit/bed amounts as reported by the respective tenants or operators. Certain operators in HCP Inc’s hospital portfolio are not required under their respective leases to provide operational data however. The company’s focus on senior living facilities should benefit from increasing demand by retiring baby boomers. There will be a significant increase in the number of people over the age of 65 in the US over the next decade, which would be beneficial to overall healthcare facilities.Overall, I like the stable income streams generated by real estate investment trusts. I believe that getting exposure to real estate through REITs could not only help in diversifying your income portfolio, but also boost your current yield. In addition to that most REITs also grow distributions, which provides some hedge against inflation.Full Disclosure: Long O, NNN, UHTRelevant Articles:- Realty Income (O) Dividend Stock Analysis- National Retail Properties (NNN) Dividend Stock Analysis- Universal Health Realty Income Trust (UHT) Dividend Stock Analysis- Health Care Property Investors, Inc. (HCP) Dividend Stock Analysis<br />Daniel Ameer<br />Financial Solutions Advisor<br />Merrill Lynch, Pierce, Fenner & Smith Inc.<br />Phone: 323-817-6001 Fax: 323-817-6016<br />Branch Location: 100 N. Larchmont Blvd. Los Angeles, CA 90004<br />Supervisory Office: 350 S. Grand Ave. 27th Flr. Los Angeles, CA 90071<br />