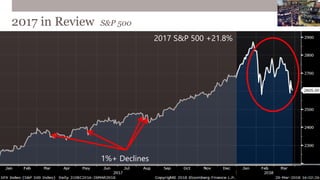
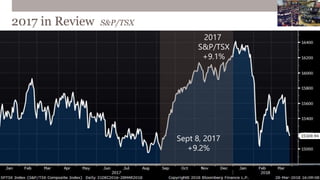
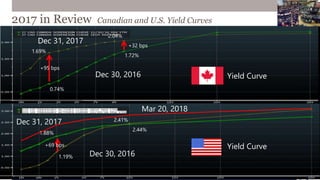
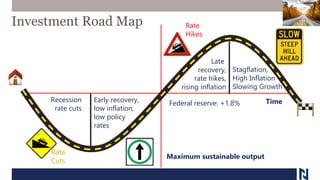
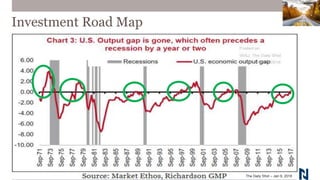
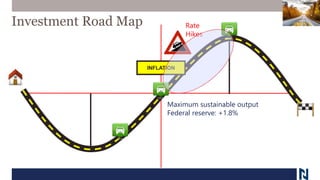
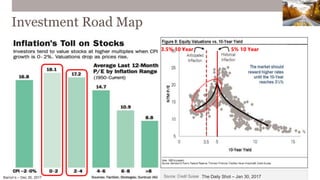
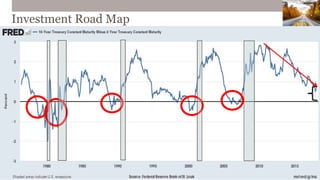
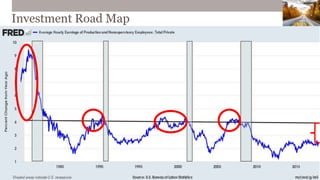
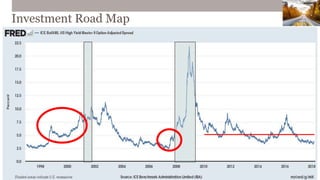
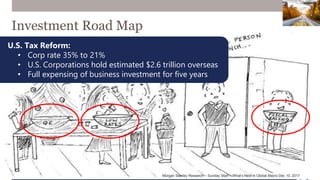
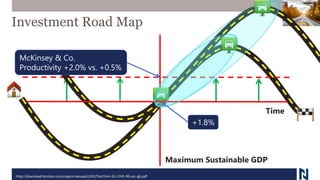
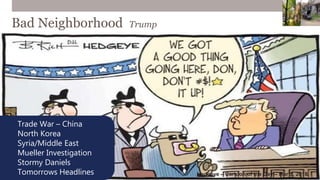
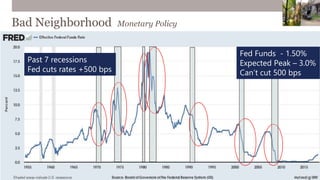
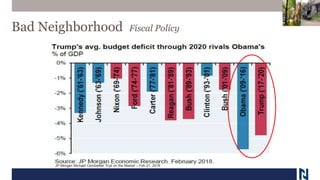
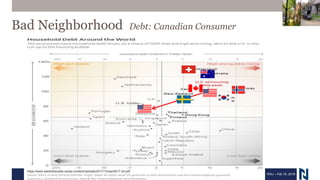
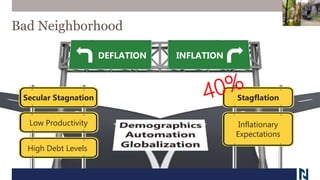
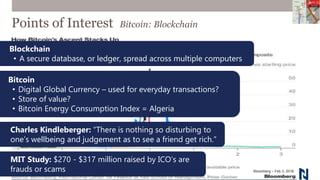
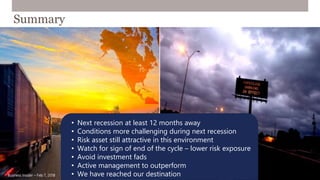
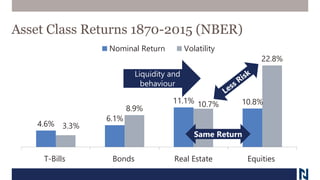
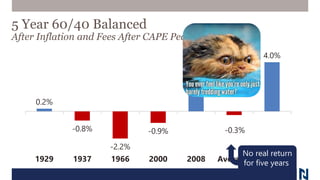
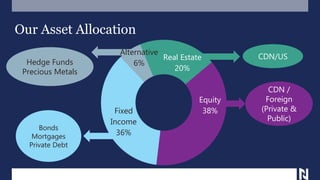
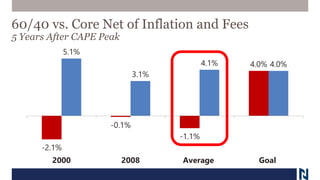
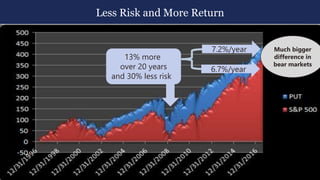
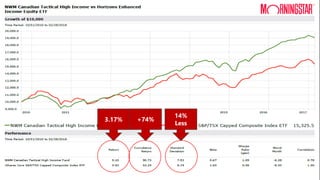
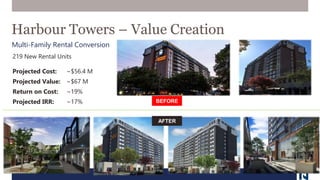
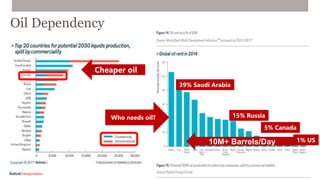
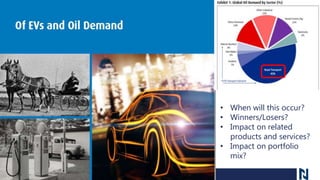
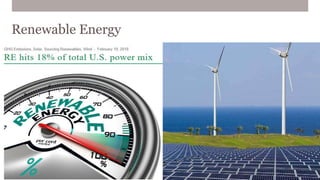
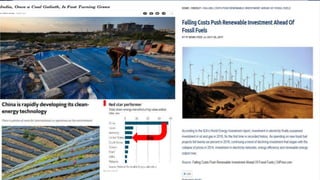
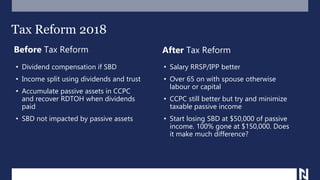
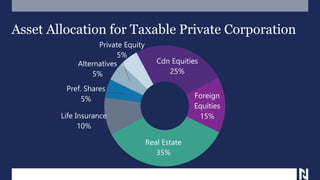
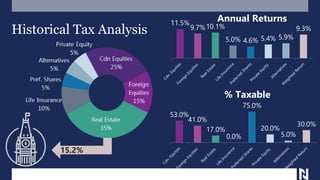
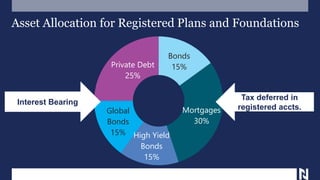
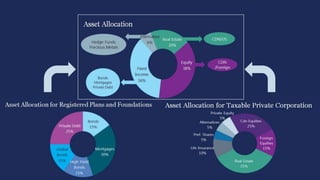
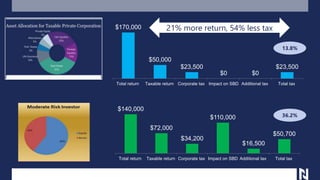
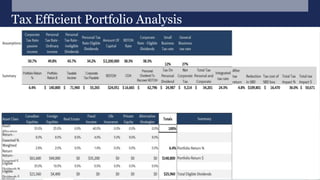
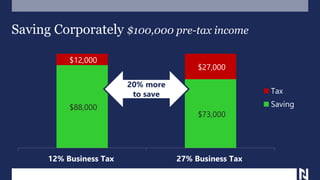
SlideShare a Scribd company logo
Welcome | 2018 Strategic Outlook
Introduction by David Sung, President
WHAT
IS
WEALTH
MANAGEMENT?
NWM
Planning Process
circa 1994
2018 Strategic Outlook
Rob Edel, Chief Investment Officer
Our
Agenda
Investment Roadmap2017 in Review
Good Neighborhood Turning Bad Points of Interest
Oct 19, 1987 Oct 18, 2017
2017 in Review S&P 500
2017 S&P 500 +21.8%
+1% Declines
Last
+5% Decline
June 24-27 2016
Feb 2, 2018
404 Days
Average since 1929
92 Days
Feb 8, 2018
-10.1%
2017 S&P 500 +21.8%
1%+ Declines
2017 in Review S&P/TSX
Sept 8, 2017
+9.2%
2017
S&P/TSX
+9.1%
2017 in Review Canadian and U.S. Yield Curves
Yield Curve
Yield Curve
Dec 31, 2017
Dec 30, 2016
Dec 31, 2017
Dec 30, 2016
0.74%
1.69%
2.04%
1.72%
+95 bps
+32 bps
1.19%
1.88%
2.44%
2.41%
+69 bps
Mar 20, 2018
Investment Road Map The Art of Forecasting – Tricks of the Trade
Business Insider Jan 4, 2016
Investment Road Map
Investment Road Map
Maximum sustainable output
Recession
rate cuts
Early recovery,
low inflation,
low policy
rates
Late
recovery,
rate hikes,
rising inflation
Stagflation,
High Inflation
Slowing Growth
Rate
Cuts
Rate
Hikes
TimeFederal reserve: +1.8%
Investment Road Map
The Daily Shot – Jan 9, 2018
Investment Road Map
Maximum sustainable output
Federal reserve: +1.8%
Rate
Hikes
INFLATION
Investment Road Map
Barron’s – Dec 30, 2017 The Daily Shot – Jan 30, 2017
5% 10 Year3.5% 10 Year
Investment Road Map
Investment Road Map
Investment Road Map
Morgan Stanley Research – Sunday Start – What’s Next in Global Macro Dec 10, 2017
Investment Road Map
U.S. Tax Reform:
• Corp rate 35% to 21%
• U.S. Corporations hold estimated $2.6 trillion overseas
• Full expensing of business investment for five years
http://download.tomtom.com/open/manuals/LIVE/TomTom-EU-LIVE-RG-en-gb.pdf
Maximum Sustainable GDP
Time
Investment Road Map
McKinsey & Co.
Productivity +2.0% vs. +0.5%
+1.8%
Bad Neighborhood Trump
Source: Financial Times, February 2018
Trade War – China
North Korea
Syria/Middle East
Mueller Investigation
Stormy Daniels
Tomorrows Headlines Hedgeye – Cartoon of the Day – Mar 5, 2018
Investment Road Map
Bad Neighborhood Monetary Policy
Past 7 recessions
Fed cuts rates +500 bps
Fed Funds - 1.50%
Expected Peak – 3.0%
Can’t cut 500 bps
Bad Neighborhood Fiscal Policy
JP Morgan Michael Cembalest “Eye on the Market – Feb 21, 2018
Bad Neighborhood Debt: Canadian Consumer
WSJ – Feb 19, 2018
https://www.bankofcanada.ca/wp-content/uploads/2017/12/san2017-24.pdf
Bad Neighborhood
DEFLATION INFLATION
Secular Stagnation
Low Productivity
High Debt Levels
Stagflation
Inflationary
Expectations
Points of Interest
Bloomberg – Feb 3, 2018
Points of Interest Bitcoin: Blockchain
MIT Study: $270 - $317 million raised by ICO’s are
frauds or scams
Charles Kindleberger: “There is nothing so disturbing to
one’s wellbeing and judgement as to see a friend get rich.”
Blockchain
• A secure database, or ledger, spread across multiple computers
Bitcoin
• Digital Global Currency – used for everyday transactions?
• Store of value?
• Bitcoin Energy Consumption Index = Algeria
Points of Interest Bitcoin: Useless Etherium Token
Contributions in US$’s - $276,342
Enough to buy 230 televisions!
Points of Interest Marijuana
1 Year Cannabis Stock Performance
Barron’s – Mar 30, 2018
Canopy CEO Bruce LintonROB Magazine – Nov 12, 2017
Barely existed 3 years ago
Now dozens of companies
~$30 billion market cap
Points of Interest Marijuana
Globe & Mail – Feb 8, 2018Globe & Mail – Feb 8, 2018
Barron’s Mar 30, 2018
60 Private and public companies
Health Canada granted 89 licenses
Feb 1 – 244 more in review stage
Oregon/Colorado – wholesale $0.50 - $2.00
Commodity business
Low barriers to entry
No sustainable advantage
Canada
• Deloitte: After legalization
• $4.9-$8.7 billion market
• Low=rum, High=wine
• Price: $10/gram initially
Constellation Brands
• U.S. $50 billion Market
• Global: $200 billion in 15 years
• Wine: $60 billion
• Tobacco: $75 billion
Points of Interest Active vs. Passive Investing
Strategas – Technical Strategy & Analysis October, 2017
 Active equity mutual funds
• 2009-2017 $1.0 trillion in
outflows
 ETFs - Passive
• 2009-2017 $1.7 trillion in
inflows
• 44% of equity AUM ETFs or
passive mutual funds
Strategas Technical Analysis Research – May 16, 2017
Points of Interest Active vs. Passive Investing
Strategas Technical Analysis Research – May 16, 2017
Low interest rates mean more bad companies are able to survive
WSJ – Feb 13, 2018
Long time horizon
$1.7 Trillion in Dry Powder
Manager Selection
Points of Interest Active vs. Passive Investing: Private Equity
Summary
• Next recession at least 12 months away
• Conditions more challenging during next recession
• Risk asset still attractive in this environment
• Watch for sign of end of the cycle – lower risk exposure
• Avoid investment fads
• Active management to outperform
• We have reached our destinationBusiness Insider – Feb 7, 2018
2018 Strategic Outlook
John Nicola, Chairman & CEO
Where are markets going?
Many Happy Returns (1870-2015)
Asset Class Returns 1870-2015 (NBER)
4.6%
6.1%
11.1% 10.8%
3.3%
8.9%
10.7%
22.8%
T-Bills Bonds Real Estate Equities
Nominal Return Volatility
Same Return
Liquidity and
behaviour
Great Expectations
Cape Shiller 10-Year PE (peaks)
1929
1936
1966
2000
2008
2018
Higher than 1929
0.2%
-0.8%
-2.2%
-0.9%
2.3%
-0.3%
4.0%
1929 1937 1966 2000 2008 Average Goal
No real return
for five years
5 Year 60/40 Balanced
After Inflation and Fees After CAPE Peak
Our Asset Allocation
CDN/US
CDN /
Foreign
(Private &
Public)
Bonds
Mortgages
Private Debt
Hedge Funds
Precious Metals
Real Estate
20%
Equity
38%Fixed
Income
36%
Alternative
6%
-2.1%
-0.1%
-1.1%
4.0%
5.1%
3.1%
4.1% 4.0%
2000 2008 Average Goal
60/40 vs. Core Net of Inflation and Fees
5 Years After CAPE Peak
Less Risk and More Return
13% more
over 20 years
and 30% less risk
7.2%/year
6.7%/year
Much bigger
difference in
bear markets
3.17% +74%
14%
Less
Harbour Towers Hotel & Suites
Acquired: October 2015
Purchase Price: $23.0 M
Hotel Rooms: 196
Pre-Acquisition
• NOI – $1.5M
• NOI Yield – 6.5%
• Occupancy – 62%
• ADR* – $130
Post-Acquisition (2016)
• NOI – $2.0M
• NOI Yield – 8.7%
• Occupancy – 70%
• ADR* – $148
*Average Daily Rate
Acquisition, Victoria
Harbour Towers – Value Creation
Multi-Family Rental Conversion
219 New Rental Units
Projected Cost: ~$56.4 M
Projected Value: ~$67 M
Return on Cost: ~19%
Projected IRR: ~17% BEFORE
AFTER
Transportation as a Service (TaaS)
• By 2030, 95% of all Passenger Miles will be
by Automated Electric Vehicles (AEVs)
• This will add about $5600 per family in
discretionary spending (10% of income or
$1 trillion)
• There will be minimal production of
Internal Combustion Engines (ICEs) or
individual ownership of cars.
• IO cars will be 40% of the fleet, but 5% of
passenger miles
• AEVs will have a lifetime mileage capacity
between 500,000 and 1 million miles
Transportation as a Service (TaaS)
• TaaS will be 4 to 10 times cheaper than
traditional owner driving
• Pre-TaaS companies (Uber and Lyft) drove
500,000 passengers per day in NYC in 2016
• By 2030 passenger cars in the US will drop
from 237 million to 44 million
• 70% fewer cars manufactured annually
• 50% more passenger miles in total at a cost
of $400 billion vs. $1.5 trillion today
Transportation as a Service (TaaS)
• Oil demand would drop to 70 million BPD
from what is predicted by the IEA at 110 million
BPD
• Price of oil could drop to $25 and make 50% or
more of North American Oil uncommercial but
still leave us energy independent
• Keystone and Dakota Access Pipeline would be
stranded
• Energy requirements would drop by 80% and
emissions by 90%
• Huge impact on oil industry, autos/trucks, auto
insurance
• Big geopolitical outcomes (impact on Canada?)
39% Saudi Arabia
15% Russia
1% US
5% Canada
Oil Dependency
Cheaper oil
Who needs oil?
10M+ Barrels/Day
• When will this occur?
• Winners/Losers?
• Impact on related
products and services?
• Impact on portfolio
mix?
Renewable Energy
6x
62
Solar Power
More potential close to people
This needs this
What will get in the way?
If they build them
will they work ?
Drill down
Documents
Newsletters
Net Worth Retirement and
Estate projections
Trust Fund Buddies
Tax Reform 2017
What’s Being Plucked?
• Income splitting of dividends from private corporations
• Increase tax on passive corporate income that could reach 71% when paid
out as dividends
• Pipeline planning that converts dividends to capital gains is prevented
How is the Goose Doing Now?
• Income splitting allowed over age 65 with a spouse
• Otherwise no, unless labour or financial contribution
• Passive rules stay the same except reduction in SBD if passive income over
$50,000/year; more expensive to recover RDTOH in some cases
• Integrated tax on passive income can be as high as 56% in Ontario
Tax Reform 2018
Before Tax Reform
• Dividend compensation if SBD
• Income split using dividends and trust
• Accumulate passive assets in CCPC
and recover RDTOH when dividends
paid
• SBD not impacted by passive assets
After Tax Reform
• Salary RRSP/IPP better
• Over 65 on with spouse otherwise
labour or capital
• CCPC still better but try and minimize
taxable passive income
• Start losing SBD at $50,000 of passive
income. 100% gone at $150,000. Does
it make much difference?
Cdn Equities
25%
Foreign
Equities
15%
Real Estate
35%
Life Insurance
10%
Pref. Shares
5%
Private Equity
5%
Alternatives
5%
Asset Allocation for Taxable Private Corporation
Historical Tax Analysis
11.5%
9.7%10.1%
5.0% 4.6% 5.4% 5.9%
9.3%
Annual Returns
53.0%
41.0%
17.0%
0.0%
75.0%
20.0%
5.0%
30.0%
% Taxable
15.2%
Bonds
15%
Mortgages
30%
High Yield
Bonds
15%
Global
Bonds
15%
Private Debt
25%
Asset Allocation for Registered Plans and Foundations
Interest Bearing
Tax deferred in
registered accts.
Expected Return 6% Expected Return 7.5%
• $2.2M portfolio in
private company
• Qualifies for SBD
What is overall tax and
tax rate going forward?
A Tale of Two Taxpayers
Actual 60/40 performance (Morningstar Canadian Neutral Balanced) 4.67%. Actual client performance (NWM Core Composite model) 7.14%.
Jan 1, 2000 to Dec 31, 2017
$170,000
$50,000
$23,500
$0 $0
$23,500
Total return Taxable return Corporate tax Impact on SBD Additional tax Total tax
$140,000
$72,000
$34,200
$110,000
$16,500
$50,700
Total return Taxable return Corporate tax Impact on SBD Additional tax Total tax
21% more return, 54% less tax
13.8%
36.2%
Tax Efficient Portfolio Analysis
Saving Corporately $100,000 pre-tax income
$88,000
$73,000
$12,000
$27,000
12% Business Tax 27% Business Tax
Tax
Saving
20% more
to save
Assumptions
• Save for 30 years
• 6% after tax return
• Take out income at
retirement as dividends
$7,300,000
$6,100,000
Assets in 30 years
SBD General Rate
20% more
saved
$227,000
$213,000
Spendable Income
Wealth Accumulation Corporately
$7,300,000
$6,100,000
Assets in 30 years
SBD
General Rate
6.5%
less
$290,000/yr.
$250,000/yr.
20% more
saved
Planning Factors
• Corporate assets
• Age
• Business Income
• Spending needs
Planning needs to be customized and will change over time.
Planning Options
Tax Efficient Asset Allocation
IPP vs. RRSP
Over Age 50
Prescribed Rate
Loans
Insurance With or
Without Leverage
School Tax
• $2000/year at $4M
• $6000/year at $5M
• $26,000/year @$10M (100% increase)
• Not applicable to rental apartment buildings
• Not applicable to commercial/industrial or retail real estate
• Town Hall meeting May 1st 6:00pm St. James Community Square 3214 West 10th
Avenue
To Sum
it Up
Good Neighborhood Turning Bad Treading Water?
Disruptive Technologies Managing Tax Reform
THANK YOU
This presentation contains the current opinions of the presenter and such opinions are subject to change without notice. This material is distributed for informational purposes
only and is not intended to provide legal, accounting, tax or specific investment advice. Please speak to your NWM Advisor regarding your unique situation. Forecasts, estimates,
and certain information contained herein are based upon proprietary research and should not be considered as investment advice or a recommendation of any particular security,
strategy or investment product. NWM fund returns are quoted net of fund-level expenses. Past performance is not indicative of future results. All investments contain risk and
may gain or lose value. NWM is registered as a Portfolio Manager, Exempt Market Dealer and Investment Fund Manager with the required provincial securities’ commissions.

More Related Content

What's hot

Women in angel investing s 2020 0615 1247 pst
Women in angel investing s  2020 0615 1247 pstWomen in angel investing s  2020 0615 1247 pst
Women in angel investing s 2020 0615 1247 pst
Elaine Werffeli
 
Retire with rentals
Retire with rentalsRetire with rentals
Retire with rentals
Bobby Sharma
 
SAC XIV Accelerating Economic Growth & Innovation through Angel Investing Nov...
SAC XIV Accelerating Economic Growth & Innovation through Angel Investing Nov...SAC XIV Accelerating Economic Growth & Innovation through Angel Investing Nov...
SAC XIV Accelerating Economic Growth & Innovation through Angel Investing Nov...
Elaine Werffeli
 
SAC Learning Series Angel Investing 101
SAC Learning Series Angel Investing 101 SAC Learning Series Angel Investing 101
SAC Learning Series Angel Investing 101
Elaine Werffeli
 
Institutional Pitchbook
Institutional PitchbookInstitutional Pitchbook
Institutional PitchbookSam Vong
 
Physician Loans USA
Physician Loans USAPhysician Loans USA
Physician Loans USA
ChaDeiparine
 
SVN Live Weekly Property Broadcast 4.16.18
SVN Live Weekly Property Broadcast 4.16.18SVN Live Weekly Property Broadcast 4.16.18
SVN Live Weekly Property Broadcast 4.16.18
Donna VanSchagen
 
2018 Economic Summit for OCHAR members
2018 Economic Summit for OCHAR members2018 Economic Summit for OCHAR members
2018 Economic Summit for OCHAR members
Cub Berrian
 
Nielsen investor-day-consolidated-deck full
Nielsen investor-day-consolidated-deck fullNielsen investor-day-consolidated-deck full
Nielsen investor-day-consolidated-deck full
nielsen_holdings
 
State of the Property Market In Australia - The Risks and Opportunities for I...
State of the Property Market In Australia - The Risks and Opportunities for I...State of the Property Market In Australia - The Risks and Opportunities for I...
State of the Property Market In Australia - The Risks and Opportunities for I...
First In Finance
 
Buying a Home Fall 2018
Buying a Home Fall 2018Buying a Home Fall 2018
Buying a Home Fall 2018
marlenebland
 
Buying a Home Fall 2018
Buying a Home Fall 2018Buying a Home Fall 2018
Buying a Home Fall 2018
Dwell Real Estate - South Jersey
 
Ari halo report 2014 final
Ari halo report 2014   finalAri halo report 2014   final
Ari halo report 2014 final
angelresource1
 
A Way Forward on the Alaska Budget (1.22.2016)
A Way Forward on the Alaska Budget (1.22.2016)A Way Forward on the Alaska Budget (1.22.2016)
A Way Forward on the Alaska Budget (1.22.2016)
Brad Keithley
 
Alaska’s budget (5.2.2015)
Alaska’s budget (5.2.2015)Alaska’s budget (5.2.2015)
Alaska’s budget (5.2.2015)
Brad Keithley
 
Presentation to Alliance Emerging Leaders (11.1.2016)
Presentation to Alliance Emerging Leaders (11.1.2016)Presentation to Alliance Emerging Leaders (11.1.2016)
Presentation to Alliance Emerging Leaders (11.1.2016)
Brad Keithley
 
Q2 2014 Halo Report
Q2 2014 Halo Report Q2 2014 Halo Report
Q2 2014 Halo Report
sdickey
 
A Millennial’s Guide to Homeownership | KM Realty Group Chicago, IL
A Millennial’s Guide to Homeownership | KM Realty Group Chicago, ILA Millennial’s Guide to Homeownership | KM Realty Group Chicago, IL
A Millennial’s Guide to Homeownership | KM Realty Group Chicago, IL
Tammy Jackson
 
Why Ace Capital Group? - Land Banking Expert
Why Ace Capital Group? - Land Banking ExpertWhy Ace Capital Group? - Land Banking Expert
Why Ace Capital Group? - Land Banking Expert
Ace Capital Group
 

What's hot (20)

Women in angel investing s 2020 0615 1247 pst
Women in angel investing s  2020 0615 1247 pstWomen in angel investing s  2020 0615 1247 pst
Women in angel investing s 2020 0615 1247 pst
 
Retire with rentals
Retire with rentalsRetire with rentals
Retire with rentals
 
SAC XIV Accelerating Economic Growth & Innovation through Angel Investing Nov...
SAC XIV Accelerating Economic Growth & Innovation through Angel Investing Nov...SAC XIV Accelerating Economic Growth & Innovation through Angel Investing Nov...
SAC XIV Accelerating Economic Growth & Innovation through Angel Investing Nov...
 
SAC Learning Series Angel Investing 101
SAC Learning Series Angel Investing 101 SAC Learning Series Angel Investing 101
SAC Learning Series Angel Investing 101
 
Institutional Pitchbook
Institutional PitchbookInstitutional Pitchbook
Institutional Pitchbook
 
Physician Loans USA
Physician Loans USAPhysician Loans USA
Physician Loans USA
 
SVN Live Weekly Property Broadcast 4.16.18
SVN Live Weekly Property Broadcast 4.16.18SVN Live Weekly Property Broadcast 4.16.18
SVN Live Weekly Property Broadcast 4.16.18
 
2018 Economic Summit for OCHAR members
2018 Economic Summit for OCHAR members2018 Economic Summit for OCHAR members
2018 Economic Summit for OCHAR members
 
Nielsen investor-day-consolidated-deck full
Nielsen investor-day-consolidated-deck fullNielsen investor-day-consolidated-deck full
Nielsen investor-day-consolidated-deck full
 
State of the Property Market In Australia - The Risks and Opportunities for I...
State of the Property Market In Australia - The Risks and Opportunities for I...State of the Property Market In Australia - The Risks and Opportunities for I...
State of the Property Market In Australia - The Risks and Opportunities for I...
 
Buying a Home Fall 2018
Buying a Home Fall 2018Buying a Home Fall 2018
Buying a Home Fall 2018
 
Buying a Home Fall 2018
Buying a Home Fall 2018Buying a Home Fall 2018
Buying a Home Fall 2018
 
Ari halo report 2014 final
Ari halo report 2014   finalAri halo report 2014   final
Ari halo report 2014 final
 
A Way Forward on the Alaska Budget (1.22.2016)
A Way Forward on the Alaska Budget (1.22.2016)A Way Forward on the Alaska Budget (1.22.2016)
A Way Forward on the Alaska Budget (1.22.2016)
 
12 tmire dec_us_2010
12 tmire dec_us_201012 tmire dec_us_2010
12 tmire dec_us_2010
 
Alaska’s budget (5.2.2015)
Alaska’s budget (5.2.2015)Alaska’s budget (5.2.2015)
Alaska’s budget (5.2.2015)
 
Presentation to Alliance Emerging Leaders (11.1.2016)
Presentation to Alliance Emerging Leaders (11.1.2016)Presentation to Alliance Emerging Leaders (11.1.2016)
Presentation to Alliance Emerging Leaders (11.1.2016)
 
Q2 2014 Halo Report
Q2 2014 Halo Report Q2 2014 Halo Report
Q2 2014 Halo Report
 
A Millennial’s Guide to Homeownership | KM Realty Group Chicago, IL
A Millennial’s Guide to Homeownership | KM Realty Group Chicago, ILA Millennial’s Guide to Homeownership | KM Realty Group Chicago, IL
A Millennial’s Guide to Homeownership | KM Realty Group Chicago, IL
 
Why Ace Capital Group? - Land Banking Expert
Why Ace Capital Group? - Land Banking ExpertWhy Ace Capital Group? - Land Banking Expert
Why Ace Capital Group? - Land Banking Expert
 

Similar to 2018 Market Outlook Presentation - Vancouver

2018 Strategic Outlook Presentation - CALGARY
2018 Strategic Outlook Presentation - CALGARY2018 Strategic Outlook Presentation - CALGARY
2018 Strategic Outlook Presentation - CALGARY
Nicola Wealth Management
 
2018 Strategic Outlook Presentation - TORONTO
2018 Strategic Outlook Presentation - TORONTO2018 Strategic Outlook Presentation - TORONTO
2018 Strategic Outlook Presentation - TORONTO
Nicola Wealth Management
 
2018 Market Outlook Seminar - Kelowna
2018 Market Outlook Seminar - Kelowna2018 Market Outlook Seminar - Kelowna
2018 Market Outlook Seminar - Kelowna
Nicola Wealth Management
 
2017 Strategic Outlook Presentation - Toronto
2017 Strategic Outlook Presentation - Toronto2017 Strategic Outlook Presentation - Toronto
2017 Strategic Outlook Presentation - Toronto
Nicola Wealth Management
 
The world of CRE Finance
The world of CRE FinanceThe world of CRE Finance
The world of CRE Finance
Holland2012
 
The World of CRE Finance
The World of CRE FinanceThe World of CRE Finance
The World of CRE Finance
EDR
 
Grow + Sell Your Business Part Three: Practical Tips To Facilitate a Transaction
Grow + Sell Your Business Part Three: Practical Tips To Facilitate a TransactionGrow + Sell Your Business Part Three: Practical Tips To Facilitate a Transaction
Grow + Sell Your Business Part Three: Practical Tips To Facilitate a Transaction
Kegler Brown Hill + Ritter
 
2017 cage presentation v final (print)
2017 cage presentation v final (print)2017 cage presentation v final (print)
2017 cage presentation v final (print)
Sysco_Investors
 
Strategic Outlook 2023 - Part 1.pptx
Strategic Outlook 2023 - Part 1.pptxStrategic Outlook 2023 - Part 1.pptx
Strategic Outlook 2023 - Part 1.pptx
Nicola Wealth
 
November 2018 Economic Minute with Dennis Hoffman
November 2018 Economic Minute with Dennis HoffmanNovember 2018 Economic Minute with Dennis Hoffman
November 2018 Economic Minute with Dennis Hoffman
Shay Moser
 
EBA 2018 Market Forecast by Dianne Crocker
EBA 2018 Market Forecast by Dianne CrockerEBA 2018 Market Forecast by Dianne Crocker
EBA 2018 Market Forecast by Dianne Crocker
Dianne P. Crocker
 
Bluegrass community bankers valuation jkd 18 08-27
Bluegrass community bankers valuation jkd 18 08-27Bluegrass community bankers valuation jkd 18 08-27
Bluegrass community bankers valuation jkd 18 08-27
Mercer Capital
 
Netwealth portfolio construction series: Economic Update with Roger Montgomery
Netwealth portfolio construction series: Economic Update with Roger MontgomeryNetwealth portfolio construction series: Economic Update with Roger Montgomery
Netwealth portfolio construction series: Economic Update with Roger Montgomery
netwealthInvest
 
Intuit Annual Shareholder Meeting 2017
Intuit Annual Shareholder Meeting 2017Intuit Annual Shareholder Meeting 2017
Intuit Annual Shareholder Meeting 2017
investorsintuitinc
 
Riders on a storm by Neil Robson
Riders on a storm by Neil RobsonRiders on a storm by Neil Robson
Riders on a storm by Neil Robson
Stanlb2018
 
Riders on a storm by Neil Robson
Riders on a storm by Neil RobsonRiders on a storm by Neil Robson
Riders on a storm by Neil Robson
STANLIB
 
Opeb investments the danger in playing it safe
Opeb investments the danger in playing it safeOpeb investments the danger in playing it safe
Opeb investments the danger in playing it safe
Jim van Iwaarden
 
2019 LAS - Annuity update
2019 LAS - Annuity update2019 LAS - Annuity update
2019 LAS - Annuity update
Nicholas Carbo, FSA, MAAA
 
Economic Overview
Economic OverviewEconomic Overview
Economic Overview
Nicola Wealth
 

Similar to 2018 Market Outlook Presentation - Vancouver (20)

2018 Strategic Outlook Presentation - CALGARY
2018 Strategic Outlook Presentation - CALGARY2018 Strategic Outlook Presentation - CALGARY
2018 Strategic Outlook Presentation - CALGARY
 
2018 Strategic Outlook Presentation - TORONTO
2018 Strategic Outlook Presentation - TORONTO2018 Strategic Outlook Presentation - TORONTO
2018 Strategic Outlook Presentation - TORONTO
 
2018 Market Outlook Seminar - Kelowna
2018 Market Outlook Seminar - Kelowna2018 Market Outlook Seminar - Kelowna
2018 Market Outlook Seminar - Kelowna
 
2017 Strategic Outlook Presentation - Toronto
2017 Strategic Outlook Presentation - Toronto2017 Strategic Outlook Presentation - Toronto
2017 Strategic Outlook Presentation - Toronto
 
The world of CRE Finance
The world of CRE FinanceThe world of CRE Finance
The world of CRE Finance
 
The World of CRE Finance
The World of CRE FinanceThe World of CRE Finance
The World of CRE Finance
 
Grow + Sell Your Business Part Three: Practical Tips To Facilitate a Transaction
Grow + Sell Your Business Part Three: Practical Tips To Facilitate a TransactionGrow + Sell Your Business Part Three: Practical Tips To Facilitate a Transaction
Grow + Sell Your Business Part Three: Practical Tips To Facilitate a Transaction
 
2017 cage presentation v final (print)
2017 cage presentation v final (print)2017 cage presentation v final (print)
2017 cage presentation v final (print)
 
Strategic Outlook 2023 - Part 1.pptx
Strategic Outlook 2023 - Part 1.pptxStrategic Outlook 2023 - Part 1.pptx
Strategic Outlook 2023 - Part 1.pptx
 
November 2018 Economic Minute with Dennis Hoffman
November 2018 Economic Minute with Dennis HoffmanNovember 2018 Economic Minute with Dennis Hoffman
November 2018 Economic Minute with Dennis Hoffman
 
EBA 2018 Market Forecast by Dianne Crocker
EBA 2018 Market Forecast by Dianne CrockerEBA 2018 Market Forecast by Dianne Crocker
EBA 2018 Market Forecast by Dianne Crocker
 
Bluegrass community bankers valuation jkd 18 08-27
Bluegrass community bankers valuation jkd 18 08-27Bluegrass community bankers valuation jkd 18 08-27
Bluegrass community bankers valuation jkd 18 08-27
 
Netwealth portfolio construction series: Economic Update with Roger Montgomery
Netwealth portfolio construction series: Economic Update with Roger MontgomeryNetwealth portfolio construction series: Economic Update with Roger Montgomery
Netwealth portfolio construction series: Economic Update with Roger Montgomery
 
Intuit Annual Shareholder Meeting 2017
Intuit Annual Shareholder Meeting 2017Intuit Annual Shareholder Meeting 2017
Intuit Annual Shareholder Meeting 2017
 
Riders on a storm by Neil Robson
Riders on a storm by Neil RobsonRiders on a storm by Neil Robson
Riders on a storm by Neil Robson
 
Riders on a storm by Neil Robson
Riders on a storm by Neil RobsonRiders on a storm by Neil Robson
Riders on a storm by Neil Robson
 
Mipim webinar
Mipim   webinarMipim   webinar
Mipim webinar
 
Opeb investments the danger in playing it safe
Opeb investments the danger in playing it safeOpeb investments the danger in playing it safe
Opeb investments the danger in playing it safe
 
2019 LAS - Annuity update
2019 LAS - Annuity update2019 LAS - Annuity update
2019 LAS - Annuity update
 
Economic Overview
Economic OverviewEconomic Overview
Economic Overview
 

Recently uploaded

innovative-invoice-discounting-platforms-in-india-empowering-retail-investors...
innovative-invoice-discounting-platforms-in-india-empowering-retail-investors...innovative-invoice-discounting-platforms-in-india-empowering-retail-investors...
innovative-invoice-discounting-platforms-in-india-empowering-retail-investors...
Falcon Invoice Discounting
 
The Role of Non-Banking Financial Companies (NBFCs)
The Role of Non-Banking Financial Companies (NBFCs)The Role of Non-Banking Financial Companies (NBFCs)
The Role of Non-Banking Financial Companies (NBFCs)
nickysharmasucks
 
Scope Of Macroeconomics introduction and basic theories
Scope Of Macroeconomics introduction and basic theoriesScope Of Macroeconomics introduction and basic theories
Scope Of Macroeconomics introduction and basic theories
nomankalyar153
 
一比一原版(UCSB毕业证)圣芭芭拉分校毕业证如何办理
一比一原版(UCSB毕业证)圣芭芭拉分校毕业证如何办理一比一原版(UCSB毕业证)圣芭芭拉分校毕业证如何办理
一比一原版(UCSB毕业证)圣芭芭拉分校毕业证如何办理
bbeucd
 
What website can I sell pi coins securely.
What website can I sell pi coins securely.What website can I sell pi coins securely.
What website can I sell pi coins securely.
DOT TECH
 
Analyzing the instability of equilibrium in thr harrod domar model
Analyzing the instability of equilibrium in thr harrod domar modelAnalyzing the instability of equilibrium in thr harrod domar model
Analyzing the instability of equilibrium in thr harrod domar model
ManthanBhardwaj4
 
how to swap pi coins to foreign currency withdrawable.
how to swap pi coins to foreign currency withdrawable.how to swap pi coins to foreign currency withdrawable.
how to swap pi coins to foreign currency withdrawable.
DOT TECH
 
Instant Issue Debit Cards - High School Spirit
Instant Issue Debit Cards - High School SpiritInstant Issue Debit Cards - High School Spirit
Instant Issue Debit Cards - High School Spirit
egoetzinger
 
USDA Loans in California: A Comprehensive Overview.pptx
USDA Loans in California: A Comprehensive Overview.pptxUSDA Loans in California: A Comprehensive Overview.pptx
USDA Loans in California: A Comprehensive Overview.pptx
marketing367770
 
Tumelo-deep-dive-into-pass-through-voting-Feb23 (1).pdf
Tumelo-deep-dive-into-pass-through-voting-Feb23 (1).pdfTumelo-deep-dive-into-pass-through-voting-Feb23 (1).pdf
Tumelo-deep-dive-into-pass-through-voting-Feb23 (1).pdf
Henry Tapper
 
Eco-Innovations and Firm Heterogeneity. Evidence from Italian Family and Nonf...
Eco-Innovations and Firm Heterogeneity.Evidence from Italian Family and Nonf...Eco-Innovations and Firm Heterogeneity.Evidence from Italian Family and Nonf...
Eco-Innovations and Firm Heterogeneity. Evidence from Italian Family and Nonf...
University of Calabria
 
The European Unemployment Puzzle: implications from population aging
The European Unemployment Puzzle: implications from population agingThe European Unemployment Puzzle: implications from population aging
The European Unemployment Puzzle: implications from population aging
GRAPE
 
Seminar: Gender Board Diversity through Ownership Networks
Seminar: Gender Board Diversity through Ownership NetworksSeminar: Gender Board Diversity through Ownership Networks
Seminar: Gender Board Diversity through Ownership Networks
GRAPE
 
Role of Information Technology in Revenue - Prof Oyedokun.pptx
Role of Information Technology in Revenue  - Prof Oyedokun.pptxRole of Information Technology in Revenue  - Prof Oyedokun.pptx
Role of Information Technology in Revenue - Prof Oyedokun.pptx
Godwin Emmanuel Oyedokun MBA MSc PhD FCA FCTI FCNA CFE FFAR
 
Patronage and Good Governance 5.pptx pptc
Patronage and Good Governance 5.pptx pptcPatronage and Good Governance 5.pptx pptc
Patronage and Good Governance 5.pptx pptc
AbdulNasirNichari
 
This assessment plan proposal is to outline a structured approach to evaluati...
This assessment plan proposal is to outline a structured approach to evaluati...This assessment plan proposal is to outline a structured approach to evaluati...
This assessment plan proposal is to outline a structured approach to evaluati...
lamluanvan.net Viết thuê luận văn
 
how to sell pi coins in South Korea profitably.
how to sell pi coins in South Korea profitably.how to sell pi coins in South Korea profitably.
how to sell pi coins in South Korea profitably.
DOT TECH
 
where can I find a legit pi merchant online
where can I find a legit pi merchant onlinewhere can I find a legit pi merchant online
where can I find a legit pi merchant online
DOT TECH
 
Earn a passive income with prosocial investing
Earn a passive income with prosocial investingEarn a passive income with prosocial investing
Earn a passive income with prosocial investing
Colin R. Turner
 
Pensions and housing - Pensions PlayPen - 4 June 2024 v3 (1).pdf
Pensions and housing - Pensions PlayPen - 4 June 2024 v3 (1).pdfPensions and housing - Pensions PlayPen - 4 June 2024 v3 (1).pdf
Pensions and housing - Pensions PlayPen - 4 June 2024 v3 (1).pdf
Henry Tapper
 

Recently uploaded (20)

innovative-invoice-discounting-platforms-in-india-empowering-retail-investors...
innovative-invoice-discounting-platforms-in-india-empowering-retail-investors...innovative-invoice-discounting-platforms-in-india-empowering-retail-investors...
innovative-invoice-discounting-platforms-in-india-empowering-retail-investors...
 
The Role of Non-Banking Financial Companies (NBFCs)
The Role of Non-Banking Financial Companies (NBFCs)The Role of Non-Banking Financial Companies (NBFCs)
The Role of Non-Banking Financial Companies (NBFCs)
 
Scope Of Macroeconomics introduction and basic theories
Scope Of Macroeconomics introduction and basic theoriesScope Of Macroeconomics introduction and basic theories
Scope Of Macroeconomics introduction and basic theories
 
一比一原版(UCSB毕业证)圣芭芭拉分校毕业证如何办理
一比一原版(UCSB毕业证)圣芭芭拉分校毕业证如何办理一比一原版(UCSB毕业证)圣芭芭拉分校毕业证如何办理
一比一原版(UCSB毕业证)圣芭芭拉分校毕业证如何办理
 
What website can I sell pi coins securely.
What website can I sell pi coins securely.What website can I sell pi coins securely.
What website can I sell pi coins securely.
 
Analyzing the instability of equilibrium in thr harrod domar model
Analyzing the instability of equilibrium in thr harrod domar modelAnalyzing the instability of equilibrium in thr harrod domar model
Analyzing the instability of equilibrium in thr harrod domar model
 
how to swap pi coins to foreign currency withdrawable.
how to swap pi coins to foreign currency withdrawable.how to swap pi coins to foreign currency withdrawable.
how to swap pi coins to foreign currency withdrawable.
 
Instant Issue Debit Cards - High School Spirit
Instant Issue Debit Cards - High School SpiritInstant Issue Debit Cards - High School Spirit
Instant Issue Debit Cards - High School Spirit
 
USDA Loans in California: A Comprehensive Overview.pptx
USDA Loans in California: A Comprehensive Overview.pptxUSDA Loans in California: A Comprehensive Overview.pptx
USDA Loans in California: A Comprehensive Overview.pptx
 
Tumelo-deep-dive-into-pass-through-voting-Feb23 (1).pdf
Tumelo-deep-dive-into-pass-through-voting-Feb23 (1).pdfTumelo-deep-dive-into-pass-through-voting-Feb23 (1).pdf
Tumelo-deep-dive-into-pass-through-voting-Feb23 (1).pdf
 
Eco-Innovations and Firm Heterogeneity. Evidence from Italian Family and Nonf...
Eco-Innovations and Firm Heterogeneity.Evidence from Italian Family and Nonf...Eco-Innovations and Firm Heterogeneity.Evidence from Italian Family and Nonf...
Eco-Innovations and Firm Heterogeneity. Evidence from Italian Family and Nonf...
 
The European Unemployment Puzzle: implications from population aging
The European Unemployment Puzzle: implications from population agingThe European Unemployment Puzzle: implications from population aging
The European Unemployment Puzzle: implications from population aging
 
Seminar: Gender Board Diversity through Ownership Networks
Seminar: Gender Board Diversity through Ownership NetworksSeminar: Gender Board Diversity through Ownership Networks
Seminar: Gender Board Diversity through Ownership Networks
 
Role of Information Technology in Revenue - Prof Oyedokun.pptx
Role of Information Technology in Revenue  - Prof Oyedokun.pptxRole of Information Technology in Revenue  - Prof Oyedokun.pptx
Role of Information Technology in Revenue - Prof Oyedokun.pptx
 
Patronage and Good Governance 5.pptx pptc
Patronage and Good Governance 5.pptx pptcPatronage and Good Governance 5.pptx pptc
Patronage and Good Governance 5.pptx pptc
 
This assessment plan proposal is to outline a structured approach to evaluati...
This assessment plan proposal is to outline a structured approach to evaluati...This assessment plan proposal is to outline a structured approach to evaluati...
This assessment plan proposal is to outline a structured approach to evaluati...
 
how to sell pi coins in South Korea profitably.
how to sell pi coins in South Korea profitably.how to sell pi coins in South Korea profitably.
how to sell pi coins in South Korea profitably.
 
where can I find a legit pi merchant online
where can I find a legit pi merchant onlinewhere can I find a legit pi merchant online
where can I find a legit pi merchant online
 
Earn a passive income with prosocial investing
Earn a passive income with prosocial investingEarn a passive income with prosocial investing
Earn a passive income with prosocial investing
 
Pensions and housing - Pensions PlayPen - 4 June 2024 v3 (1).pdf
Pensions and housing - Pensions PlayPen - 4 June 2024 v3 (1).pdfPensions and housing - Pensions PlayPen - 4 June 2024 v3 (1).pdf
Pensions and housing - Pensions PlayPen - 4 June 2024 v3 (1).pdf
 

2018 Market Outlook Presentation - Vancouver

  • 1. Welcome | 2018 Strategic Outlook Introduction by David Sung, President
  • 3.
  • 4.
  • 5.
  • 7.
  • 8.
  • 9.
  • 10. 2018 Strategic Outlook Rob Edel, Chief Investment Officer
  • 11. Our Agenda Investment Roadmap2017 in Review Good Neighborhood Turning Bad Points of Interest Oct 19, 1987 Oct 18, 2017
  • 12. 2017 in Review S&P 500 2017 S&P 500 +21.8% +1% Declines Last +5% Decline June 24-27 2016 Feb 2, 2018 404 Days Average since 1929 92 Days Feb 8, 2018 -10.1% 2017 S&P 500 +21.8% 1%+ Declines
  • 13. 2017 in Review S&P/TSX Sept 8, 2017 +9.2% 2017 S&P/TSX +9.1%
  • 14. 2017 in Review Canadian and U.S. Yield Curves Yield Curve Yield Curve Dec 31, 2017 Dec 30, 2016 Dec 31, 2017 Dec 30, 2016 0.74% 1.69% 2.04% 1.72% +95 bps +32 bps 1.19% 1.88% 2.44% 2.41% +69 bps Mar 20, 2018
  • 15. Investment Road Map The Art of Forecasting – Tricks of the Trade Business Insider Jan 4, 2016
  • 17. Investment Road Map Maximum sustainable output Recession rate cuts Early recovery, low inflation, low policy rates Late recovery, rate hikes, rising inflation Stagflation, High Inflation Slowing Growth Rate Cuts Rate Hikes TimeFederal reserve: +1.8%
  • 18. Investment Road Map The Daily Shot – Jan 9, 2018
  • 19. Investment Road Map Maximum sustainable output Federal reserve: +1.8% Rate Hikes INFLATION
  • 20. Investment Road Map Barron’s – Dec 30, 2017 The Daily Shot – Jan 30, 2017 5% 10 Year3.5% 10 Year
  • 24. Morgan Stanley Research – Sunday Start – What’s Next in Global Macro Dec 10, 2017 Investment Road Map U.S. Tax Reform: • Corp rate 35% to 21% • U.S. Corporations hold estimated $2.6 trillion overseas • Full expensing of business investment for five years
  • 26. Bad Neighborhood Trump Source: Financial Times, February 2018 Trade War – China North Korea Syria/Middle East Mueller Investigation Stormy Daniels Tomorrows Headlines Hedgeye – Cartoon of the Day – Mar 5, 2018
  • 28. Bad Neighborhood Monetary Policy Past 7 recessions Fed cuts rates +500 bps Fed Funds - 1.50% Expected Peak – 3.0% Can’t cut 500 bps
  • 29. Bad Neighborhood Fiscal Policy JP Morgan Michael Cembalest “Eye on the Market – Feb 21, 2018
  • 30. Bad Neighborhood Debt: Canadian Consumer WSJ – Feb 19, 2018 https://www.bankofcanada.ca/wp-content/uploads/2017/12/san2017-24.pdf
  • 31. Bad Neighborhood DEFLATION INFLATION Secular Stagnation Low Productivity High Debt Levels Stagflation Inflationary Expectations
  • 33. Bloomberg – Feb 3, 2018 Points of Interest Bitcoin: Blockchain MIT Study: $270 - $317 million raised by ICO’s are frauds or scams Charles Kindleberger: “There is nothing so disturbing to one’s wellbeing and judgement as to see a friend get rich.” Blockchain • A secure database, or ledger, spread across multiple computers Bitcoin • Digital Global Currency – used for everyday transactions? • Store of value? • Bitcoin Energy Consumption Index = Algeria
  • 34. Points of Interest Bitcoin: Useless Etherium Token Contributions in US$’s - $276,342 Enough to buy 230 televisions!
  • 35. Points of Interest Marijuana 1 Year Cannabis Stock Performance Barron’s – Mar 30, 2018 Canopy CEO Bruce LintonROB Magazine – Nov 12, 2017 Barely existed 3 years ago Now dozens of companies ~$30 billion market cap
  • 36. Points of Interest Marijuana Globe & Mail – Feb 8, 2018Globe & Mail – Feb 8, 2018 Barron’s Mar 30, 2018 60 Private and public companies Health Canada granted 89 licenses Feb 1 – 244 more in review stage Oregon/Colorado – wholesale $0.50 - $2.00 Commodity business Low barriers to entry No sustainable advantage Canada • Deloitte: After legalization • $4.9-$8.7 billion market • Low=rum, High=wine • Price: $10/gram initially Constellation Brands • U.S. $50 billion Market • Global: $200 billion in 15 years • Wine: $60 billion • Tobacco: $75 billion
  • 37. Points of Interest Active vs. Passive Investing Strategas – Technical Strategy & Analysis October, 2017  Active equity mutual funds • 2009-2017 $1.0 trillion in outflows  ETFs - Passive • 2009-2017 $1.7 trillion in inflows • 44% of equity AUM ETFs or passive mutual funds Strategas Technical Analysis Research – May 16, 2017
  • 38. Points of Interest Active vs. Passive Investing Strategas Technical Analysis Research – May 16, 2017 Low interest rates mean more bad companies are able to survive
  • 39. WSJ – Feb 13, 2018 Long time horizon $1.7 Trillion in Dry Powder Manager Selection Points of Interest Active vs. Passive Investing: Private Equity
  • 40. Summary • Next recession at least 12 months away • Conditions more challenging during next recession • Risk asset still attractive in this environment • Watch for sign of end of the cycle – lower risk exposure • Avoid investment fads • Active management to outperform • We have reached our destinationBusiness Insider – Feb 7, 2018
  • 41. 2018 Strategic Outlook John Nicola, Chairman & CEO
  • 43. Many Happy Returns (1870-2015)
  • 44. Asset Class Returns 1870-2015 (NBER) 4.6% 6.1% 11.1% 10.8% 3.3% 8.9% 10.7% 22.8% T-Bills Bonds Real Estate Equities Nominal Return Volatility Same Return Liquidity and behaviour
  • 46. Cape Shiller 10-Year PE (peaks) 1929 1936 1966 2000 2008 2018 Higher than 1929
  • 47. 0.2% -0.8% -2.2% -0.9% 2.3% -0.3% 4.0% 1929 1937 1966 2000 2008 Average Goal No real return for five years 5 Year 60/40 Balanced After Inflation and Fees After CAPE Peak
  • 48. Our Asset Allocation CDN/US CDN / Foreign (Private & Public) Bonds Mortgages Private Debt Hedge Funds Precious Metals Real Estate 20% Equity 38%Fixed Income 36% Alternative 6%
  • 49. -2.1% -0.1% -1.1% 4.0% 5.1% 3.1% 4.1% 4.0% 2000 2008 Average Goal 60/40 vs. Core Net of Inflation and Fees 5 Years After CAPE Peak
  • 50. Less Risk and More Return 13% more over 20 years and 30% less risk 7.2%/year 6.7%/year Much bigger difference in bear markets
  • 52. Harbour Towers Hotel & Suites Acquired: October 2015 Purchase Price: $23.0 M Hotel Rooms: 196 Pre-Acquisition • NOI – $1.5M • NOI Yield – 6.5% • Occupancy – 62% • ADR* – $130 Post-Acquisition (2016) • NOI – $2.0M • NOI Yield – 8.7% • Occupancy – 70% • ADR* – $148 *Average Daily Rate Acquisition, Victoria
  • 53. Harbour Towers – Value Creation Multi-Family Rental Conversion 219 New Rental Units Projected Cost: ~$56.4 M Projected Value: ~$67 M Return on Cost: ~19% Projected IRR: ~17% BEFORE AFTER
  • 54.
  • 55. Transportation as a Service (TaaS) • By 2030, 95% of all Passenger Miles will be by Automated Electric Vehicles (AEVs) • This will add about $5600 per family in discretionary spending (10% of income or $1 trillion) • There will be minimal production of Internal Combustion Engines (ICEs) or individual ownership of cars. • IO cars will be 40% of the fleet, but 5% of passenger miles • AEVs will have a lifetime mileage capacity between 500,000 and 1 million miles
  • 56. Transportation as a Service (TaaS) • TaaS will be 4 to 10 times cheaper than traditional owner driving • Pre-TaaS companies (Uber and Lyft) drove 500,000 passengers per day in NYC in 2016 • By 2030 passenger cars in the US will drop from 237 million to 44 million • 70% fewer cars manufactured annually • 50% more passenger miles in total at a cost of $400 billion vs. $1.5 trillion today
  • 57. Transportation as a Service (TaaS) • Oil demand would drop to 70 million BPD from what is predicted by the IEA at 110 million BPD • Price of oil could drop to $25 and make 50% or more of North American Oil uncommercial but still leave us energy independent • Keystone and Dakota Access Pipeline would be stranded • Energy requirements would drop by 80% and emissions by 90% • Huge impact on oil industry, autos/trucks, auto insurance • Big geopolitical outcomes (impact on Canada?)
  • 58. 39% Saudi Arabia 15% Russia 1% US 5% Canada Oil Dependency Cheaper oil Who needs oil? 10M+ Barrels/Day
  • 59. • When will this occur? • Winners/Losers? • Impact on related products and services? • Impact on portfolio mix?
  • 61. 6x
  • 62. 62 Solar Power More potential close to people
  • 63. This needs this What will get in the way?
  • 64. If they build them will they work ?
  • 66. Net Worth Retirement and Estate projections
  • 68. Tax Reform 2017 What’s Being Plucked? • Income splitting of dividends from private corporations • Increase tax on passive corporate income that could reach 71% when paid out as dividends • Pipeline planning that converts dividends to capital gains is prevented How is the Goose Doing Now? • Income splitting allowed over age 65 with a spouse • Otherwise no, unless labour or financial contribution • Passive rules stay the same except reduction in SBD if passive income over $50,000/year; more expensive to recover RDTOH in some cases • Integrated tax on passive income can be as high as 56% in Ontario
  • 69. Tax Reform 2018 Before Tax Reform • Dividend compensation if SBD • Income split using dividends and trust • Accumulate passive assets in CCPC and recover RDTOH when dividends paid • SBD not impacted by passive assets After Tax Reform • Salary RRSP/IPP better • Over 65 on with spouse otherwise labour or capital • CCPC still better but try and minimize taxable passive income • Start losing SBD at $50,000 of passive income. 100% gone at $150,000. Does it make much difference?
  • 70. Cdn Equities 25% Foreign Equities 15% Real Estate 35% Life Insurance 10% Pref. Shares 5% Private Equity 5% Alternatives 5% Asset Allocation for Taxable Private Corporation
  • 71. Historical Tax Analysis 11.5% 9.7%10.1% 5.0% 4.6% 5.4% 5.9% 9.3% Annual Returns 53.0% 41.0% 17.0% 0.0% 75.0% 20.0% 5.0% 30.0% % Taxable 15.2%
  • 72. Bonds 15% Mortgages 30% High Yield Bonds 15% Global Bonds 15% Private Debt 25% Asset Allocation for Registered Plans and Foundations Interest Bearing Tax deferred in registered accts.
  • 73.
  • 74. Expected Return 6% Expected Return 7.5% • $2.2M portfolio in private company • Qualifies for SBD What is overall tax and tax rate going forward? A Tale of Two Taxpayers Actual 60/40 performance (Morningstar Canadian Neutral Balanced) 4.67%. Actual client performance (NWM Core Composite model) 7.14%. Jan 1, 2000 to Dec 31, 2017
  • 75. $170,000 $50,000 $23,500 $0 $0 $23,500 Total return Taxable return Corporate tax Impact on SBD Additional tax Total tax $140,000 $72,000 $34,200 $110,000 $16,500 $50,700 Total return Taxable return Corporate tax Impact on SBD Additional tax Total tax 21% more return, 54% less tax 13.8% 36.2%
  • 77. Saving Corporately $100,000 pre-tax income $88,000 $73,000 $12,000 $27,000 12% Business Tax 27% Business Tax Tax Saving 20% more to save
  • 78. Assumptions • Save for 30 years • 6% after tax return • Take out income at retirement as dividends $7,300,000 $6,100,000 Assets in 30 years SBD General Rate 20% more saved
  • 79. $227,000 $213,000 Spendable Income Wealth Accumulation Corporately $7,300,000 $6,100,000 Assets in 30 years SBD General Rate 6.5% less $290,000/yr. $250,000/yr. 20% more saved
  • 80. Planning Factors • Corporate assets • Age • Business Income • Spending needs Planning needs to be customized and will change over time.
  • 81. Planning Options Tax Efficient Asset Allocation IPP vs. RRSP Over Age 50 Prescribed Rate Loans Insurance With or Without Leverage
  • 82. School Tax • $2000/year at $4M • $6000/year at $5M • $26,000/year @$10M (100% increase) • Not applicable to rental apartment buildings • Not applicable to commercial/industrial or retail real estate • Town Hall meeting May 1st 6:00pm St. James Community Square 3214 West 10th Avenue
  • 83. To Sum it Up Good Neighborhood Turning Bad Treading Water? Disruptive Technologies Managing Tax Reform
  • 84. THANK YOU This presentation contains the current opinions of the presenter and such opinions are subject to change without notice. This material is distributed for informational purposes only and is not intended to provide legal, accounting, tax or specific investment advice. Please speak to your NWM Advisor regarding your unique situation. Forecasts, estimates, and certain information contained herein are based upon proprietary research and should not be considered as investment advice or a recommendation of any particular security, strategy or investment product. NWM fund returns are quoted net of fund-level expenses. Past performance is not indicative of future results. All investments contain risk and may gain or lose value. NWM is registered as a Portfolio Manager, Exempt Market Dealer and Investment Fund Manager with the required provincial securities’ commissions.

Editor's Notes

  1. Agenda: Look at what happen last year Oct 18, 1987 versus Oct 18, 2017 – big difference in activity Next, we try and map out how we see the economy and markets changing in the short term As well as some longer term issues we have spoken about in the past that continue to concern us And finally looking at some specific investment investors should avoid in what we view as a challenging investment environment
  2. Looking at markets last year, first the S&P 500 Returned nearly 22% last year, an exceptional result But perhaps even more extraordinary was the consistency or lack of volatility incurred to produce that return In 2017, the S&P 500 only suffered an intra day decline of more than 1% on four occasions., over the past 30 years, the market has typically endured a 1% correction every 7 or 8 trading sessions There wasn’t a single day in which the market fluctuated more than 2%, typically this happens about 10 times a year. At no point last year did the S&P 500 didn’t experience a negative return month Nor did it suffer a draw down of 5% or more. In fact , the last tine the S&P 500 experienced a 5% drawdown was June 2016, and went a record 404 days, until finally on Feb 2, 2018 fell over 5%. On average, the market suffers a 5% draw down every three months or so. The market continued lower and on Feb 8th had actually decline just over 10% signifying a market correction, but has been working higher. Still hasn’t hit its Jan 26 highs, however. Will it continue higher and melt up, like it did in January, or continue lower and enter a bear market by falling 20%. At the very least, market volatility looks to have returned
  3. Canadian stocks in 2017 did not fair as well. For 2017 just over 9%, but all of this occurred in the last 4 months of the year Up until September 8th, the market was basically flat. Canada, not as good a year. More volatile and less return. Composition of the Canadian market Financials – worry about housing market Energy – Western Canadian crude differentials Don’t have technology Didn’t have tax reform
  4. The Canadian economy was strong, however, as can be seen in the bond market The Strength of the Canadian economy last year can be seen in the bond market With Canadian short rates rising nearing 1% while longer term rates not as much. This flattening of the yield curve was also evident in the U.S., though short rates didn’t move up as much, only about 70 bps, while longer rates barely moved at all. Short rates heavily influenced by the central bank BOC & Fed tightening Longer term more influence by the market and inflation This is the conundrum, with the Fed raising, why was 10 year flat? Fed is starting to normalize interest rates as the economy appears to have finally found its footing But Inflation not moving recovering, at least not until just recently Early 2018, see inflation, entire curve move higher in US. What’s going on? Market is more volatile Yield curve moving higher, but still flat Recession, bear market Or buying opportunity?
  5. Before giving a forecast on where the markets and the economy are going, we think it fair, in full disclosure, to highlights some forecasting techniques used by the investment communities, tricks or the trade so to speak. The first is demonstrated by this Dilbert cartoon Which is make the forecast, which may or may not make sense, sound as complicated as possible so everyone thinks your smart and won’t question your forecast. Another fine technique is highlighted by the frustration shown in this this Harry Truman quote. Always hedge your forecast and provide at alternative outcomes. Don’t be be definative. And finally, a variant of this is demonstrated here: In the words Brian Fantana, The Anchorman – They have done studies you know, 60% of the time, it works every time. The Wall Street version of this is actually only 40% of the time Let me give you an example: Let’s say you have a non consensus view You want the credit if it turns out to be right, but don’t want to go out on a limb in case it’s wrong So you put a 40% probability on it. If it happens, you take the credit for being of the only people to get it right If it’ doesn’t happen, you can dismiss it as only having being a 40% probability We are likely to use some of these techniques tonight. .
  6. In fairness, however, forcasting is hard. There are many factors influencing the market and the economy, too many quite frankly to be able to confidently state firm predictions for definitive outcomes in the future. What we hope to do tonight is provide a framework or a path that we can follow, rather than hard dates and outcomes There are a number of different factors influencing the economy, which could take the market in a number of different directions Investors have to be prepared, understand the future turns in the economy and be ready to decide on the proper route to take. In order to do this, we thought we would map out the likely path for the markets, like a traditional road map. I brought this up with our team and described the idea of a roadmap, and they didn’t know what I was talking about. Gen-xers and a couple of Millenials, they have never seen or used a roadmap. They suggested what I was describing was in fact a GPS Here is an example It shows the route John and I took to get to Kelowna 4 hour drive, about 3.25 if John is driving, 40 minute flight. We flew So I went to our IT group and asked them the make us an investment GPS. And this is what they came up with……
  7. Start here, the route, and then the finish line, What it is actually is a chart of the business cycle Horizontal X axis is time, while Vertical Y axis is sustainable GDP growth, meaning the normal rate the economy can grow at without overheating and incurring inflation. According to the Federal Reserve, this is currently 1.8% As we work through the route, or business cycle, as the economy contracts below potential, the central banks starts to cut interest rates and inflation begins to recede. This is a good environment for Bonds, less so for stocks and corporate earnings. Given the stimulative monetary policy, the economy begins to bottom and slowly start to recover. Stocks tend to start to recover in this environment As growth picks up momentum and passes 1.8%, inflation begins to move higher again. Higher inflation causes the central bank to start raising interest rates. Higher earnings help stocks, but are partially offset by lower valuations. Bonds struggle Finally, higher rates cause the economy to roll over, hurting earnings, while inflation remains high. This is bad for stocks and bonds. So where are we on this route?
  8. The slide provides us a good indicator The grey shaded areas indicate recession The red line is the output gap, which is the amount the economy is growing below its potential Typically the output gap disappears one to two years before a recession, and as you can see here, the output gap has recently disappeared.
  9. This is important, because on our investment GPS, we know the maximum sustainable output for the economy is right here, at 1.8% Now there are not exact numbers. One or two years is a big spread, and determining the maximum sustainable output for the economy is more art than science, but are pretty comfortable saying we are somewhere in between here and here, which is good news. Because for a long time, we were literally parked down here. Interest rates were low, good for valuations But earnings growth was hard to find with very low economic growth The bad news with no longer being stalled, however, is we are now beginning to move along the business cycle , and thus we will start to move closer to the end. Inflation start to increase & interest rates rise Till finally the economy and the market starts to roll over. But, we don’t think we are there yet, but the odometer has started In the mean time, however, this area is actually a very good environment for stocks and other risk assets. Deflation is no longer a risk But interest rates are still low Earning growth is strong Not too hot such that the central bank has to raise interest rates too quickly But strong enough such that companies have some pricing power and strong earnings.
  10. Higher inflation and higher interest rates only become a problem later in the cycle As you see from this chart Stock valuations are highest when inflation is between 0 and 2%, which is roughly where we are. Even above 2%, but below 4% valuations are still strong. Same for interest rates, low and rising 10 year yields are actually positively correlated with higher valuations. Historically is only when rates are above 5% do valuations start to contract. Given the current environment, some believe this is perhaps lower now, maybe 3.5% Regardless, 10 year yields in the U.S. are still under 3% This all makes intuitive sense. Interest are moving higher for the right reasons, because economic growth is stronger, but monetary conditions are still stimulative. This is a good environment for investments But how do we know when we are reaching the end of the road, so to speak?
  11. There are a number of indicators that are useful in indicating when the cycle is nearing an end. Probably the best the yield curve. This chart show the spread between the 10 year treasury yield and the 2 year The highlighted areas indicate recession. When the line is falling, it means the yield curve is flattening. 2 year yields are increasing more than 10 year yields (or falling less. When the line falls below zero, the yield curve is actually inverted, meaning 2 year yields are higher than 10 year yields. As you can see, every time the we have a recession, it has been preceded by a recession. This makes sense because once the market concludes the increase in short rates is going to push the economy into recession, investors sell stocks and shift into lower risk 10 year bonds, anticipating lower interest rates in the future Currently, while the yield curve has been flattening, we are still not close to an inverted yield curve. This is a key indicator to watch, and one of the reasons the flattening last year was such a concern.
  12. But let’s take a step back What’s going to cause the central bank to tighten? Inflation And wage growth is the key ingrediant leading to sustainable inflation Again looking at this chart, the shaded area is recession, the key level for wage growth is 4%. Every recession over the past three decades has been preceded by wage growth spiking up to 4% But this cycle, wage growth remains well below 4% Wage growth is a key indicator to watch on your investment GPS
  13. Once the central bank starts to tighten, how do we know when it’s starting to impact companies and their ability to borrow, thus slowing economic grwoth? credit spread are a good indicator for this. Again in this chart, highlighted area is recession, you can see rising credit spreads has been a good warning signal. But so far, spreads have remained quite low. It’s true the Fed has been raising rates Since Dec 2015 – 6 times or 1.5% With 2 more expected in 2018 But monetary conditions are actually still quite easy
  14. Rates are still stimulative, but with the Fed raising rates and reducing the size of it’s balance sheet and reversing the impact of QE, they are slowly removing the punch bowl Bit as this cartoon show, Trump and the Republicans have arrive with a new punch bowl with tax cuts and fiscal policy With the Corporate tax rate falling from 35% to 21% earning will go up In addition an estimated $2.6 trillion held overseas will be taxed at between 8% to 15.5%, but can now be re-patriated and spent in the U.S.. And to help them spend it on capital investments, companies will be able to fully expense business investments for the next 5 years
  15. We can see the impact of this on our Investment GPS The 1.8% sustainable growth rate we highlighted is not a static number. It can move up or down, depending on the structure of the economy GDP growth is essentially population growth plus productivity growth While population growth isn’t expected to move up, productivity growth can is companies start to invest more, either due to tax reform, or just in response to higher eventual wages. If this were to happen, as you can see on our GPS, the red line would move up How much? McKinsey & Co thinks productivity could increase to about 2.0% Trump thinks growth could actually hit 4% If this happens, the whole GPS route shifts up such that there is now more upside to growth before more growth becomes inflationary And a longer time period before the end of the business cycle
  16. If tax reform and tax cuts might help extend the cycle, a trade war could do the opposite and prematurely drive the economy into recession As can be seen in this cartoon of Trump pulling the rug from beneath the rest of the world A recent BAC/Merrill Lynch survey recently highlighted a trade war as the greatest tail risk investors worry about in todays market Which appears vindicated based on recent actions. Trump’s strategy Use Tariffs as a negotiating tool China is the real target Trump would like to reduce the US trade deficit (by $100 billion) to appease his base, but the real target is not the low tech manufacturing industries of the past, but the future high value add industries In 2015 China created the Made in China 2025 program Which targets 10 key industries China wants to becomes world leaders in China’s unfair practices requiring US companies to JV & transfer IP and providing subsidies to SOE, especially in 10 priority industries Trump believes the WTO had been too soft on China Without tax reform or trade wars , many were thinking a year before the next recession More optimistically, maybe two years….or longer? Now? The key is to keep an eye on the indicators. Our GPS is pretty good on location, not so good on time
  17. But what happens when we reach the end of the business cycle? Well, the neighborhood changes considerably. As we have said, the current environment is quite nice. We know it pretty well. We have our GPS on, but it’s a pretty straight road without a lot of turns The next recession is a different matter. The neighborhood changes considerable, for the worse. And we don’t know this neighborhood, at all.
  18. What do I mean by this? They are a likely going to be a number of areas where central banks and investors are going to find themselves in unchartered territory First – Monetary policy Again shaded area are recessions During the past 7 recession the Federal Reserve has cuts rates an average of 500 basis points With Fed funds current at 1.5% to 1.75% and expected to peak at 3.0%, there is no room for the Fed to cut 500 basis points this cycle They haven’t allowed themselves enough dry powder to do this
  19. The other alternative of course would be to bring in the other punch bowl, namely fiscal policy, lower taxes and government spending like infrastructure. Like monetary policy, however, the US haven’t left themselves much dry powder After the recent tax cuts, the budget deficit is expect to rise to 5% of GDP during the Trump term, higher than any recent administration, and only slightly lower than during the Obama administration burden with the great recession The deficit has historically tracked the unemployment rate, so fiscal stimulus this late in the cycle is unusual, and doesn’t leave a lot of room to add more in the next recession
  20. For Canada, it’s consumer debt rather than government debt that is the problem In this chart produced by the BIS The upper right quadrant shows countries where debt is high, and growing. Here we see the US before the financial crisis, and where they are now While Canada has even higher debt, though growth has slowed Canada is not the only country at risk Switzerland – Currency Scandanavian counties And Asian Influenced Australia and S Korea Changes to mortgage rules and Vancouver and Toronto home taxes have helped stabalized, but high consumer debt will be an additional headwind for Canada in the next recession, and some of this consumer debt will likely become government debt if there is a housing crisis.
  21. So where does this leave us in the next recession? Without monetary or fiscal policy to come to the rescue, our GPS sees two possible routes: Deflation Which is basically the secular stagnation argument And to some degree, a continuation of what we went through after the financial crisis Low productivity Growth High debt and low interest rates hurt rather than help On the other hand Inflation might be the route the market takes But in combination with a recession, this would actually turn into stagflation This would likely be the case if the federal reserve gets behind the curve and lets the economy over heat, letting inflationary expectations take hold, before aggressively tightening Other factors that will play a role include: Demographics: An aging population reduces spending – supports secular stagnation But also increases wages given the higher dependency ratio Automation would likely be deflationary if it leads to job losses While globalization , or more likely a reduction in globalization, would increase inflation At the end of the day, governments will need to decide, which makes it hard to forecast The deflation is likely the consensus pick, but we think inflation is possible We would put a 40% probability on it.
  22. Now one of the features on most GPS systems is highlight landmarks on your route They can include useful points of interest like Gas stations But also some that are less so These are meant to lure you off your planned route Tonight, we want to highlight a few points of interest that are showing up on our investment GPS: Bitcoin Marijuana stocks And passive investing, or ETF’s
  23. Here can see the historical price of Bitcoin against other bubble asset, and indeed it appears to be following the same pattern In discussing the merits of Bitcoin and why is deserves the price appreciation most investors commonly talk about the merits of blockchain, which is the underlying technology platform behind bit coin and all crypto currencies We agree that blockchain is a promising technology, but you don’t need to own bitcoin for this Bitcoin is either a digital global currency or a store of value – Neither Too slow and expensive for transactions, and too volatile As for a store of value, limited to 21 million tokens, but an unlimited number of other cryto currencies The mining process to create new tokens is also insanley energy intensive Most people actually don’t really understand Bitcoin The real reason people buy it is because it has gone up in price The greater fools theory, buy in hopes of selling to someone else at a greater price I like the Charles Kindleberger quote Other than electricy costs, the near term risk is that it gets regualted Right now new cryptocurrencies are created through an ICO Which a cross between IPO and crowdsourcing Totally unregaluted MIT study $300 million are scams.
  24. Case in point, our favorite The Useless Etherium Token This is from their Website advertissing their ICO They honestly state that if your going to randomly give money away, their going to take it and buy big screen tv’s They say it’s not a scam, because they are telling you what they are going to do. Take you money and give you useless token in return Despite this they raised $276,00 Or as they say enough to buy 230 televisions. Appropriately , their logo is a hand showing you their middle finger You don’t need to be there. The best argument for buying Bitcoin I have heard is that it is a binominal outcome It will either go to zero, or a million – which is the FOMO argument I’m fine if my neighbor gets rich. I hope they do and use it to build a new house! Stick to your route
  25. Next point of interest is the marijuana sector As can be seen by this chart, it also looks like a bubble The industry barelly existed 3 years ago, and now has dozens of companies and $30 million market cap I the gold mining sector is only $60 billion What’s driving this market? Upcoming legislation to legalize the recreational use. First I the G7 Canada’s easy lisitng requirements Excess of zommie shell used in reverse takeovers makes canadian markets attractive In the US, illeagal Federally, can’t raise money Canopy is the largest company and a good example of the interest in the sector First pubically listed company Over a 100% 1 year return Nearly $7 billion market Cap Constellation Brands bought nearyy 10%
  26. Like Blockchain, this will be a real industry, but it has likely gotten a bit ahead of itself This table from a recent Barron’s article shows how most companies are making any mony, but trade at huge valuations based on future demand We get the demand story Constellation Brands estiamtes the US market at $50 billion Global market in 15 years at $200 billion To put this in perspective Wine $60, Tobacco $75 Canada - $5 – $9B selling at $10/gram It’s the supply story that would worry us 60 private and public companies 89 licenses 244 more in review Prices in Oregon/Colorado $0.50-$2.0 It’s a commodity with low barriers to entry and no sustainble adssvantage But a tomato company – because everyones growing pot
  27. Liquidty is likely behind the flow of capital of both Bitcoin and Marajuana When liquidity changes, both could suffer Perhaps not as extreme We also worry about the amount of money flowing into passive investments Passive investing is a very viable strategy with low fees, but As seen in this cartoon, we believe this currently provides an opportunity for active investors given the valuation distortions As can ben seen on the chart on the right According to strategas, There are now more indexes and benchmarks, which are the basis for passive investments, than stocks equity fund have been flat since 2002 And since the financial crisis have seen outflows of over $1 trillion ETF’s on the other hand, have grown from about 100 in 2003 to almost 7,000 today They have added $1.7 trillion since the financial crisis and now out number stocks
  28. When interest rates are zero, it’s is harder for active managers to outperform Even bad companies are able to survive in the environment As can be seen in this chart 33% of companies on the Russell 2000 currenty don’t make any money This is on par with levels typically seen in a recession, not when the economy is supposed to be strong At least some of these should have gone bankrupt As interest rates rise, the difference between a good and bad company will become more apparent Also liquidity will be harder on Passive ETF’s in a bear market Strategas – 90% of passive strategies are market cap weighted If investors sell, they are indiscriminatinglt selling This is particulary dangerous in fixed income where the underlying issues are not as liquid as the ETF that is being sold
  29. In order to avoid the concentration and liquidity risk of passive investing, Private Equity and Private Debt can be very effective strategies. They are perhaps the ultimate active investment This chart shows the performance between Private Equity and the publically traded S&P 500, but performance isn’t the only attraction We would in fact assume the lower liquidity in private asset alone would mean they should have higher returns over the long term Investors have to be comfortable with the longer time horizon The fact they are not market to market, however, can be an advantage in that they don’t exhibit the same price volatility Because most funds have to be held for upwards of a decade, investors are less at risk of trading on emotions And managers can make long term investments in companies and play a meaningful role in their management It is estimated PE currently has $1 million in dry powder There are no Private equity/debt benchmarks so passive strategies don’t exist As with any active strategy Manager selection is key Smaller size is better, avoid marge funds bidding up prices
  30. In conclusion We see open roads and sunny skies in the near term But going storm clouds on the horizon The next recession is at least 6 months away, maybe even a lot further We don’t know exactly when, but the odometer is not started to tick away given the tightening by the central banks Equities are still attractive in this environment Interest rates still stimulative and while valuations might not move higher, earning should continue to push stocks higher Capital investment and higher productivity could extend the cycle Bonds are more challenge in this environment The cycle will end, however, and watching the various indicators will help warn when the cycle is over and risk levels need to be lowered In fact we would not argue this starting the process sooner rather then later We expecially would avoid investment fads like Bitcoin and Marijuana stocks, which benefit from excess liquidity And would gravitate to actively managed strategies with less concentrated positioning and are less impacted from less liquid markets With that ……as for my Tom Tom GPS likes to say, We have reached our destination
  31. Red is best, followed by orange Yellow and green are basically not feasible Black dots signify cities of 1 million or more Very few of those cities line up with orange and red areas, outside of the southern U.S. All 4 Texas cities (and more specifically west Texas) have solid solar potential El Paso is in the red, the main 4 Texas cities are in the orange. However, some of the solar fields and Permian basin in West Texas fall within the red zone.
  32. Agenda: Look at what happen last year Oct 18, 1987 versus Oct 18, 2017 – big difference in activity Next, we try and map out how we see the economy and markets changing in the short term As well as some longer term issues we have spoken about in the past that continue to concern us And finally looking at some specific investment investors should avoid in what we view as a challenging investment environment