Download to read offline


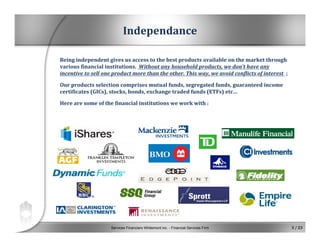


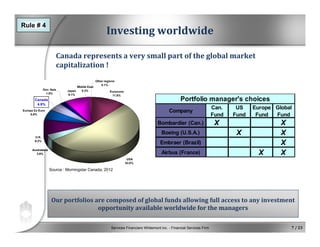
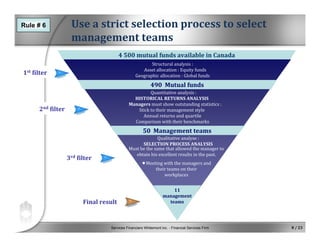
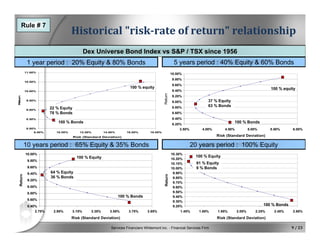
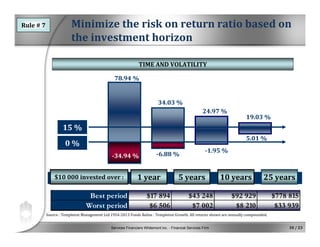
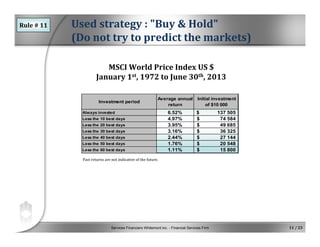
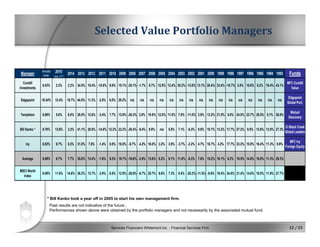
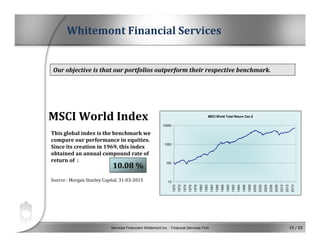


Whitemont Financial Services Inc. is an independent financial services firm founded by actuarial science graduates. It offers services including finance, insurance, investments, taxes, retirement, and legal aspects in collaboration with its partner Peak Financial Group, Quebec's largest independent broker. The firm's investment philosophy focuses on diversifying globally across equities and bonds using mutual funds with proven management teams. It aims to outperform benchmarks like the MSCI World Index by following principles such as buy-and-hold investing and minimizing risk for the investment horizon. The firm selects managers using strict quantitative and qualitative criteria and builds portfolios to meet clients' objectives.


![ASTEPTranscript[1]](https://cdn.slidesharecdn.com/ss_thumbnails/df654f5a-594d-4ad6-89d1-1af38699bc5d-150506131409-conversion-gate02-thumbnail.jpg?width=640&height=640&fit=bounds)


