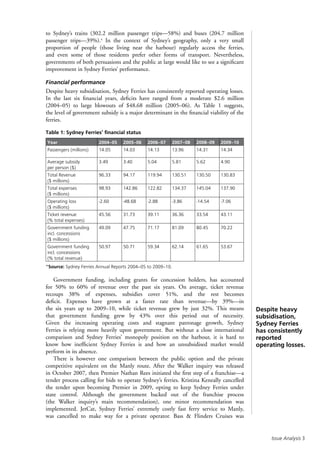
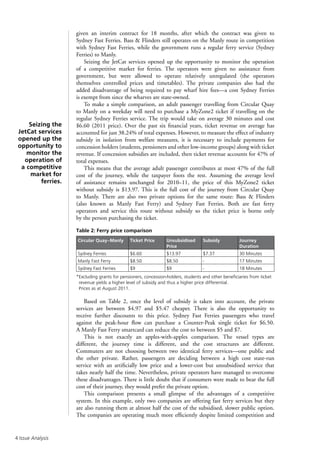
SlideShare a Scribd company logo
1 of 16
Download to read offline
Free-Trade Ferries: A Case for Competition
Alexander Philipatos
Alexander Philipatos is a Policy Analyst with the Economics Program at The Centre for
Independent Studies.
The author would like to thank Peter Saunders and three anonymous referees for
comments on an earlier draft. Any errors remain his own.
Executive Summary	 No. 127 • 27 October 2011
Sydney needs a network of ferries that is able to cater to the city’s changing demographics but
is also financially sustainable and responsible. The current state-controlled model has proved
inefficient, backward looking, and costly to taxpayers. Sydney Ferries made more passenger trips
in 2000–01 than in 2009–10, and has reported persistent deficits for the past six years despite
subsidies accounting for over 50% of revenue. A number of accidents in early 2007 prompted
a Special Commission of Inquiry (the Walker inquiry) into Sydney Ferries. The inquiry revealed a
host of problems and brought them to the forefront of the political debate. Four years later, there
is agreement on both sides of politics that the ferry system needs reform.
The NSW Coalition government’s franchise reform, with similarities to Brisbane’s model,
is a public-private partnership that attempts to address some of the problems outlined in the
Walker inquiry. However, the problems discussed in the inquiry are actually symptoms of deeper
structural problems. Monopoly and regulation are the root causes of the ferries’ woes and have
led to labour, managerial and financial problems. Since the franchise plans do not address the
underlying causes, the reforms will not generate lasting progress.
Instead, problems will persist because a franchise monopoly is in effect a halfway solution—an
attempt to involve the private sector but not allowing the forces of competition to operate.
Government control of fares and route structure will continue to increase costs and stifle
innovation. Subsidies, which have created long-term dependence, will continue to reward
inefficient business practices and produce a corporate entitlement culture.
Sydney would benefit significantly from a free and competitive market for ferries,
whereby anyone who wants to provide ferry services can do so with little impediment. Such an
environment will encourage entrepreneurs to respond to passengers’ needs, cut costs, and
importantly, run their business at their own expense instead of the taxpayers’. It is also a socially
responsible solution because it does not involve taxing the majority of Sydney’s population (many
of whom are lower-income groups) who use other transport modes such as buses and trains to
subsidise the small minority of commuters and tourists who travel on the ferries.
Understandably, after such a long period of government involvement, there is concern that
the ferry business could collapse if left to the market, but the evidence doesn’t justify the fear.
In fact, a small pocket of competition on Sydney’s Manly route suggests private companies can
provide better services at a lower cost.
This competitive environment could be extended to the rest of the ferry market by removing
existing barriers to entry. The government needs to do away with monopoly and reform the current
regulatory environment. The Passenger Transport Act 1990 needs to be amended to make the
ferry market competitive. Statutes need to allow for free entry and exit into the market, and
price controls and other restrictive obligations need to be abolished. Sydney Ferries can then be
wound up, its vessels sold off, and the labour force freed up for uptake by private firms.
Issue Analysis
Introduction
In May this year, Gladys Berejiklian, Transport Minister of NSW’s recently elected
Coalition government, announced that Sydney Ferries was to be franchised. This
was welcome news for those Sydneysiders who often travel on the ferries. Sydney
Ferries has been underperforming on several indicators over a long period of time.
The franchise plan was a response to recommendations made in a Special
Commission of Inquiry into Sydney Ferries led by Bret Walker (the Walker inquiry)
in 2007. The report uncovered many areas of poor performance that needed
significant improvement: financial performance, passenger growth, labour relations,
and fleet and route innovation, among others.
Financially, Sydney Ferries has profound problems. Expenses continue to grow
at a faster rate than ticket revenue, operating deficits are persistent, and reliance
on government subsidy is entrenched. In terms of labour, union relations are
complex and often strained. Management have not been able to extract much-
needed productivity gains from the workforce, and the continual growth of
employee benefits without matching efficiency gains is a considerable drain on
finances. Passenger growth has been lax since government took over the ferries
in 1951 and has declined over the past decade. Lastly, much of the fleet is old and
needs replacement, and the routes need to be restructured to reflect changing
community habits.
Unfortunately, the franchise plan focuses almost exclusively on passenger
growth. The deal to franchise Sydney Ferries essentially replaces the current
state-owned enterprise with a monopolistic public-private partnership.
The government will still own all vessels and control the routes, prices and
service obligations, but will contract a private company to operate the ferries and
manage the workforce. Based on these plans, the business environment is not
undergoing much change at all apart from new management. Taxpayers will not
see more for their dollar. Franchise experience in Melbourne and Brisbane has
been hailed as a success because it has significantly increased passenger numbers.
But the growth in passengers is mirrored by an increase in public funding, indicating
that the improvements in patronage are not necessarily coming from productivity
improvements as was intended. The NSW government should avoid this scenario.
To create a system where commuters get value for money, the business environment
must change to foster innovation and efficiency. Government needs to do away
with monopoly and regulation by relinquishing Sydney Ferries and allowing
firms to compete on a level playing field without assistance. Such an environment
will address several fundamental issues. First, it will align public transport
investment and service with consumer interests rather than political interests.
Second, it will allow the private sector the opportunity to significantly increase
patronage—an objective that state governments have been unable to fulfil for
60 years. Third, it establishes a business environment that puts downward pressure
on costs and prices. Fourth, it ends the subsidisation of ferry users (a small
proportion of total public transport) by non-ferry users—a subsidisation that sees
taxpayers from lower income regions finance the travel of commuters from some of
Sydney’s wealthiest areas.
Sydney Ferries’ performance
At present, Sydney Ferries operates roughly 175,000 services from the outer
boundaries of Sydney Harbour to the inner destinations on the Parramatta River.1
Twenty-eight vessels service 39 destinations from the outermost points of Manly
and Watsons Bay to the innermost parts of Parramatta.2
The network made
14.3 million passenger trips in 2009–10, but it is very much a minor part of
Sydney’s overall public transport system.3
Among the main public transport modes
(train, bus and ferry), it accounted for just below 3% of passenger trips compared
Government
needs to do
away with
monopoly and
regulation by
relinquishing
Sydney Ferries
and allowing
firms to
compete on a
level playing
field without
assistance.
Issue Analysis 
Despite heavy
subsidisation,
Sydney Ferries
has consistently
reported
operating losses.
to Sydney’s trains (302.2 million passenger trips—58%) and buses (204.7 million
passenger trips—39%).4
In the context of Sydney’s geography, only a very small
proportion of people (those living near the harbour) regularly access the ferries,
and even some of those residents prefer other forms of transport. Nevertheless,
governments of both persuasions and the public at large would like to see a significant
improvement in Sydney Ferries’ performance.
Financial performance
Despite heavy subsidisation, Sydney Ferries has consistently reported operating losses.
In the last six financial years, deficits have ranged from a moderate $2.6 million
(2004–05) to large blowouts of $48.68 million (2005–06). As Table 1 suggests,
the level of government subsidy is a major determinant in the financial viability of the
ferries.
Table 1: Sydney Ferries’ financial status
Year 2004–05 2005–06 2006–07 2007–08 2008–09 2009–10
Passengers (millions) 14.05 14.03 14.13 13.96 14.31 14.34
Average subsidy
per person ($)
3.49 3.40 5.04 5.81 5.62 4.90
Total Revenue
($ millions)
96.33 94.17 119.94 130.51 130.50 130.83
Total expenses
($ millions)
98.93 142.86 122.82 134.37 145.04 137.90
Operating loss
($ millions)
-2.60 -48.68 -2.88 -3.86 -14.54 -7.06
Ticket revenue
(% total expenses)
45.56 31.73 39.11 36.36 33.54 43.11
Government funding
incl. concessions
($ millions)
49.09 47.75 71.17 81.09 80.45 70.22
Government funding
incl. concessions
(% total revenue)
50.97 50.71 59.34 62.14 61.65 53.67
*Source: Sydney Ferries Annual Reports 2004–05 to 2009–10.
Government funding, including grants for concession holders, has accounted
for 50% to 60% of revenue over the past six years. On average, ticket revenue
recoups 38% of expenses, subsidies cover 51%, and the rest becomes
deficit. Expenses have grown at a faster rate than revenue—by 39%—in
the six years up to 2009–10, while ticket revenue grew by just 32%. This means
that government funding grew by 43% over this period out of necessity.
Given the increasing operating costs and stagnant patronage growth, Sydney
Ferries is relying more heavily upon government. But without a close international
comparison and Sydney Ferries’ monopoly position on the harbour, it is hard to
know how inefficient Sydney Ferries is and how an unsubsidised market would
perform in its absence.
There is however one comparison between the public option and the private
competitive equivalent on the Manly route. After the Walker inquiry was released
in October 2007, then Premier Nathan Rees initiated the first step of a franchise—a
tender process calling for bids to operate Sydney’s ferries. Kristina Keneally cancelled
the tender upon becoming Premier in 2009, opting to keep Sydney Ferries under
state control. Although the government backed out of the franchise process
(the Walker inquiry’s main recommendation), one minor recommendation was
implemented. JetCat, Sydney Ferries’ extremely costly fast ferry service to Manly,
was cancelled to make way for a private operator. Bass  Flinders Cruises was
Issue Analysis
given an interim contract for 18 months, after which the contract was given to
Sydney Fast Ferries. Bass  Flinders still operates on the Manly route in competition
with Sydney Fast Ferries, while the government runs a regular ferry service (Sydney
Ferries) to Manly.
Seizing the JetCat services opened up the opportunity to monitor the operation
of a competitive market for ferries. The operators were given no assistance from
government, but were allowed to operate relatively unregulated (the operators
themselves controlled prices and timetables). The private companies also had the
added disadvantage of being required to pay wharf hire fees—a cost Sydney Ferries
is exempt from since the wharves are state-owned.
To make a simple comparison, an adult passenger travelling from Circular Quay
to Manly on a weekday will need to purchase a MyZone2 ticket if travelling on the
regular Sydney Ferries service. The trip would take on average 30 minutes and cost
$6.60 (2011 price). Over the past six financial years, ticket revenue on average has
accounted for just 38.24% of total expenses. However, to measure the effect of industry
subsidy in isolation from welfare measures, it is necessary to include payments for
concession holders (students, pensioners and other low-income groups) along with ticket
revenue. If concession subsidies are included, then ticket revenue accounts for 47% of
total expenses.
This means that the average adult passenger contributes at most 47% of the full
cost of the journey, while the taxpayer foots the rest. Assuming the average level
of assistance remains unchanged for 2010–11, the price of this MyZone2 ticket
without subsidy is $13.97. This is the full cost of the journey from Circular Quay
to Manly. There are also two private options for the same route: Bass  Flinders
(also known as Manly Fast Ferry) and Sydney Fast Ferries. Both are fast ferry
operators and service this route without subsidy so the ticket price is borne only
by the person purchasing the ticket.
Table 2: Ferry price comparison
Circular Quay–Manly Ticket Price Unsubsidised
Price
Subsidy Journey
Duration
Sydney Ferries $6.60 $13.97 $7.37 30 Minutes
Manly Fast Ferry $8.50 $8.50 - 17 Minutes
Sydney Fast Ferries $9 $9 - 18 Minutes
*Excluding grants for pensioners, concession-holders, students and other beneficiaries from ticket
revenue yields a higher level of subsidy and thus a higher price differential.
Prices as at August 2011.
Based on Table 2, once the level of subsidy is taken into account, the private
services are between $4.97 and $5.47 cheaper. There is also the opportunity to
receive further discounts to this price. Sydney Fast Ferries passengers who travel
against the peak-hour flow can purchase a Counter-Peak single ticket for $6.50.
A Manly Fast Ferry smartcard can reduce the cost to between $5 and $7.
This is not exactly an apples-with-apples comparison. The vessel types are
different, the journey time is different, and the cost structures are different.
Commuters are not choosing between two identical ferry services—one public and
the other private. Rather, passengers are deciding between a high cost state-run
service with an artificially low price and a lower-cost but unsubsidised service that
takes nearly half the time. Nevertheless, private operators have managed to overcome
these disadvantages. There is little doubt that if consumers were made to bear the full
cost of their journey, they would prefer the private option.
This comparison presents a small glimpse of the advantages of a competitive
system. In this example, only two companies are offering fast ferry services but they
are also running them at almost half the cost of the subsidised, slower public option.
The companies are operating much more efficiently despite limited competition and
Seizing the
JetCat services
opened up the
opportunity to
monitor the
operation of
a competitive
market for
ferries.
Issue Analysis 
The principle
cause of Sydney
Ferries’ inflated
labour costs
is its complex,
and sometimes
strained, union
relations.
a narrow scope for benchmarking. Given these facts and the infancy of the market,
it is not unreasonable to expect further efficiency gains if this market were opened
to further competition.
Labour relations
Labour costs represent an important factor in Sydney Ferries’ cost problems. In 2007
the Walker inquiry stated:
Overall SFC’s performance has been less than satisfactory. It has consistently
spent more than it has earned or received, it has not achieved much by the
way of productivity gains from its workforce, it is beset by cultural problems
and it does not yet have in place all the management tools needed to efficiently
run its operations.5
The Walker inquiry, the Parry report (2003),6
and other reports by NSW’s
Independent Pricing and Regulatory Tribunal (IPART) note high and rising labour
costs.7
Employee benefits have risen in nominal terms by 44% in the six years
since 2004–05, growing at an average of 8% per year.8
Over the same period,
inflation has averaged approximately 3%, meaning ferry workers are enjoying real
income rises of almost 5% per year with little efficiency gains, rising fuel costs, and
persistent operating deficits.9
The table below presents a benchmarking comparison
taken in 2006 of the average wages for General Purpose Hands (also referred to as
deckhands) and Masters and Engineers of Sydney Ferries with those of comparable
private operators.
Table 3: Sydney Ferries vs private ferries salary comparison
Master/Engineer General Purpose Hand
Benchmark Salary $66,000 $36,750
Sydney Ferries $95,000 $68,224
Difference ($) $29,000 $31,474
Difference (%) 43.9% 85.6%
*Source: Grant Thornton, ‘Review of the Operating and Capital Expenditure of Sydney Ferries
Corporation’ (October 2006).
Wage differences between 40% and 85% are wasteful and explain some of the
difficulty management have in controlling costs. Unfortunately, additional wage
comparisons have not been conducted since the inquiry was completed, but the
continual growth in employee benefits suggests little change.
The principle cause of Sydney Ferries’ inflated labour costs is its complex, and
sometimes strained, union relations. Seven unions represent the workers of Sydney
Ferries.10
Three unions service the on-board staff (deckhands, masters, outer and
inner engineers); three represent the workers at the Balmain Shipyard; and one covers
the onshore officers. Before 2009, five different Enterprise Bargaining Agreements
(EBAs) serviced the workforce. In 2009, the Maritime Union of Australia (MUA)
and Australian Maritime Officers Union (AMOU) agreed on a common EBA.
Negotiating new agreements is time consuming, costly, and susceptible to dispute.
The Walker inquiry mentioned that the most recent wages and conditions
negotiation was prolonged and hampered by the complexity of union arrangements,
disputes, and industrial action. Each union was determined to ensure that
members of other unions did not achieve better conditions than their members.11
Industrial action was taken by one union, and two other disputes needed the
intervention of the Australian Industrial Relations Commission (AIRC) to be
resolved. The process took 18 months, and when negotiations were finalised, unions
had bargained considerable pay rises for the implementation of two efficiency
mechanisms—a performance review system and a new rostering system. The new
Issue Analysis
systems attempted to curb sick leave and reduce overtime generally, both of which
were being misused.
But at the time of the Walker inquiry, some 12 months after the negotiated
changes had been implemented, it was discovered that ‘vessels were not crew-based,
no roster had been agreed, hours of work and salaries had not been standardised
and a performance review management system had not been introduced.’12
At the
same time, pay increases were in effect and training and public holiday allowances
had been introduced. In other words, Sydney Ferries incurred all the costs of the
new agreement but received none of the benefits.
The agreement between the MUA and AMOU upon a common EBA marks
an important improvement, but labour relations at Sydney Ferries illustrate the
difficulties of operating in a monopolistic state-owned sector. Union power often
impedes attempts to increase efficiency and reduce costs, and management lack the
tools and the resolve to see through much needed improvements. The industry simply
lacks the competitive pressure needed to force accountability upon management
and the labour force.
Patronage levels
Sydney Ferries passenger levels peaked in the early 1930s at 30 million—a time
when Sydney’s ferry market was completely private, relatively unregulated,
and hosted many operators. The opening of the Harbour Bridge in 1932 had
a profound impact upon ferry passenger levels since the bridge presented a far
cheaper alternative for crossing the harbour. Within 20 years, passenger levels
dropped to 13 million. This was the catalyst for the government takeover of
Sydney Ferries Ltd. (the largest prominent ferry company of the time) in 1951
and has since been the main provider of ferry services on the harbour and the
Parramatta River. In the 60 years since the takeover, patronage levels have grown from
13 million to 14.3 million (10%), while train patronage has grown over 10% in just
the past six years.13
More generally, Sydney’s population grew from 1.61 million to
4.58 million (184.5% growth) over the same 60-year period.14
More recently, over the last decade, Sydney Ferries recorded a decline in
passenger numbers. By contrast Brisbane’s ferries, Sydney Ferries closest comparison,
have seen passenger levels rise 80% over the last decade. The following graph shows
growth in passengers from financial year 2000–01 to 2009–10 relative to 2000-01.
Figure 1: Patronage on Sydney and Brisbane Ferries (2000–01 to 2009–10)
Source: NSW Department of Transport, Sydney Ferries Patronage 2000–01 to 2009–10.
and Brisbane City Council, Brisbane Ferries Patronage 2000–01 to 2009–10.
The industry
simply lacks
the competitive
pressure needed
to force
accountability
upon management
and the
labour force.
Issue Analysis 
It is important to note that Brisbane’s ferry network is younger and its
consumer base is much smaller than Sydney’s. The network made 3.6 million
passenger trips in 2001–02, or just over one-third of the load that Sydney Ferries
serviced that year. This is not surprising since Brisbane’s population is much smaller
than Sydney’s and the size of Sydney Harbour allows more scope for ferry services than
Brisbane River. Ten years later, however, Brisbane’s network has grown to make almost
half the passenger trips as in Sydney.
Brisbane has seen larger population growth over the past decade than Sydney,
but it has not been instrumental in the growth of ferry patronage. Population growth
in inner Brisbane has averaged 4%, and up to 2% in inner southeast and inner
northwest Brisbane.15
Sydney’s inner and innerwest regions have seen smaller
growth at roughly 2%. These growth differences are rather small and since ferry
transport is still a minor player in terms of total public transport, differences of
2% cannot explain the large annual passenger growth rates. In addition, annual
population growth peaked before the expansion in passengers.16
The swell of
passengers came soon after the private partnership TransdevTSL began operating
the ferries in 2003.
Figure 2 tracks the comparative yearly performance of Sydney Ferries and
Brisbane’s ferry network. In all years except 2009–10, Brisbane’s ferries growth
record has outperformed Sydney.
Figure 2: Yearly patronage growth (2001–02 to 2009–10)
Source: NSW Department of Transport, Sydney Ferries Patronage 2001–02 to 2009–10 and
Brisbane City Council, Brisbane Ferries Patronage 2001–02 to 2009–10.
As mentioned earlier, the NSW government discontinued the Manly JetCat
service in 2008 and put a contract out to tender for a private company. Since the
fast ferry service was seen as a luxury service (consumers still had access to the
regular ferry to Manly), the government allowed any operator to service the route
without government assistance but importantly without control over prices.
Bass  Flinders won the tender and quickly filled the void. It was the sole fast
ferry for almost 18 months until the contract was given to Sydney Fast Ferries.
Ever since Sydney Fast Ferries began operating in April 2010 in competition with
Bass  Flinders, the market has seen strong passenger growth. Sydney Fast Ferries’
passenger trips have increased roughly 3.5 times in its first year of operation—from
10,555 in April 2010 (its opening month) to 46,635 in March 2011.16
In all years
except 2009–10,
Brisbane’s
ferries growth
record has
outperformed
Sydney.
Issue Analysis
Statistics from private ferry operators are sensitive and difficult to obtain;
however, according to management of both firms, the two operators combined
currently ferry roughly 4,000 fast passenger trips per day or 1.46 million annually.18
This
represents over 80% growth from the 802,000 passenger trips recorded in the JetCat's
last full operating year.
Reliability and customer satisfaction
Reliability and customer satisfaction have long been areas commonly referenced to
show growing passenger dissatisfaction at Sydney Ferries—from service punctuality
to disruptions from maintenance issues and customer complaints.
On punctuality, the Walker inquiry noted the NSW state plan’s targets for the
on-time running of the ferries. Although the target dictates that 99.5% of ferries
run on time, a ferry is deemed to be ‘on time’ if it arrives at its destination up to
five minutes after the scheduled arrival time.19
So while Sydney Ferries will report
on-time running rates of 98.4% in 2005–06 or 98% in 2006–-07, these statistics
are not particularly a good indicator of the actual on-time performance of the ferries.
Customer complaints are a more dependable source. The Tourism and Transport
Forum’s (TTF) 2008 report, Fixing Sydney’s Ferries, noted that customer complaints
had more than doubled in the three preceding financial years since 2005. In recent
years, customer complaints have reduced to below 2004–05 levels—a notable
improvement that brings Sydney Ferries’ complaints rate (complaints per million
passengers) closer to that of private operators.20
Figure 3: Customer complaints at Sydney Ferries (2004–05 to 2009–10)
Source: Sydney Ferries Annual Reports 2004–05 to 2009–10.
Equipment and innovation
The age and complexity of Sydney Ferries’ fleet continues to be a major financial and
operating constraint. There has been little investment in fleet replacement in recent
history, and maintenance costs are high since many vessels are past their useful life.
There has also been little innovation in route structure. All services still terminate
at Circular Quay, while other possible hubs such as King Street Wharf remain
underutilised. It is hard to know whether the existing route structure still serves the
needs of commuters.
Sydney Ferries operates six classes of vessels, but there are further differences
within each class of vessel, including design, displacement, propulsion plants, and
engine types. In 2007, the Walker inquiry revealed that there are in fact ‘12 distinct
classes of vessel from an operational perspective and 14 from and engineering
Reliability
and customer
satisfaction
have long been
areas commonly
referenced to
show growing
passenger
dissatisfaction at
Sydney Ferries.
Issue Analysis 
perspective.’21
The inquiry also noted that there were differences in the size and
type of wharves. This imposes a significant burden upon management in terms
of maintenance costs and service reliability. If a vessel breaks down, assuming there
is a replacement available, the vessel may not be able to dock at all and the crew on
hand may not be trained to operate that particular vessel.22
When the current franchise plans go ahead, little will change because the
government will still own all vessels and will still control the route structure. Therefore
all reinvestment remains the government’s responsibility. In order to institute
conditions most appropriate for ongoing improvement, the government should
sell the vessels to the highest bidder to get maximum value for taxpayers. So long as
the responsibility of fleet replacement is in the hands of the government, it will be
susceptible to the political process and budget pressures. In the hands of the private
sector, managing maintenance costs and fleet replacement become technical decisions
rather than political decisions. Route structure can also become more flexible and
adaptable to consumer behaviour if taken out of the regulatory framework.
Franchises
Experience from Melbourne
Franchise agreements in the past have usually boosted the consumer base or reduced
reliance on government subsidy. A successful franchise needs to do both. In mass
public transport, where the provision of services holds the added responsibility
of ‘public welfare,’ strong patronage is important. In the late 1990s, Jeff Kennett,
former Premier of Victoria, instituted a privatisation of sorts to the state’s train
and tram network. The plan, which holds some similarities with the franchise plan
proposed for Sydney Ferries, was marketed as a means to increase efficiency, boost
services, and decrease subsidy. A decade later, the Victorian project is widely recognised
as a success. The graph below shows the growth in passenger trips on Melbourne’s
metropolitan trains and trams over the past 10 years, during which time those
services have come from various franchisees. Patronage has grown roughly 70%
on trains and around 35% on trams.
Figure 4: Patronage on Melbourne’s trams and trains (2000–01 to 2009–10)
*Source: VIC Department of Transport: Track Record 44.†
The growth in Melbourne’s metropolitan train and tram network, as well as
Brisbane’s ferry system, speaks highly of the franchise model from this angle.
If governments want increased patronage regardless of cost, then this is a success.
When the
current franchise
plans go ahead,
little will change
because the
government
will still own all
vessels and will
still control the
route structure.
†
Patronage statistics do not include V/Line services.
10 Issue Analysis
But the intention behind Melbourne’s privatisation plan was reduce subsidies over
time and eventually abolish them so that the industry could stand unassisted.
In reality, this goal has been abandoned, and subsidy levels have increased. In fact,
the level of subsidy and the magnitude of growth in patronage are rather closely
related. In Figure 4, patronage growth on both trains and trams remains modest
from 2000–01 to 2003–04. The large growth comes after financial year 2003–04.
As can be seen in Figure 5, this is around the same time that government subsidies
to both modes doubled and contributed to strong growth.
Figure 5: Comparison of subsidy levels on Melbourne’s trains and trams
Source: VIC Department of Transport Public Transport, Track Record 8 to 43.††
It is not surprising that an increase in investment will generate greater use of
public transport, whether it is by running more frequent services, adding new
routes, or further subsidising prices. The experience in Victoria offers an important
question that is often ignored: by what measure should governments consider
a franchise successful?
If obtaining the desired patronage numbers simply means siphoning extra tax dollars
to a private company rather than a government department, little has been achieved.
State governments need to reduce or abolish subsidies at the same time as patronage
increases, otherwise the industry remains dependent.
Franchise defects
The failure of franchise plans to simultaneously increase services and reduce
(or eliminate) subsidies lies in the problems created by monopoly. In the absence of
the self-regulating abilities of a competitive market, regulatory frameworks create
new problems. They distort existing incentives and disincentives by imposing new
controls, new requirements, and new rewards. These regulations are required to
prevent the harmful effects that monopolies have on consumer welfare, but are
ultimately unable mimic market pressures because of asymmetric information.
The problematic forms of regulation include service contracts and price regulation.
Asymmetric information (service contracts)
Information asymmetry in franchises arises because the regulators seldom have the
same information and knowledge as the company they are regulating.
Under the proposed franchise plan for the ferries, the company that wins the
tender process will be employed under a service contract that stipulates the service
requirements. The details of a possible service contract have not been released;
††
Patronage statistics do not include V/Line services.
The failure of
franchise plans to
simultaneously
increase services
and reduce
(or eliminate)
subsidies lies in
the problems
created by
monopoly.
Issue Analysis 11
however, the seven-year ferry contract between Brisbane City Council and
TransdevTSL set out various performance indicators and minimum requirements,
including safety, reliability and patronage.23
Contracts like that of Brisbane’s
City Council include a base contract fee plus bonus payments for meeting certain
performance indicators. Not all performance indicators trigger incentive payments
if attained, and not all base requirements trigger contract termination if not
attained. Safety standards are typically important, and in the case of Brisbane City
Council, breach of safety requirements cancels any attained performance bonuses.
These requirements and performance indicators in the service contracts are designed
to improve performance and deter undesirable behaviour.
The difficulty is that if a target is easy to attain, whether it be for patronage
growth or service reliability, receiving a bonus payment for achieving the target
is a waste of tax dollars. There is also little incentive for the company to improve
performance past this target because it will signal to regulators that targets should be
made more difficult. Conversely, if the target is difficult to attain, then the company
is more worthy of a reward but will already have received one via increased fare
box revenue.
Hence incentive payments, although sometimes necessary, are almost always
wasteful. There is also a motivation for the franchisee to deliberately avoid surpassing
performance indicators to avoid raising expectations when targets are set for a new
contract. In addition, performance indicators pertaining to efficiency and cost
containment are rare. Success is measured by the attainment of objectives like
on-time running and safety rather than lowering labour and maintenance costs.
This is part of the reason why the increased patronage on Melbourne’s trams and
trains over the past decade has come with an increase in government funding, which
artificially reduces fare prices, rather than increased efficiency.
Price regulation
Under existing arrangements for Sydney Ferries, and under the proposed franchise
arrangement, IPART will set maximum fares under which the company must
operate. IPART’s decisions about maximum prices are made with regard to incentive
implications and performance, but also pay attention to cost pressures. Prices set
by IPART are an administrative price that is supposed to represent an unobservable
market price. For an administrative price to be representative of the market,
regular inquiry, modelling, and if possible, comparisons would be necessary.
In practice this is not exactly how it works. Current price is taken as given and Sydney
Ferries applies for price increases. IPART makes judgments about Sydney Ferries’
performance against current economic circumstances and decides how much
of a price increase (if any) will be awarded. The fundamental problem with
administrative prices is that the unobservable market price is just that—unobservable.
For an administrative price to even come close, a relevant market comparison
would be needed. Thus regulators have no sure-fire way of knowing whether the price
is too high or too low.
Ultimately, government has the virtually impossible task of coming up with
a combination of contract and regulatory framework that minimises (or eliminates)
subsidy while minimising costs. This is a mix that is difficult, if not unattainable,
because of the distortions and disincentives created by the regulations themselves.
Market Failure
Natural monopoly and public goods
Public provision and/or subsidisation of ferry services are generally argued on the
basis of market failure—that ferry services are public goods.
According to Joshua Gans, Stephen King, and N. Gregory Mankiw, public
goods must be both non-rival and non-excludable.24
This means people cannot
Incentive
payments,
although
sometimes
necessary, are
almost always
wasteful.
12 Issue Analysis
be prevented from using the good, and one person’s use of the good does not limit
another person’s use. Because of the free-rider problem that arises, public goods are
provided by government and financed through taxation.
It does not take much analysis of Sydney’s ferry market to see that according to
the economic definition, ferry services are not public goods like the defence
force, public parks, or traffic signage. Consumers cannot get a free ride on ferries.
Other arguments of market failure concern whether the structure of the market
favours a single firm—that the ferry market is a case of natural monopoly.
Paul Samuelson and William Nordhaus describe a natural monopoly as ‘an
industry in which the most efficient way of organising production is through a single
firm.’25
Joshua Gans, Stephen King and N. Gregory Mankiw explain that a natural
monopoly arises when there are large economies of scale over the relevant range
of output such that a single firm can provide a good or service at a lower cost per
unit than multiple firms.26
The obvious examples are services such as water and rail,
where competing firms would have to lay down their own rail tracks or water pipes.
These distribution networks are extremely expensive and thwart attempts from
competitors to enter the market and undercut the incumbent. They isolate the
incumbent from competitive threats and allow the monopoly to restrict output and
raise prices.
In the market for ferries, however, there are no distribution investments.
The largest fixed cost facing ferry providers are the vessels themselves. The three
JetCats that were sold off in 2007 were collectively valued at roughly $3.4 million
to $4 million approximating to $1.2 million per JetCat plus spare parts.27
Given
such high start-up costs, there is truth to the argument that the vessels constitute
a barrier to entry and would shield incumbent ferry operators from new entrants.
However, ferry services on Sydney Harbour were not provided by a single firm before
the 1950s when the market was unregulated. There were several larger companies
(Sydney Ferries Ltd. was the largest) but other smaller operators existed alongside.
In any case, this barrier can been circumvented rather easily by leasing vessels
rather than buying them outright. Brisbane City Council and some private operators
have gone down this route. Leasing not only reduces the need for large, long-
term capital investment but also provides ferry operators a means of lowering or
eliminating maintenance costs.
Strictly according to definition, there is no market failure in the way of public
goods (since there is no free-rider problem). The question of natural monopoly
is not as straightforward, although the option of leasing vessels makes the market
much more contestable.The current monopolistic environment is a result of government
intervention and restriction rather than market determination.
Solutions for Sydney Ferries: The deregulation option
International Experience with Deregulation
International experience is somewhat limited in the way of ferry deregulation.
More generally, liberalisation of maritime transport in Greece has brought vital
progress to the transport market and to the development of distant island regions.28
But Sydney’s ferry market does not compare closely to the Aegean, and other
ferry markets such as Hong Kong or Vancouver currently operate on franchise
arrangements. For experience in transport deregulation, airline and bus deregulation
are better documented.
Experience in airline deregulation in Australia suggests that the benefits have
included lower fares, increased patronage, increased competition and efficiency,
and improved service quality.29
The Bureau of Transport and Communications
Economics concluded that five years after deregulation, air fares decreased by
22% in real terms; domestic flight frequency increased by 63%; ‘revenue passenger
kilometres’ increased by 74.3%; and service quality improved by 58% (measured
The current
monopolistic
environment
is a result of
government
intervention and
restriction rather
than market
determination.
Issue Analysis 13
by flight frequency improvements). The bureau noted that although the number of
airlines did not change much after deregulation, 70% of the domestic market had
now become ‘price sensitive,’ meaning that deregulation had roused competitive
behaviour among firms. Air travel also became more popular as a result of
liberalisation—the propensity of Australians to travel by air rose by more
than 50%.30
The general success story of airline deregulation has been mirrored
internationally (in the United States, Canada and Europe).31
The experience in bus deregulation has been mixed. The results indicate that
in Britain, deregulation had been ‘neither as good as its proponents expected nor
as bad as its opponents feared.’32
C.A. Nash analysed Britain’s bus market
five years after deregulation and found that significant improvements in costs and
services came with increased fares and lower patronage. Real costs (per bus mile)
decreased by 30% and bus miles rose by 19.7%, but average real fares increased
by 8.3% and passenger trips declined by 7.1%.33
Andrew Evans’s findings were slightly different. Operating costs declined by roughly
20%, real fares changed little over the first two years, then rose slightly; services
(bus kilometres) increased by 24% in non-metropolitan counties and doubled in the
case-study towns; and patronage remained relatively unchanged after accounting for
other trends.34
The experience of deregulation illustrated that some expectations were
realised—namely reduced costs and subsidy, increased services, and more innovative
options.35
Authorities also expected patronage to rise and fares to fall—neither
of which eventuated. Some rise in fares could have been expected because in many
cases, local governments gave blanket subsidies to bus operators to hold down
prices.36
Once these subsidies are removed, it is only natural that commuters now
paying the full cost of the journey have to pay a higher fare, which may discourage
some passengers.
Competition on the Manly Route
There is limited competition on the Manly route because of an amendment to
the Passenger Transport Regulation 2007. The amendment allows ferry operators
running a Circular Quay to Manly route to operate without a service contract
if the trip can be made within 20 minutes.37
This provision was included to protect
Sydney Ferries’ monopoly on regular services to Manly but to allow private
companies to try their hand at the more up-market fast-ferry option. The provision
allowed Bass  Flinders to continue to compete alongside Sydney Fast Ferries
without a service contract, and has demonstrated how competitive forces have put
pressure on the two firms to reduce costs and provide affordable services. As the
earlier price comparison table suggests, Sydney Ferries’ regular Manly service would
have difficulty competing with private fast ferry alternatives if consumers were
required to pay the full cost of their journey.
The experience in Manly is significant because at the time, the JetCats were
the most costly service operated by Sydney Ferries. Operating cost per hour, per seat
for a JetCat was 85% more expensive than the average of all other vessels, and 33%
more expensive than the next most costly service (HarbourCat).38
Since the changes
have taken place, subsidies have been terminated but the route has become profitable.
The introduction of the private sector and competition has managed to increase
patronage while reducing costs at the same time despite the regular ferry service
operating side-by-side.
While it is difficult to gauge whether the success of this experiment means the
rest of the market would see the same results, the first stage of the current tender
process attracted considerable interest. Twenty-eight companies submitted their
registrations of interest in the franchise that ostensibly suggests significant profit
opportunities. It seems unpragmatic not to allow these 28 companies to compete on
Experience
in airline
deregulation
in Australia
suggests that the
benefits have
included lower
fares, increased
patronage,
increased
competition
and efficiency,
and improved
service quality.
14 Issue Analysis
existing routes or create new ones. The important lesson learned from airline and
bus deregulation is that the introduction of competitive forces put pressure on
operators to reduce costs, and this in turn saved taxpayers large sums in subsidies.
Proposal
To open up the ferry market to competition, government needs to do away with
monopoly and reform the regulatory environment:
I.	Do away with current service contract requirements and allow all private
ferry operators to operate at any available ferry wharf. Under the Passenger
Transport Act 1990, all commuter ferry services must hold a service contract.
Firms who attempt to operate without a contract are ‘guilty of an offense’
incurring up to 1,000 penalty points.39
This requirement is the means by
which government holds out competitive threats to Sydney Ferries and
perpetuates a stagnant and costly ferry network.
II.	Eliminate distortions by removing subsidies. Taxpayers subsidise Sydney
Ferries to the tune of 50%, and increasing the subsidy to allow Sydney
Ferries to compete with private operators establishes an unequal playing field.
An unsubsidised market would see new routes be trailed and old, underused
or unprofitable routes discarded. It is impossible to predict how many new
routes would be established or how many existing routes would be scrapped,
but operators would need to provide a service on a route that the public
demanded—and at a price they are willing to pay.
III.	Sell Sydney Ferries’ inefficient vessels. Buyers needn’t be a future ferry operator
on the harbour. The objective should be to obtain the highest possible price
for taxpayers.
IV.	Simpler, more convenient form of ticketing. Mass transit in Hong
Kong, London and other major cities benefits from integrated ticketing.
An integrated ticketing could not be carried out in a completely deregulated
environment, but governments do not need to set prices and mandate routes
and timetables for it to work. All that is needed is a simple permit system
that requires ferry operators to supply price and route information to a central
authority.
	Metlink (Victoria’s public transport marketing body) is one such example.
It provides information on timetables, maps and guides and administers
relevant signage for each mode of transport. A similar body could be used
to centralise all relevant pricing and timetable arrangements and provide
the information to the public. Operators could then install the relevant
technology onboard (such as the swipe cards used in London and Hong Kong)
to become part of the integrated network.
Emphasis should lie in eliminating barriers to entry and levelling the playing
field, which would leave entrepreneurs free to experiment with new types of vessels,
routes, technologies, ancillary services, and other innovations. The growth potential
locked out by the current restrictions could be large, and if freed up it could
fundamentally change the pattern of commuter travel on the harbour.
Objections to Deregulation
A deregulated ferry market would encourage outright competition on all profitable
routes, encouraging firms to increase services, cut costs, and lower prices. New
routes may arise while unprofitable routes would be scrapped. This environment also
means that cross-subsidisation would become difficult. Operators under pressure
to reduce fares on profitable routes would no longer be able to cross-subsidise
unprofitable routes with the excess profit. This may seem harsh for the small group
The growth
potential locked
out by the current
restrictions could
be large, and if
freed up it could
fundamentally
change the
pattern of
commuter travel
on the harbour.
Issue Analysis 15
of commuters who use these services, but there is little justification for keeping
them running when there are alternative modes of transport. All destinations
currently serviced by Sydney Ferries are also serviced by bus or train, or both.
Governments do have a responsibility to provide public transport services, but
doubling up on unprofitable services simply wastes taxpayers’ money. Governments
subsidise public transport for welfare purposes. Citizens with limited means and
who cannot afford a car or the cost of taxi services need an affordable travel option.
Buses and trains serve this purpose because they have extensive reach. Ferries on the
other hand are not a vital form of transport. They make up just 3% of passenger trips
and a significant proportion of passengers are tourists.
There are of course relatively inaccessible areas such as the harbour side suburbs
of Balmain, Drummoyne and Woolwich or the eastern suburbs of Watsons Bay and
Rose Bay. However, these areas are also serviced by bus, and if the public really
find value in ferry services to these locations, then it will be in the ferry operators’
interests to provide them. After all, many of these suburbs are among Sydney’s
most affluent and best placed to pay the full cost of their journey. Subsidising
the journeys of some of Sydney’s most well-to-do citizens is not a sensible use of
taxpayers’ funds.
If the government wishes to assist the small minority of ferry users on low incomes,
the current program for concession holders (pensioners, low-income earners and
students) can be maintained. There would be some subsidy but the government would
be supporting those in need without subsidising the well-to-do—and without altering
the incentives of a competitive environment.
Conclusion
There is little rationale for government intervention in ferry operations. Passenger
growth has been low since the network was taken over in 1951 and particularly poor
in recent history. Heavy regulation thwarts reinvestment and innovation, while
subsidies prolong dependency and drain the public purse. The NSW government’s
new franchise plan is being promoted as a significant change and the solution to the
ferries’ problems while in reality the subsidies, controls and incentive problems will all
remain. It is likely that governments will forget about containing subsidies amid the
desire to achieve large increases in patronage.
The solution that will restore financial responsibility to the ferries and increase
consumer choice cannot come from continued government intervention. Instead,
the government needs to introduce a competitive environment similar to the
successful Manly experiment. The ferry market must be a free market. A deregulated
competitive market for ferries will deliver services to areas where demand is highest, put
downward pressure on costs and prices, and stop the industry’s subsidy dependence.
With this system in place, the industry can begin to stand on its own feet and
utilise the entrepreneurial potential of the private sector.
Endnotes
1	 Sydney Ferries, ‘About Us.’
2	 As above.
3	 Sydney Ferries, ‘How we are Charting Performance Data.’
4	 State Transit Authority, Proactive Release of Performance Information (2004–05 to
2009–10); CityRail, ‘Our Performance.’
5	 Bret Walker SC, Report of the Special Commission of Inquiry into Sydney Ferries Corporation
(NSW Department of Transport, 2007), 1.
6	 Tom Parry, Final Report of the Ministerial Inquiry into Sustainable Transport
(Sydney: Department of Transport Services, 2003).
7	 For example, IPART, Report on the Determination of Fares for Sydney Ferries (2005)
and Review of Fares for Sydney Ferries in NSW (2007).
Subsidising the
journeys of some
of Sydney’s
most well-to-do
citizens is not a
sensible use of
taxpayers’ funds.
Issue Analysis (ISSN:1440 6306) is a regular series published by The Centre for Independent Studies, evaluating
public issues and Government policies and offering proposals for reform. Views expressed are those of the authors
and do not necessarily reflect the views of the Centre’s staff, advisors, directors or officers. Issue Analysis papers
(including back issues) can be purchased from CIS or can be downloaded free from www.cis.org.au.
The Centre for Independent Studies l PO Box 92, St Leonards, NSW 1590 Australia l p: +61 2 9438 4377 l f: +61 2 9439 7310 l cis@cis.org.au
8	 Sydney Ferries, Annual Reports (2004–05 to 2009–10).
9	 ABS (Australian Bureau of Statistics), Consumer Price Index, Australia, Cat. No. 6401.0 (Canberra: ABS,
June 2011), tables 1 and 2.
10	Bret Walker SC, Report of the Special Commission of Inquiry into Sydney Ferries Corporation, as above, 192.
11	As above, 207.
12	As above, 208.
13	CityRail, ‘Our Performance.’
14	ABS (Australian Bureau of Statistics), Regional Population Growth, Australia, ABS Cat. No. 3218.0
(Canberra: ABS, March 2011); ABS, Official Yearbook of NSW No. 53
1950-51 (1955).
15	ABS (Australian Bureau of Statistics), Regional Population Growth, Australia, ABS Cat. No. 3218.0
(Canberra: ABS, March 2011), Table 3.
16	As above, Table 1.
17	Department of Transport, ‘NSW Government to begin reform of Sydney Ferries’
(11 May 2011).
18	Phone conversations with management of Sydney Fast Ferries and Bass  Flinders.
19	Bret Walker SC, Report of the Special Commission of Inquiry into Sydney Ferries Corporation, as above, 63.
20	Sydney Ferries, Annual Reports (2004–05 to 2009–10).
21	Bret Walker SC, Report of the Special Commission of Inquiry into Sydney Ferries Corporation, as above, 48.
22	As above, 48.
23	Personal correspondence with Brisbane City Council.
24	Joshua Gans, Stephen King, and N. Gregory Mankiw, Principles of Microeconomics (Sydney: Harcourt
Brace  Company, 1999), 216.
25	Paul A. Samualson and William D. Nordhaus, Principles of Economics (13th edition) (New York:
McGraw-Hill, 1989), 588.
26	Joshua Gans, et al., Principles of Microeconomics, as above, 302.
27	Rhys Haynes, ‘Taxpayers lose over $3 million after Sydney Ferries botches tender process for Manly
JetCats,’ The Daily Telegraph (10 December 2009).
28	C.I. Chlomoudis, P.L. Pallis, Stratos Papadimitriou, and E.S. Tzannatos,
‘The Liberalisation of Maritime Transport and the Island Regions in EU. Evidence
from Greece,’ European Transport 37 (2007), 1.
29	BTCE (Bureau of Transport and Communications Economics), Information Sheet 6: Deregulation of
Domestic Aviation in Australia 1990–1995, 1.
30	As above, 3.
31	Steven Morrison and Clifford Winston, ‘Airline Deregulation and Public Policy,’ Science 245:4919
(August 1989), 707–711; Edward Iacobucci, Michael Trebilcock, and Ralph A.
Winter, ‘The Canadian Experience with Deregulation,’ The University of Toronto Law Journal 56:1
(Winter, 2006), 51.
32	C.A. Nash, ‘British Bus Deregulation,’ The Economic Journal 103:419 (July 1993), 1042.
33	As above, 1046.
34	Andrew Evans, ‘Are Urban Bus Services Natural Monopolies?’ Paper presented to the Fifteenth
Australasian Transport Research Forum (Sydney: 1990), 253–256.
35	J. Enrique Fernandez and Juan Carlos Muñoz, ‘Privatisation and Deregulation of Urban Bus Services:
An Analysis of Fare evolution Mechanisms,’ Journal of Transport Economics and Policy 41:1 (January
2007), 25–49.
36	C.A. Nash, ‘British Bus Deregulation,’ as above, 1046.
37	NSW Passenger Transport Regulation 2007, clause 216A.
38	Bret Walker SC, Report of the Special Commission of Inquiry into Sydney Ferries Corporation, as above, 315.
39	NSW Passenger Transport Act 1990, clause 16.

More Related Content

What's hot

Peak Car ownership - Urban Mobility Summit Dec 2016
Peak Car ownership - Urban Mobility Summit Dec 2016Peak Car ownership - Urban Mobility Summit Dec 2016
Peak Car ownership - Urban Mobility Summit Dec 2016FabMob
 
Meeting Australia's 2025 Land Transport Challenges
Meeting Australia's 2025 Land Transport ChallengesMeeting Australia's 2025 Land Transport Challenges
Meeting Australia's 2025 Land Transport ChallengesScott Martin, CMILT
 
Public Transport System (Philippines) Post covid19
Public Transport System (Philippines) Post covid19Public Transport System (Philippines) Post covid19
Public Transport System (Philippines) Post covid19Rene Santiago
 
Implications of moving towards public transport based cities
Implications of moving towards public transport based citiesImplications of moving towards public transport based cities
Implications of moving towards public transport based citiesTristan Wiggill
 
Place-based Transport Decarbonisation webinar (2 of 2) combined slides
Place-based Transport Decarbonisation webinar (2 of 2) combined slidesPlace-based Transport Decarbonisation webinar (2 of 2) combined slides
Place-based Transport Decarbonisation webinar (2 of 2) combined slidesDecarboN8
 
6.14 Web Version
6.14 Web Version6.14 Web Version
6.14 Web Versiontransalt
 
COTA NextGen-Executive Summary
COTA NextGen-Executive SummaryCOTA NextGen-Executive Summary
COTA NextGen-Executive SummaryCOTA BUS
 
The role of SPV in Transportation Sector
The role of SPV in Transportation SectorThe role of SPV in Transportation Sector
The role of SPV in Transportation SectorJaspal Singh
 
Urban Transportation Market In India
Urban Transportation Market In IndiaUrban Transportation Market In India
Urban Transportation Market In IndiaJaspal Singh
 
Mayors-Council-Vision-Document-Mar-2015
Mayors-Council-Vision-Document-Mar-2015Mayors-Council-Vision-Document-Mar-2015
Mayors-Council-Vision-Document-Mar-2015Tamim Raad
 
Increasing Capacity on Existing Infrastructure in Delhi
Increasing Capacity on Existing Infrastructure in DelhiIncreasing Capacity on Existing Infrastructure in Delhi
Increasing Capacity on Existing Infrastructure in DelhiJaspal Singh
 
Hsh presentation-booklet-05 jan2019-slr-3-28p
Hsh presentation-booklet-05 jan2019-slr-3-28pHsh presentation-booklet-05 jan2019-slr-3-28p
Hsh presentation-booklet-05 jan2019-slr-3-28pJustin Sutton
 
Place Based Decarbonisation Webinar (1 of 2)
Place Based Decarbonisation Webinar (1 of 2)Place Based Decarbonisation Webinar (1 of 2)
Place Based Decarbonisation Webinar (1 of 2)DecarboN8
 
HSH Detroit, Ann Arbor and Lansing Elevated Rail System
HSH Detroit, Ann Arbor and Lansing Elevated Rail SystemHSH Detroit, Ann Arbor and Lansing Elevated Rail System
HSH Detroit, Ann Arbor and Lansing Elevated Rail SystemJustin Sutton
 
Peter Newman - Zero Carbon Transport
Peter Newman - Zero Carbon TransportPeter Newman - Zero Carbon Transport
Peter Newman - Zero Carbon TransportBeyond Zero Emissions
 
HSH Ireland 235km Dublin to Shannon 13 April 2021-lr
HSH Ireland 235km Dublin to Shannon 13 April 2021-lrHSH Ireland 235km Dublin to Shannon 13 April 2021-lr
HSH Ireland 235km Dublin to Shannon 13 April 2021-lrJustin Sutton
 
Ppp final project
Ppp final projectPpp final project
Ppp final projectAbinJohnson
 

What's hot (19)

Peak Car ownership - Urban Mobility Summit Dec 2016
Peak Car ownership - Urban Mobility Summit Dec 2016Peak Car ownership - Urban Mobility Summit Dec 2016
Peak Car ownership - Urban Mobility Summit Dec 2016
 
Meeting Australia's 2025 Land Transport Challenges
Meeting Australia's 2025 Land Transport ChallengesMeeting Australia's 2025 Land Transport Challenges
Meeting Australia's 2025 Land Transport Challenges
 
Public Transport System (Philippines) Post covid19
Public Transport System (Philippines) Post covid19Public Transport System (Philippines) Post covid19
Public Transport System (Philippines) Post covid19
 
Implications of moving towards public transport based cities
Implications of moving towards public transport based citiesImplications of moving towards public transport based cities
Implications of moving towards public transport based cities
 
Place-based Transport Decarbonisation webinar (2 of 2) combined slides
Place-based Transport Decarbonisation webinar (2 of 2) combined slidesPlace-based Transport Decarbonisation webinar (2 of 2) combined slides
Place-based Transport Decarbonisation webinar (2 of 2) combined slides
 
6.14 Web Version
6.14 Web Version6.14 Web Version
6.14 Web Version
 
COTA NextGen-Executive Summary
COTA NextGen-Executive SummaryCOTA NextGen-Executive Summary
COTA NextGen-Executive Summary
 
BRTC Presentation
BRTC PresentationBRTC Presentation
BRTC Presentation
 
The role of SPV in Transportation Sector
The role of SPV in Transportation SectorThe role of SPV in Transportation Sector
The role of SPV in Transportation Sector
 
Urban Transportation Market In India
Urban Transportation Market In IndiaUrban Transportation Market In India
Urban Transportation Market In India
 
Mayors-Council-Vision-Document-Mar-2015
Mayors-Council-Vision-Document-Mar-2015Mayors-Council-Vision-Document-Mar-2015
Mayors-Council-Vision-Document-Mar-2015
 
Increasing Capacity on Existing Infrastructure in Delhi
Increasing Capacity on Existing Infrastructure in DelhiIncreasing Capacity on Existing Infrastructure in Delhi
Increasing Capacity on Existing Infrastructure in Delhi
 
Hsh presentation-booklet-05 jan2019-slr-3-28p
Hsh presentation-booklet-05 jan2019-slr-3-28pHsh presentation-booklet-05 jan2019-slr-3-28p
Hsh presentation-booklet-05 jan2019-slr-3-28p
 
Place Based Decarbonisation Webinar (1 of 2)
Place Based Decarbonisation Webinar (1 of 2)Place Based Decarbonisation Webinar (1 of 2)
Place Based Decarbonisation Webinar (1 of 2)
 
HSH Detroit, Ann Arbor and Lansing Elevated Rail System
HSH Detroit, Ann Arbor and Lansing Elevated Rail SystemHSH Detroit, Ann Arbor and Lansing Elevated Rail System
HSH Detroit, Ann Arbor and Lansing Elevated Rail System
 
Peter Newman - Zero Carbon Transport
Peter Newman - Zero Carbon TransportPeter Newman - Zero Carbon Transport
Peter Newman - Zero Carbon Transport
 
HS2 - A Bad Deal For Britain
HS2 - A Bad Deal For BritainHS2 - A Bad Deal For Britain
HS2 - A Bad Deal For Britain
 
HSH Ireland 235km Dublin to Shannon 13 April 2021-lr
HSH Ireland 235km Dublin to Shannon 13 April 2021-lrHSH Ireland 235km Dublin to Shannon 13 April 2021-lr
HSH Ireland 235km Dublin to Shannon 13 April 2021-lr
 
Ppp final project
Ppp final projectPpp final project
Ppp final project
 

Viewers also liked

Slideshare. силуети
Slideshare. силуетиSlideshare. силуети
Slideshare. силуетиEfrea
 
урок математики
урок математикиурок математики
урок математикиLugovaya Maria
 
NA Developer Day - Your first steps with Visual COBOL
NA Developer Day - Your first steps with Visual COBOLNA Developer Day - Your first steps with Visual COBOL
NA Developer Day - Your first steps with Visual COBOLMicro Focus
 
Детайлите при дамските дрехи - пролет-лято 2016
Детайлите при дамските дрехи - пролет-лято 2016Детайлите при дамските дрехи - пролет-лято 2016
Детайлите при дамските дрехи - пролет-лято 2016Efrea
 
B2B Information Product Samples
B2B Information Product SamplesB2B Information Product Samples
B2B Information Product SamplesSachin Amre
 
Practica 2 ficha de estudiante
Practica 2 ficha de estudiante Practica 2 ficha de estudiante
Practica 2 ficha de estudiante Paola Jimenez
 
01. MIDDLESEX MSC CERTIFICATE 08OCT01
01. MIDDLESEX MSC CERTIFICATE 08OCT0101. MIDDLESEX MSC CERTIFICATE 08OCT01
01. MIDDLESEX MSC CERTIFICATE 08OCT01Nizar Bahajjaj
 
Developer Conference 1.2 - Presenting Visual COBOL
Developer Conference 1.2 - Presenting Visual COBOLDeveloper Conference 1.2 - Presenting Visual COBOL
Developer Conference 1.2 - Presenting Visual COBOLMicro Focus
 
Introduction to jQuery
Introduction to jQueryIntroduction to jQuery
Introduction to jQueryAlek Davis
 
Журнал ЗЛОКАЧЕСТВЕННЫЕ ОПУХОЛИ - MALIGNANT TUMOURS № 2-2015 (13) Русскоязычно...
Журнал ЗЛОКАЧЕСТВЕННЫЕ ОПУХОЛИ - MALIGNANT TUMOURS № 2-2015 (13) Русскоязычно...Журнал ЗЛОКАЧЕСТВЕННЫЕ ОПУХОЛИ - MALIGNANT TUMOURS № 2-2015 (13) Русскоязычно...
Журнал ЗЛОКАЧЕСТВЕННЫЕ ОПУХОЛИ - MALIGNANT TUMOURS № 2-2015 (13) Русскоязычно...oncoportal.net
 
Tugas Manpro Resume (13410100124)
Tugas Manpro Resume (13410100124)Tugas Manpro Resume (13410100124)
Tugas Manpro Resume (13410100124)Muhammad Firdaus
 
Mass spectrometry (1)
Mass spectrometry (1)Mass spectrometry (1)
Mass spectrometry (1)Mohsin Shad
 
Helping students develop their information literacy
Helping students develop their information literacyHelping students develop their information literacy
Helping students develop their information literacyChris Willmott
 
Teaching reading with technology
Teaching reading with technologyTeaching reading with technology
Teaching reading with technologymom2jajerjo
 
JWTs for CSRF and Microservices
JWTs for CSRF and MicroservicesJWTs for CSRF and Microservices
JWTs for CSRF and MicroservicesStormpath
 
Token Authentication in ASP.NET Core
Token Authentication in ASP.NET CoreToken Authentication in ASP.NET Core
Token Authentication in ASP.NET CoreStormpath
 
Beautiful REST+JSON APIs with Ion
Beautiful REST+JSON APIs with IonBeautiful REST+JSON APIs with Ion
Beautiful REST+JSON APIs with IonStormpath
 
CONTOH REPORT LATIHAN INDUSTRI 2016 POLITEKNIK DAT
CONTOH REPORT LATIHAN INDUSTRI 2016 POLITEKNIK DATCONTOH REPORT LATIHAN INDUSTRI 2016 POLITEKNIK DAT
CONTOH REPORT LATIHAN INDUSTRI 2016 POLITEKNIK DATummu_aiman95
 

Viewers also liked (20)

Slideshare. силуети
Slideshare. силуетиSlideshare. силуети
Slideshare. силуети
 
Grupos de alimentos
Grupos de alimentosGrupos de alimentos
Grupos de alimentos
 
урок математики
урок математикиурок математики
урок математики
 
NA Developer Day - Your first steps with Visual COBOL
NA Developer Day - Your first steps with Visual COBOLNA Developer Day - Your first steps with Visual COBOL
NA Developer Day - Your first steps with Visual COBOL
 
Детайлите при дамските дрехи - пролет-лято 2016
Детайлите при дамските дрехи - пролет-лято 2016Детайлите при дамските дрехи - пролет-лято 2016
Детайлите при дамските дрехи - пролет-лято 2016
 
B2B Information Product Samples
B2B Information Product SamplesB2B Information Product Samples
B2B Information Product Samples
 
Practica 2 ficha de estudiante
Practica 2 ficha de estudiante Practica 2 ficha de estudiante
Practica 2 ficha de estudiante
 
CAM-CMS Presentation May 2016
CAM-CMS Presentation May 2016CAM-CMS Presentation May 2016
CAM-CMS Presentation May 2016
 
01. MIDDLESEX MSC CERTIFICATE 08OCT01
01. MIDDLESEX MSC CERTIFICATE 08OCT0101. MIDDLESEX MSC CERTIFICATE 08OCT01
01. MIDDLESEX MSC CERTIFICATE 08OCT01
 
Developer Conference 1.2 - Presenting Visual COBOL
Developer Conference 1.2 - Presenting Visual COBOLDeveloper Conference 1.2 - Presenting Visual COBOL
Developer Conference 1.2 - Presenting Visual COBOL
 
Introduction to jQuery
Introduction to jQueryIntroduction to jQuery
Introduction to jQuery
 
Журнал ЗЛОКАЧЕСТВЕННЫЕ ОПУХОЛИ - MALIGNANT TUMOURS № 2-2015 (13) Русскоязычно...
Журнал ЗЛОКАЧЕСТВЕННЫЕ ОПУХОЛИ - MALIGNANT TUMOURS № 2-2015 (13) Русскоязычно...Журнал ЗЛОКАЧЕСТВЕННЫЕ ОПУХОЛИ - MALIGNANT TUMOURS № 2-2015 (13) Русскоязычно...
Журнал ЗЛОКАЧЕСТВЕННЫЕ ОПУХОЛИ - MALIGNANT TUMOURS № 2-2015 (13) Русскоязычно...
 
Tugas Manpro Resume (13410100124)
Tugas Manpro Resume (13410100124)Tugas Manpro Resume (13410100124)
Tugas Manpro Resume (13410100124)
 
Mass spectrometry (1)
Mass spectrometry (1)Mass spectrometry (1)
Mass spectrometry (1)
 
Helping students develop their information literacy
Helping students develop their information literacyHelping students develop their information literacy
Helping students develop their information literacy
 
Teaching reading with technology
Teaching reading with technologyTeaching reading with technology
Teaching reading with technology
 
JWTs for CSRF and Microservices
JWTs for CSRF and MicroservicesJWTs for CSRF and Microservices
JWTs for CSRF and Microservices
 
Token Authentication in ASP.NET Core
Token Authentication in ASP.NET CoreToken Authentication in ASP.NET Core
Token Authentication in ASP.NET Core
 
Beautiful REST+JSON APIs with Ion
Beautiful REST+JSON APIs with IonBeautiful REST+JSON APIs with Ion
Beautiful REST+JSON APIs with Ion
 
CONTOH REPORT LATIHAN INDUSTRI 2016 POLITEKNIK DAT
CONTOH REPORT LATIHAN INDUSTRI 2016 POLITEKNIK DATCONTOH REPORT LATIHAN INDUSTRI 2016 POLITEKNIK DAT
CONTOH REPORT LATIHAN INDUSTRI 2016 POLITEKNIK DAT
 

Similar to ia127

National Rail Budget Analysis
National Rail Budget AnalysisNational Rail Budget Analysis
National Rail Budget AnalysisKaren Oliver
 
Verde Valley SkyTram
Verde Valley SkyTramVerde Valley SkyTram
Verde Valley SkyTramJerry Wicks
 
UK rail franchising - why did the West Coast franchising process collapse?
UK rail franchising - why did the West Coast franchising process collapse?UK rail franchising - why did the West Coast franchising process collapse?
UK rail franchising - why did the West Coast franchising process collapse?Institute for Transport Studies (ITS)
 
MOTOR CARRIER REGULATION AND LAST MILE DELIVERY: HAVE WE COME FULL-CIRCLE WIT...
MOTOR CARRIER REGULATION AND LAST MILE DELIVERY: HAVE WE COME FULL-CIRCLE WIT...MOTOR CARRIER REGULATION AND LAST MILE DELIVERY: HAVE WE COME FULL-CIRCLE WIT...
MOTOR CARRIER REGULATION AND LAST MILE DELIVERY: HAVE WE COME FULL-CIRCLE WIT...ijmvsc
 
Governance and economics of the taxi industry with special reference to sydne...
Governance and economics of the taxi industry with special reference to sydne...Governance and economics of the taxi industry with special reference to sydne...
Governance and economics of the taxi industry with special reference to sydne...temptingmoney
 
Wyndham Integrated Transport Strategy - Final Adopted Strategy - 2016-06-27 (...
Wyndham Integrated Transport Strategy - Final Adopted Strategy - 2016-06-27 (...Wyndham Integrated Transport Strategy - Final Adopted Strategy - 2016-06-27 (...
Wyndham Integrated Transport Strategy - Final Adopted Strategy - 2016-06-27 (...Kieran Nelson
 
Department of Transportation Fiscal Year 2012 Budget Highlights
Department of Transportation Fiscal Year 2012 Budget HighlightsDepartment of Transportation Fiscal Year 2012 Budget Highlights
Department of Transportation Fiscal Year 2012 Budget HighlightsPorts-To-Plains Blog
 
How transportation creates economic growth
How transportation creates economic growthHow transportation creates economic growth
How transportation creates economic growthMeenalosani Maran
 
Report to Darebin Council on freight in context of Victoria's freight strategy
Report to Darebin Council on freight in context of Victoria's freight strategyReport to Darebin Council on freight in context of Victoria's freight strategy
Report to Darebin Council on freight in context of Victoria's freight strategyWal Cichocki
 
Public Transportation And New Developments
Public Transportation And New DevelopmentsPublic Transportation And New Developments
Public Transportation And New DevelopmentsSandra Ahn
 
Road Pricing And The Reduction...Powerpoint
Road Pricing And The Reduction...PowerpointRoad Pricing And The Reduction...Powerpoint
Road Pricing And The Reduction...PowerpointHayford Adjavor
 
MUNICIPAL-BONDS_Dialogue-Series
MUNICIPAL-BONDS_Dialogue-SeriesMUNICIPAL-BONDS_Dialogue-Series
MUNICIPAL-BONDS_Dialogue-SeriesMarkus Krebsz
 
trucks sa research 10-11-05
trucks sa research 10-11-05trucks sa research 10-11-05
trucks sa research 10-11-05Ntila
 
Council Minutes 15 March 2010-Reports on freight
Council Minutes 15 March 2010-Reports on freightCouncil Minutes 15 March 2010-Reports on freight
Council Minutes 15 March 2010-Reports on freightWal Cichocki
 

Similar to ia127 (20)

National Rail Budget Analysis
National Rail Budget AnalysisNational Rail Budget Analysis
National Rail Budget Analysis
 
Verde Valley SkyTram
Verde Valley SkyTramVerde Valley SkyTram
Verde Valley SkyTram
 
The Box
The BoxThe Box
The Box
 
UK rail franchising - why did the West Coast franchising process collapse?
UK rail franchising - why did the West Coast franchising process collapse?UK rail franchising - why did the West Coast franchising process collapse?
UK rail franchising - why did the West Coast franchising process collapse?
 
MOTOR CARRIER REGULATION AND LAST MILE DELIVERY: HAVE WE COME FULL-CIRCLE WIT...
MOTOR CARRIER REGULATION AND LAST MILE DELIVERY: HAVE WE COME FULL-CIRCLE WIT...MOTOR CARRIER REGULATION AND LAST MILE DELIVERY: HAVE WE COME FULL-CIRCLE WIT...
MOTOR CARRIER REGULATION AND LAST MILE DELIVERY: HAVE WE COME FULL-CIRCLE WIT...
 
Governance and economics of the taxi industry with special reference to sydne...
Governance and economics of the taxi industry with special reference to sydne...Governance and economics of the taxi industry with special reference to sydne...
Governance and economics of the taxi industry with special reference to sydne...
 
Public and Private Sector Involvement in Freight Transport Management and Org...
Public and Private Sector Involvement in Freight Transport Management and Org...Public and Private Sector Involvement in Freight Transport Management and Org...
Public and Private Sector Involvement in Freight Transport Management and Org...
 
Wyndham Integrated Transport Strategy - Final Adopted Strategy - 2016-06-27 (...
Wyndham Integrated Transport Strategy - Final Adopted Strategy - 2016-06-27 (...Wyndham Integrated Transport Strategy - Final Adopted Strategy - 2016-06-27 (...
Wyndham Integrated Transport Strategy - Final Adopted Strategy - 2016-06-27 (...
 
Belmar Essay
Belmar EssayBelmar Essay
Belmar Essay
 
Ahmedabad.pptx
Ahmedabad.pptxAhmedabad.pptx
Ahmedabad.pptx
 
Department of Transportation Fiscal Year 2012 Budget Highlights
Department of Transportation Fiscal Year 2012 Budget HighlightsDepartment of Transportation Fiscal Year 2012 Budget Highlights
Department of Transportation Fiscal Year 2012 Budget Highlights
 
How transportation creates economic growth
How transportation creates economic growthHow transportation creates economic growth
How transportation creates economic growth
 
Report to Darebin Council on freight in context of Victoria's freight strategy
Report to Darebin Council on freight in context of Victoria's freight strategyReport to Darebin Council on freight in context of Victoria's freight strategy
Report to Darebin Council on freight in context of Victoria's freight strategy
 
Public Transportation And New Developments
Public Transportation And New DevelopmentsPublic Transportation And New Developments
Public Transportation And New Developments
 
Railway
RailwayRailway
Railway
 
Road Pricing And The Reduction...Powerpoint
Road Pricing And The Reduction...PowerpointRoad Pricing And The Reduction...Powerpoint
Road Pricing And The Reduction...Powerpoint
 
MUNICIPAL-BONDS_Dialogue-Series
MUNICIPAL-BONDS_Dialogue-SeriesMUNICIPAL-BONDS_Dialogue-Series
MUNICIPAL-BONDS_Dialogue-Series
 
trucks sa research 10-11-05
trucks sa research 10-11-05trucks sa research 10-11-05
trucks sa research 10-11-05
 
NSW Long Term Transport Masterplan - April 2012
NSW Long Term Transport Masterplan - April 2012NSW Long Term Transport Masterplan - April 2012
NSW Long Term Transport Masterplan - April 2012
 
Council Minutes 15 March 2010-Reports on freight
Council Minutes 15 March 2010-Reports on freightCouncil Minutes 15 March 2010-Reports on freight
Council Minutes 15 March 2010-Reports on freight
 

ia127

  • 1. Free-Trade Ferries: A Case for Competition Alexander Philipatos Alexander Philipatos is a Policy Analyst with the Economics Program at The Centre for Independent Studies. The author would like to thank Peter Saunders and three anonymous referees for comments on an earlier draft. Any errors remain his own. Executive Summary No. 127 • 27 October 2011 Sydney needs a network of ferries that is able to cater to the city’s changing demographics but is also financially sustainable and responsible. The current state-controlled model has proved inefficient, backward looking, and costly to taxpayers. Sydney Ferries made more passenger trips in 2000–01 than in 2009–10, and has reported persistent deficits for the past six years despite subsidies accounting for over 50% of revenue. A number of accidents in early 2007 prompted a Special Commission of Inquiry (the Walker inquiry) into Sydney Ferries. The inquiry revealed a host of problems and brought them to the forefront of the political debate. Four years later, there is agreement on both sides of politics that the ferry system needs reform. The NSW Coalition government’s franchise reform, with similarities to Brisbane’s model, is a public-private partnership that attempts to address some of the problems outlined in the Walker inquiry. However, the problems discussed in the inquiry are actually symptoms of deeper structural problems. Monopoly and regulation are the root causes of the ferries’ woes and have led to labour, managerial and financial problems. Since the franchise plans do not address the underlying causes, the reforms will not generate lasting progress. Instead, problems will persist because a franchise monopoly is in effect a halfway solution—an attempt to involve the private sector but not allowing the forces of competition to operate. Government control of fares and route structure will continue to increase costs and stifle innovation. Subsidies, which have created long-term dependence, will continue to reward inefficient business practices and produce a corporate entitlement culture. Sydney would benefit significantly from a free and competitive market for ferries, whereby anyone who wants to provide ferry services can do so with little impediment. Such an environment will encourage entrepreneurs to respond to passengers’ needs, cut costs, and importantly, run their business at their own expense instead of the taxpayers’. It is also a socially responsible solution because it does not involve taxing the majority of Sydney’s population (many of whom are lower-income groups) who use other transport modes such as buses and trains to subsidise the small minority of commuters and tourists who travel on the ferries. Understandably, after such a long period of government involvement, there is concern that the ferry business could collapse if left to the market, but the evidence doesn’t justify the fear. In fact, a small pocket of competition on Sydney’s Manly route suggests private companies can provide better services at a lower cost. This competitive environment could be extended to the rest of the ferry market by removing existing barriers to entry. The government needs to do away with monopoly and reform the current regulatory environment. The Passenger Transport Act 1990 needs to be amended to make the ferry market competitive. Statutes need to allow for free entry and exit into the market, and price controls and other restrictive obligations need to be abolished. Sydney Ferries can then be wound up, its vessels sold off, and the labour force freed up for uptake by private firms.
  • 2. Issue Analysis Introduction In May this year, Gladys Berejiklian, Transport Minister of NSW’s recently elected Coalition government, announced that Sydney Ferries was to be franchised. This was welcome news for those Sydneysiders who often travel on the ferries. Sydney Ferries has been underperforming on several indicators over a long period of time. The franchise plan was a response to recommendations made in a Special Commission of Inquiry into Sydney Ferries led by Bret Walker (the Walker inquiry) in 2007. The report uncovered many areas of poor performance that needed significant improvement: financial performance, passenger growth, labour relations, and fleet and route innovation, among others. Financially, Sydney Ferries has profound problems. Expenses continue to grow at a faster rate than ticket revenue, operating deficits are persistent, and reliance on government subsidy is entrenched. In terms of labour, union relations are complex and often strained. Management have not been able to extract much- needed productivity gains from the workforce, and the continual growth of employee benefits without matching efficiency gains is a considerable drain on finances. Passenger growth has been lax since government took over the ferries in 1951 and has declined over the past decade. Lastly, much of the fleet is old and needs replacement, and the routes need to be restructured to reflect changing community habits. Unfortunately, the franchise plan focuses almost exclusively on passenger growth. The deal to franchise Sydney Ferries essentially replaces the current state-owned enterprise with a monopolistic public-private partnership. The government will still own all vessels and control the routes, prices and service obligations, but will contract a private company to operate the ferries and manage the workforce. Based on these plans, the business environment is not undergoing much change at all apart from new management. Taxpayers will not see more for their dollar. Franchise experience in Melbourne and Brisbane has been hailed as a success because it has significantly increased passenger numbers. But the growth in passengers is mirrored by an increase in public funding, indicating that the improvements in patronage are not necessarily coming from productivity improvements as was intended. The NSW government should avoid this scenario. To create a system where commuters get value for money, the business environment must change to foster innovation and efficiency. Government needs to do away with monopoly and regulation by relinquishing Sydney Ferries and allowing firms to compete on a level playing field without assistance. Such an environment will address several fundamental issues. First, it will align public transport investment and service with consumer interests rather than political interests. Second, it will allow the private sector the opportunity to significantly increase patronage—an objective that state governments have been unable to fulfil for 60 years. Third, it establishes a business environment that puts downward pressure on costs and prices. Fourth, it ends the subsidisation of ferry users (a small proportion of total public transport) by non-ferry users—a subsidisation that sees taxpayers from lower income regions finance the travel of commuters from some of Sydney’s wealthiest areas. Sydney Ferries’ performance At present, Sydney Ferries operates roughly 175,000 services from the outer boundaries of Sydney Harbour to the inner destinations on the Parramatta River.1 Twenty-eight vessels service 39 destinations from the outermost points of Manly and Watsons Bay to the innermost parts of Parramatta.2 The network made 14.3 million passenger trips in 2009–10, but it is very much a minor part of Sydney’s overall public transport system.3 Among the main public transport modes (train, bus and ferry), it accounted for just below 3% of passenger trips compared Government needs to do away with monopoly and regulation by relinquishing Sydney Ferries and allowing firms to compete on a level playing field without assistance.
  • 3. Issue Analysis Despite heavy subsidisation, Sydney Ferries has consistently reported operating losses. to Sydney’s trains (302.2 million passenger trips—58%) and buses (204.7 million passenger trips—39%).4 In the context of Sydney’s geography, only a very small proportion of people (those living near the harbour) regularly access the ferries, and even some of those residents prefer other forms of transport. Nevertheless, governments of both persuasions and the public at large would like to see a significant improvement in Sydney Ferries’ performance. Financial performance Despite heavy subsidisation, Sydney Ferries has consistently reported operating losses. In the last six financial years, deficits have ranged from a moderate $2.6 million (2004–05) to large blowouts of $48.68 million (2005–06). As Table 1 suggests, the level of government subsidy is a major determinant in the financial viability of the ferries. Table 1: Sydney Ferries’ financial status Year 2004–05 2005–06 2006–07 2007–08 2008–09 2009–10 Passengers (millions) 14.05 14.03 14.13 13.96 14.31 14.34 Average subsidy per person ($) 3.49 3.40 5.04 5.81 5.62 4.90 Total Revenue ($ millions) 96.33 94.17 119.94 130.51 130.50 130.83 Total expenses ($ millions) 98.93 142.86 122.82 134.37 145.04 137.90 Operating loss ($ millions) -2.60 -48.68 -2.88 -3.86 -14.54 -7.06 Ticket revenue (% total expenses) 45.56 31.73 39.11 36.36 33.54 43.11 Government funding incl. concessions ($ millions) 49.09 47.75 71.17 81.09 80.45 70.22 Government funding incl. concessions (% total revenue) 50.97 50.71 59.34 62.14 61.65 53.67 *Source: Sydney Ferries Annual Reports 2004–05 to 2009–10. Government funding, including grants for concession holders, has accounted for 50% to 60% of revenue over the past six years. On average, ticket revenue recoups 38% of expenses, subsidies cover 51%, and the rest becomes deficit. Expenses have grown at a faster rate than revenue—by 39%—in the six years up to 2009–10, while ticket revenue grew by just 32%. This means that government funding grew by 43% over this period out of necessity. Given the increasing operating costs and stagnant patronage growth, Sydney Ferries is relying more heavily upon government. But without a close international comparison and Sydney Ferries’ monopoly position on the harbour, it is hard to know how inefficient Sydney Ferries is and how an unsubsidised market would perform in its absence. There is however one comparison between the public option and the private competitive equivalent on the Manly route. After the Walker inquiry was released in October 2007, then Premier Nathan Rees initiated the first step of a franchise—a tender process calling for bids to operate Sydney’s ferries. Kristina Keneally cancelled the tender upon becoming Premier in 2009, opting to keep Sydney Ferries under state control. Although the government backed out of the franchise process (the Walker inquiry’s main recommendation), one minor recommendation was implemented. JetCat, Sydney Ferries’ extremely costly fast ferry service to Manly, was cancelled to make way for a private operator. Bass Flinders Cruises was
  • 4. Issue Analysis given an interim contract for 18 months, after which the contract was given to Sydney Fast Ferries. Bass Flinders still operates on the Manly route in competition with Sydney Fast Ferries, while the government runs a regular ferry service (Sydney Ferries) to Manly. Seizing the JetCat services opened up the opportunity to monitor the operation of a competitive market for ferries. The operators were given no assistance from government, but were allowed to operate relatively unregulated (the operators themselves controlled prices and timetables). The private companies also had the added disadvantage of being required to pay wharf hire fees—a cost Sydney Ferries is exempt from since the wharves are state-owned. To make a simple comparison, an adult passenger travelling from Circular Quay to Manly on a weekday will need to purchase a MyZone2 ticket if travelling on the regular Sydney Ferries service. The trip would take on average 30 minutes and cost $6.60 (2011 price). Over the past six financial years, ticket revenue on average has accounted for just 38.24% of total expenses. However, to measure the effect of industry subsidy in isolation from welfare measures, it is necessary to include payments for concession holders (students, pensioners and other low-income groups) along with ticket revenue. If concession subsidies are included, then ticket revenue accounts for 47% of total expenses. This means that the average adult passenger contributes at most 47% of the full cost of the journey, while the taxpayer foots the rest. Assuming the average level of assistance remains unchanged for 2010–11, the price of this MyZone2 ticket without subsidy is $13.97. This is the full cost of the journey from Circular Quay to Manly. There are also two private options for the same route: Bass Flinders (also known as Manly Fast Ferry) and Sydney Fast Ferries. Both are fast ferry operators and service this route without subsidy so the ticket price is borne only by the person purchasing the ticket. Table 2: Ferry price comparison Circular Quay–Manly Ticket Price Unsubsidised Price Subsidy Journey Duration Sydney Ferries $6.60 $13.97 $7.37 30 Minutes Manly Fast Ferry $8.50 $8.50 - 17 Minutes Sydney Fast Ferries $9 $9 - 18 Minutes *Excluding grants for pensioners, concession-holders, students and other beneficiaries from ticket revenue yields a higher level of subsidy and thus a higher price differential. Prices as at August 2011. Based on Table 2, once the level of subsidy is taken into account, the private services are between $4.97 and $5.47 cheaper. There is also the opportunity to receive further discounts to this price. Sydney Fast Ferries passengers who travel against the peak-hour flow can purchase a Counter-Peak single ticket for $6.50. A Manly Fast Ferry smartcard can reduce the cost to between $5 and $7. This is not exactly an apples-with-apples comparison. The vessel types are different, the journey time is different, and the cost structures are different. Commuters are not choosing between two identical ferry services—one public and the other private. Rather, passengers are deciding between a high cost state-run service with an artificially low price and a lower-cost but unsubsidised service that takes nearly half the time. Nevertheless, private operators have managed to overcome these disadvantages. There is little doubt that if consumers were made to bear the full cost of their journey, they would prefer the private option. This comparison presents a small glimpse of the advantages of a competitive system. In this example, only two companies are offering fast ferry services but they are also running them at almost half the cost of the subsidised, slower public option. The companies are operating much more efficiently despite limited competition and Seizing the JetCat services opened up the opportunity to monitor the operation of a competitive market for ferries.
  • 5. Issue Analysis The principle cause of Sydney Ferries’ inflated labour costs is its complex, and sometimes strained, union relations. a narrow scope for benchmarking. Given these facts and the infancy of the market, it is not unreasonable to expect further efficiency gains if this market were opened to further competition. Labour relations Labour costs represent an important factor in Sydney Ferries’ cost problems. In 2007 the Walker inquiry stated: Overall SFC’s performance has been less than satisfactory. It has consistently spent more than it has earned or received, it has not achieved much by the way of productivity gains from its workforce, it is beset by cultural problems and it does not yet have in place all the management tools needed to efficiently run its operations.5 The Walker inquiry, the Parry report (2003),6 and other reports by NSW’s Independent Pricing and Regulatory Tribunal (IPART) note high and rising labour costs.7 Employee benefits have risen in nominal terms by 44% in the six years since 2004–05, growing at an average of 8% per year.8 Over the same period, inflation has averaged approximately 3%, meaning ferry workers are enjoying real income rises of almost 5% per year with little efficiency gains, rising fuel costs, and persistent operating deficits.9 The table below presents a benchmarking comparison taken in 2006 of the average wages for General Purpose Hands (also referred to as deckhands) and Masters and Engineers of Sydney Ferries with those of comparable private operators. Table 3: Sydney Ferries vs private ferries salary comparison Master/Engineer General Purpose Hand Benchmark Salary $66,000 $36,750 Sydney Ferries $95,000 $68,224 Difference ($) $29,000 $31,474 Difference (%) 43.9% 85.6% *Source: Grant Thornton, ‘Review of the Operating and Capital Expenditure of Sydney Ferries Corporation’ (October 2006). Wage differences between 40% and 85% are wasteful and explain some of the difficulty management have in controlling costs. Unfortunately, additional wage comparisons have not been conducted since the inquiry was completed, but the continual growth in employee benefits suggests little change. The principle cause of Sydney Ferries’ inflated labour costs is its complex, and sometimes strained, union relations. Seven unions represent the workers of Sydney Ferries.10 Three unions service the on-board staff (deckhands, masters, outer and inner engineers); three represent the workers at the Balmain Shipyard; and one covers the onshore officers. Before 2009, five different Enterprise Bargaining Agreements (EBAs) serviced the workforce. In 2009, the Maritime Union of Australia (MUA) and Australian Maritime Officers Union (AMOU) agreed on a common EBA. Negotiating new agreements is time consuming, costly, and susceptible to dispute. The Walker inquiry mentioned that the most recent wages and conditions negotiation was prolonged and hampered by the complexity of union arrangements, disputes, and industrial action. Each union was determined to ensure that members of other unions did not achieve better conditions than their members.11 Industrial action was taken by one union, and two other disputes needed the intervention of the Australian Industrial Relations Commission (AIRC) to be resolved. The process took 18 months, and when negotiations were finalised, unions had bargained considerable pay rises for the implementation of two efficiency mechanisms—a performance review system and a new rostering system. The new
  • 6. Issue Analysis systems attempted to curb sick leave and reduce overtime generally, both of which were being misused. But at the time of the Walker inquiry, some 12 months after the negotiated changes had been implemented, it was discovered that ‘vessels were not crew-based, no roster had been agreed, hours of work and salaries had not been standardised and a performance review management system had not been introduced.’12 At the same time, pay increases were in effect and training and public holiday allowances had been introduced. In other words, Sydney Ferries incurred all the costs of the new agreement but received none of the benefits. The agreement between the MUA and AMOU upon a common EBA marks an important improvement, but labour relations at Sydney Ferries illustrate the difficulties of operating in a monopolistic state-owned sector. Union power often impedes attempts to increase efficiency and reduce costs, and management lack the tools and the resolve to see through much needed improvements. The industry simply lacks the competitive pressure needed to force accountability upon management and the labour force. Patronage levels Sydney Ferries passenger levels peaked in the early 1930s at 30 million—a time when Sydney’s ferry market was completely private, relatively unregulated, and hosted many operators. The opening of the Harbour Bridge in 1932 had a profound impact upon ferry passenger levels since the bridge presented a far cheaper alternative for crossing the harbour. Within 20 years, passenger levels dropped to 13 million. This was the catalyst for the government takeover of Sydney Ferries Ltd. (the largest prominent ferry company of the time) in 1951 and has since been the main provider of ferry services on the harbour and the Parramatta River. In the 60 years since the takeover, patronage levels have grown from 13 million to 14.3 million (10%), while train patronage has grown over 10% in just the past six years.13 More generally, Sydney’s population grew from 1.61 million to 4.58 million (184.5% growth) over the same 60-year period.14 More recently, over the last decade, Sydney Ferries recorded a decline in passenger numbers. By contrast Brisbane’s ferries, Sydney Ferries closest comparison, have seen passenger levels rise 80% over the last decade. The following graph shows growth in passengers from financial year 2000–01 to 2009–10 relative to 2000-01. Figure 1: Patronage on Sydney and Brisbane Ferries (2000–01 to 2009–10) Source: NSW Department of Transport, Sydney Ferries Patronage 2000–01 to 2009–10. and Brisbane City Council, Brisbane Ferries Patronage 2000–01 to 2009–10. The industry simply lacks the competitive pressure needed to force accountability upon management and the labour force.
  • 7. Issue Analysis It is important to note that Brisbane’s ferry network is younger and its consumer base is much smaller than Sydney’s. The network made 3.6 million passenger trips in 2001–02, or just over one-third of the load that Sydney Ferries serviced that year. This is not surprising since Brisbane’s population is much smaller than Sydney’s and the size of Sydney Harbour allows more scope for ferry services than Brisbane River. Ten years later, however, Brisbane’s network has grown to make almost half the passenger trips as in Sydney. Brisbane has seen larger population growth over the past decade than Sydney, but it has not been instrumental in the growth of ferry patronage. Population growth in inner Brisbane has averaged 4%, and up to 2% in inner southeast and inner northwest Brisbane.15 Sydney’s inner and innerwest regions have seen smaller growth at roughly 2%. These growth differences are rather small and since ferry transport is still a minor player in terms of total public transport, differences of 2% cannot explain the large annual passenger growth rates. In addition, annual population growth peaked before the expansion in passengers.16 The swell of passengers came soon after the private partnership TransdevTSL began operating the ferries in 2003. Figure 2 tracks the comparative yearly performance of Sydney Ferries and Brisbane’s ferry network. In all years except 2009–10, Brisbane’s ferries growth record has outperformed Sydney. Figure 2: Yearly patronage growth (2001–02 to 2009–10) Source: NSW Department of Transport, Sydney Ferries Patronage 2001–02 to 2009–10 and Brisbane City Council, Brisbane Ferries Patronage 2001–02 to 2009–10. As mentioned earlier, the NSW government discontinued the Manly JetCat service in 2008 and put a contract out to tender for a private company. Since the fast ferry service was seen as a luxury service (consumers still had access to the regular ferry to Manly), the government allowed any operator to service the route without government assistance but importantly without control over prices. Bass Flinders won the tender and quickly filled the void. It was the sole fast ferry for almost 18 months until the contract was given to Sydney Fast Ferries. Ever since Sydney Fast Ferries began operating in April 2010 in competition with Bass Flinders, the market has seen strong passenger growth. Sydney Fast Ferries’ passenger trips have increased roughly 3.5 times in its first year of operation—from 10,555 in April 2010 (its opening month) to 46,635 in March 2011.16 In all years except 2009–10, Brisbane’s ferries growth record has outperformed Sydney.
  • 8. Issue Analysis Statistics from private ferry operators are sensitive and difficult to obtain; however, according to management of both firms, the two operators combined currently ferry roughly 4,000 fast passenger trips per day or 1.46 million annually.18 This represents over 80% growth from the 802,000 passenger trips recorded in the JetCat's last full operating year. Reliability and customer satisfaction Reliability and customer satisfaction have long been areas commonly referenced to show growing passenger dissatisfaction at Sydney Ferries—from service punctuality to disruptions from maintenance issues and customer complaints. On punctuality, the Walker inquiry noted the NSW state plan’s targets for the on-time running of the ferries. Although the target dictates that 99.5% of ferries run on time, a ferry is deemed to be ‘on time’ if it arrives at its destination up to five minutes after the scheduled arrival time.19 So while Sydney Ferries will report on-time running rates of 98.4% in 2005–06 or 98% in 2006–-07, these statistics are not particularly a good indicator of the actual on-time performance of the ferries. Customer complaints are a more dependable source. The Tourism and Transport Forum’s (TTF) 2008 report, Fixing Sydney’s Ferries, noted that customer complaints had more than doubled in the three preceding financial years since 2005. In recent years, customer complaints have reduced to below 2004–05 levels—a notable improvement that brings Sydney Ferries’ complaints rate (complaints per million passengers) closer to that of private operators.20 Figure 3: Customer complaints at Sydney Ferries (2004–05 to 2009–10) Source: Sydney Ferries Annual Reports 2004–05 to 2009–10. Equipment and innovation The age and complexity of Sydney Ferries’ fleet continues to be a major financial and operating constraint. There has been little investment in fleet replacement in recent history, and maintenance costs are high since many vessels are past their useful life. There has also been little innovation in route structure. All services still terminate at Circular Quay, while other possible hubs such as King Street Wharf remain underutilised. It is hard to know whether the existing route structure still serves the needs of commuters. Sydney Ferries operates six classes of vessels, but there are further differences within each class of vessel, including design, displacement, propulsion plants, and engine types. In 2007, the Walker inquiry revealed that there are in fact ‘12 distinct classes of vessel from an operational perspective and 14 from and engineering Reliability and customer satisfaction have long been areas commonly referenced to show growing passenger dissatisfaction at Sydney Ferries.
  • 9. Issue Analysis perspective.’21 The inquiry also noted that there were differences in the size and type of wharves. This imposes a significant burden upon management in terms of maintenance costs and service reliability. If a vessel breaks down, assuming there is a replacement available, the vessel may not be able to dock at all and the crew on hand may not be trained to operate that particular vessel.22 When the current franchise plans go ahead, little will change because the government will still own all vessels and will still control the route structure. Therefore all reinvestment remains the government’s responsibility. In order to institute conditions most appropriate for ongoing improvement, the government should sell the vessels to the highest bidder to get maximum value for taxpayers. So long as the responsibility of fleet replacement is in the hands of the government, it will be susceptible to the political process and budget pressures. In the hands of the private sector, managing maintenance costs and fleet replacement become technical decisions rather than political decisions. Route structure can also become more flexible and adaptable to consumer behaviour if taken out of the regulatory framework. Franchises Experience from Melbourne Franchise agreements in the past have usually boosted the consumer base or reduced reliance on government subsidy. A successful franchise needs to do both. In mass public transport, where the provision of services holds the added responsibility of ‘public welfare,’ strong patronage is important. In the late 1990s, Jeff Kennett, former Premier of Victoria, instituted a privatisation of sorts to the state’s train and tram network. The plan, which holds some similarities with the franchise plan proposed for Sydney Ferries, was marketed as a means to increase efficiency, boost services, and decrease subsidy. A decade later, the Victorian project is widely recognised as a success. The graph below shows the growth in passenger trips on Melbourne’s metropolitan trains and trams over the past 10 years, during which time those services have come from various franchisees. Patronage has grown roughly 70% on trains and around 35% on trams. Figure 4: Patronage on Melbourne’s trams and trains (2000–01 to 2009–10) *Source: VIC Department of Transport: Track Record 44.† The growth in Melbourne’s metropolitan train and tram network, as well as Brisbane’s ferry system, speaks highly of the franchise model from this angle. If governments want increased patronage regardless of cost, then this is a success. When the current franchise plans go ahead, little will change because the government will still own all vessels and will still control the route structure. † Patronage statistics do not include V/Line services.
  • 10. 10 Issue Analysis But the intention behind Melbourne’s privatisation plan was reduce subsidies over time and eventually abolish them so that the industry could stand unassisted. In reality, this goal has been abandoned, and subsidy levels have increased. In fact, the level of subsidy and the magnitude of growth in patronage are rather closely related. In Figure 4, patronage growth on both trains and trams remains modest from 2000–01 to 2003–04. The large growth comes after financial year 2003–04. As can be seen in Figure 5, this is around the same time that government subsidies to both modes doubled and contributed to strong growth. Figure 5: Comparison of subsidy levels on Melbourne’s trains and trams Source: VIC Department of Transport Public Transport, Track Record 8 to 43.†† It is not surprising that an increase in investment will generate greater use of public transport, whether it is by running more frequent services, adding new routes, or further subsidising prices. The experience in Victoria offers an important question that is often ignored: by what measure should governments consider a franchise successful? If obtaining the desired patronage numbers simply means siphoning extra tax dollars to a private company rather than a government department, little has been achieved. State governments need to reduce or abolish subsidies at the same time as patronage increases, otherwise the industry remains dependent. Franchise defects The failure of franchise plans to simultaneously increase services and reduce (or eliminate) subsidies lies in the problems created by monopoly. In the absence of the self-regulating abilities of a competitive market, regulatory frameworks create new problems. They distort existing incentives and disincentives by imposing new controls, new requirements, and new rewards. These regulations are required to prevent the harmful effects that monopolies have on consumer welfare, but are ultimately unable mimic market pressures because of asymmetric information. The problematic forms of regulation include service contracts and price regulation. Asymmetric information (service contracts) Information asymmetry in franchises arises because the regulators seldom have the same information and knowledge as the company they are regulating. Under the proposed franchise plan for the ferries, the company that wins the tender process will be employed under a service contract that stipulates the service requirements. The details of a possible service contract have not been released; †† Patronage statistics do not include V/Line services. The failure of franchise plans to simultaneously increase services and reduce (or eliminate) subsidies lies in the problems created by monopoly.
  • 11. Issue Analysis 11 however, the seven-year ferry contract between Brisbane City Council and TransdevTSL set out various performance indicators and minimum requirements, including safety, reliability and patronage.23 Contracts like that of Brisbane’s City Council include a base contract fee plus bonus payments for meeting certain performance indicators. Not all performance indicators trigger incentive payments if attained, and not all base requirements trigger contract termination if not attained. Safety standards are typically important, and in the case of Brisbane City Council, breach of safety requirements cancels any attained performance bonuses. These requirements and performance indicators in the service contracts are designed to improve performance and deter undesirable behaviour. The difficulty is that if a target is easy to attain, whether it be for patronage growth or service reliability, receiving a bonus payment for achieving the target is a waste of tax dollars. There is also little incentive for the company to improve performance past this target because it will signal to regulators that targets should be made more difficult. Conversely, if the target is difficult to attain, then the company is more worthy of a reward but will already have received one via increased fare box revenue. Hence incentive payments, although sometimes necessary, are almost always wasteful. There is also a motivation for the franchisee to deliberately avoid surpassing performance indicators to avoid raising expectations when targets are set for a new contract. In addition, performance indicators pertaining to efficiency and cost containment are rare. Success is measured by the attainment of objectives like on-time running and safety rather than lowering labour and maintenance costs. This is part of the reason why the increased patronage on Melbourne’s trams and trains over the past decade has come with an increase in government funding, which artificially reduces fare prices, rather than increased efficiency. Price regulation Under existing arrangements for Sydney Ferries, and under the proposed franchise arrangement, IPART will set maximum fares under which the company must operate. IPART’s decisions about maximum prices are made with regard to incentive implications and performance, but also pay attention to cost pressures. Prices set by IPART are an administrative price that is supposed to represent an unobservable market price. For an administrative price to be representative of the market, regular inquiry, modelling, and if possible, comparisons would be necessary. In practice this is not exactly how it works. Current price is taken as given and Sydney Ferries applies for price increases. IPART makes judgments about Sydney Ferries’ performance against current economic circumstances and decides how much of a price increase (if any) will be awarded. The fundamental problem with administrative prices is that the unobservable market price is just that—unobservable. For an administrative price to even come close, a relevant market comparison would be needed. Thus regulators have no sure-fire way of knowing whether the price is too high or too low. Ultimately, government has the virtually impossible task of coming up with a combination of contract and regulatory framework that minimises (or eliminates) subsidy while minimising costs. This is a mix that is difficult, if not unattainable, because of the distortions and disincentives created by the regulations themselves. Market Failure Natural monopoly and public goods Public provision and/or subsidisation of ferry services are generally argued on the basis of market failure—that ferry services are public goods. According to Joshua Gans, Stephen King, and N. Gregory Mankiw, public goods must be both non-rival and non-excludable.24 This means people cannot Incentive payments, although sometimes necessary, are almost always wasteful.
  • 12. 12 Issue Analysis be prevented from using the good, and one person’s use of the good does not limit another person’s use. Because of the free-rider problem that arises, public goods are provided by government and financed through taxation. It does not take much analysis of Sydney’s ferry market to see that according to the economic definition, ferry services are not public goods like the defence force, public parks, or traffic signage. Consumers cannot get a free ride on ferries. Other arguments of market failure concern whether the structure of the market favours a single firm—that the ferry market is a case of natural monopoly. Paul Samuelson and William Nordhaus describe a natural monopoly as ‘an industry in which the most efficient way of organising production is through a single firm.’25 Joshua Gans, Stephen King and N. Gregory Mankiw explain that a natural monopoly arises when there are large economies of scale over the relevant range of output such that a single firm can provide a good or service at a lower cost per unit than multiple firms.26 The obvious examples are services such as water and rail, where competing firms would have to lay down their own rail tracks or water pipes. These distribution networks are extremely expensive and thwart attempts from competitors to enter the market and undercut the incumbent. They isolate the incumbent from competitive threats and allow the monopoly to restrict output and raise prices. In the market for ferries, however, there are no distribution investments. The largest fixed cost facing ferry providers are the vessels themselves. The three JetCats that were sold off in 2007 were collectively valued at roughly $3.4 million to $4 million approximating to $1.2 million per JetCat plus spare parts.27 Given such high start-up costs, there is truth to the argument that the vessels constitute a barrier to entry and would shield incumbent ferry operators from new entrants. However, ferry services on Sydney Harbour were not provided by a single firm before the 1950s when the market was unregulated. There were several larger companies (Sydney Ferries Ltd. was the largest) but other smaller operators existed alongside. In any case, this barrier can been circumvented rather easily by leasing vessels rather than buying them outright. Brisbane City Council and some private operators have gone down this route. Leasing not only reduces the need for large, long- term capital investment but also provides ferry operators a means of lowering or eliminating maintenance costs. Strictly according to definition, there is no market failure in the way of public goods (since there is no free-rider problem). The question of natural monopoly is not as straightforward, although the option of leasing vessels makes the market much more contestable.The current monopolistic environment is a result of government intervention and restriction rather than market determination. Solutions for Sydney Ferries: The deregulation option International Experience with Deregulation International experience is somewhat limited in the way of ferry deregulation. More generally, liberalisation of maritime transport in Greece has brought vital progress to the transport market and to the development of distant island regions.28 But Sydney’s ferry market does not compare closely to the Aegean, and other ferry markets such as Hong Kong or Vancouver currently operate on franchise arrangements. For experience in transport deregulation, airline and bus deregulation are better documented. Experience in airline deregulation in Australia suggests that the benefits have included lower fares, increased patronage, increased competition and efficiency, and improved service quality.29 The Bureau of Transport and Communications Economics concluded that five years after deregulation, air fares decreased by 22% in real terms; domestic flight frequency increased by 63%; ‘revenue passenger kilometres’ increased by 74.3%; and service quality improved by 58% (measured The current monopolistic environment is a result of government intervention and restriction rather than market determination.
  • 13. Issue Analysis 13 by flight frequency improvements). The bureau noted that although the number of airlines did not change much after deregulation, 70% of the domestic market had now become ‘price sensitive,’ meaning that deregulation had roused competitive behaviour among firms. Air travel also became more popular as a result of liberalisation—the propensity of Australians to travel by air rose by more than 50%.30 The general success story of airline deregulation has been mirrored internationally (in the United States, Canada and Europe).31 The experience in bus deregulation has been mixed. The results indicate that in Britain, deregulation had been ‘neither as good as its proponents expected nor as bad as its opponents feared.’32 C.A. Nash analysed Britain’s bus market five years after deregulation and found that significant improvements in costs and services came with increased fares and lower patronage. Real costs (per bus mile) decreased by 30% and bus miles rose by 19.7%, but average real fares increased by 8.3% and passenger trips declined by 7.1%.33 Andrew Evans’s findings were slightly different. Operating costs declined by roughly 20%, real fares changed little over the first two years, then rose slightly; services (bus kilometres) increased by 24% in non-metropolitan counties and doubled in the case-study towns; and patronage remained relatively unchanged after accounting for other trends.34 The experience of deregulation illustrated that some expectations were realised—namely reduced costs and subsidy, increased services, and more innovative options.35 Authorities also expected patronage to rise and fares to fall—neither of which eventuated. Some rise in fares could have been expected because in many cases, local governments gave blanket subsidies to bus operators to hold down prices.36 Once these subsidies are removed, it is only natural that commuters now paying the full cost of the journey have to pay a higher fare, which may discourage some passengers. Competition on the Manly Route There is limited competition on the Manly route because of an amendment to the Passenger Transport Regulation 2007. The amendment allows ferry operators running a Circular Quay to Manly route to operate without a service contract if the trip can be made within 20 minutes.37 This provision was included to protect Sydney Ferries’ monopoly on regular services to Manly but to allow private companies to try their hand at the more up-market fast-ferry option. The provision allowed Bass Flinders to continue to compete alongside Sydney Fast Ferries without a service contract, and has demonstrated how competitive forces have put pressure on the two firms to reduce costs and provide affordable services. As the earlier price comparison table suggests, Sydney Ferries’ regular Manly service would have difficulty competing with private fast ferry alternatives if consumers were required to pay the full cost of their journey. The experience in Manly is significant because at the time, the JetCats were the most costly service operated by Sydney Ferries. Operating cost per hour, per seat for a JetCat was 85% more expensive than the average of all other vessels, and 33% more expensive than the next most costly service (HarbourCat).38 Since the changes have taken place, subsidies have been terminated but the route has become profitable. The introduction of the private sector and competition has managed to increase patronage while reducing costs at the same time despite the regular ferry service operating side-by-side. While it is difficult to gauge whether the success of this experiment means the rest of the market would see the same results, the first stage of the current tender process attracted considerable interest. Twenty-eight companies submitted their registrations of interest in the franchise that ostensibly suggests significant profit opportunities. It seems unpragmatic not to allow these 28 companies to compete on Experience in airline deregulation in Australia suggests that the benefits have included lower fares, increased patronage, increased competition and efficiency, and improved service quality.
  • 14. 14 Issue Analysis existing routes or create new ones. The important lesson learned from airline and bus deregulation is that the introduction of competitive forces put pressure on operators to reduce costs, and this in turn saved taxpayers large sums in subsidies. Proposal To open up the ferry market to competition, government needs to do away with monopoly and reform the regulatory environment: I. Do away with current service contract requirements and allow all private ferry operators to operate at any available ferry wharf. Under the Passenger Transport Act 1990, all commuter ferry services must hold a service contract. Firms who attempt to operate without a contract are ‘guilty of an offense’ incurring up to 1,000 penalty points.39 This requirement is the means by which government holds out competitive threats to Sydney Ferries and perpetuates a stagnant and costly ferry network. II. Eliminate distortions by removing subsidies. Taxpayers subsidise Sydney Ferries to the tune of 50%, and increasing the subsidy to allow Sydney Ferries to compete with private operators establishes an unequal playing field. An unsubsidised market would see new routes be trailed and old, underused or unprofitable routes discarded. It is impossible to predict how many new routes would be established or how many existing routes would be scrapped, but operators would need to provide a service on a route that the public demanded—and at a price they are willing to pay. III. Sell Sydney Ferries’ inefficient vessels. Buyers needn’t be a future ferry operator on the harbour. The objective should be to obtain the highest possible price for taxpayers. IV. Simpler, more convenient form of ticketing. Mass transit in Hong Kong, London and other major cities benefits from integrated ticketing. An integrated ticketing could not be carried out in a completely deregulated environment, but governments do not need to set prices and mandate routes and timetables for it to work. All that is needed is a simple permit system that requires ferry operators to supply price and route information to a central authority. Metlink (Victoria’s public transport marketing body) is one such example. It provides information on timetables, maps and guides and administers relevant signage for each mode of transport. A similar body could be used to centralise all relevant pricing and timetable arrangements and provide the information to the public. Operators could then install the relevant technology onboard (such as the swipe cards used in London and Hong Kong) to become part of the integrated network. Emphasis should lie in eliminating barriers to entry and levelling the playing field, which would leave entrepreneurs free to experiment with new types of vessels, routes, technologies, ancillary services, and other innovations. The growth potential locked out by the current restrictions could be large, and if freed up it could fundamentally change the pattern of commuter travel on the harbour. Objections to Deregulation A deregulated ferry market would encourage outright competition on all profitable routes, encouraging firms to increase services, cut costs, and lower prices. New routes may arise while unprofitable routes would be scrapped. This environment also means that cross-subsidisation would become difficult. Operators under pressure to reduce fares on profitable routes would no longer be able to cross-subsidise unprofitable routes with the excess profit. This may seem harsh for the small group The growth potential locked out by the current restrictions could be large, and if freed up it could fundamentally change the pattern of commuter travel on the harbour.
  • 15. Issue Analysis 15 of commuters who use these services, but there is little justification for keeping them running when there are alternative modes of transport. All destinations currently serviced by Sydney Ferries are also serviced by bus or train, or both. Governments do have a responsibility to provide public transport services, but doubling up on unprofitable services simply wastes taxpayers’ money. Governments subsidise public transport for welfare purposes. Citizens with limited means and who cannot afford a car or the cost of taxi services need an affordable travel option. Buses and trains serve this purpose because they have extensive reach. Ferries on the other hand are not a vital form of transport. They make up just 3% of passenger trips and a significant proportion of passengers are tourists. There are of course relatively inaccessible areas such as the harbour side suburbs of Balmain, Drummoyne and Woolwich or the eastern suburbs of Watsons Bay and Rose Bay. However, these areas are also serviced by bus, and if the public really find value in ferry services to these locations, then it will be in the ferry operators’ interests to provide them. After all, many of these suburbs are among Sydney’s most affluent and best placed to pay the full cost of their journey. Subsidising the journeys of some of Sydney’s most well-to-do citizens is not a sensible use of taxpayers’ funds. If the government wishes to assist the small minority of ferry users on low incomes, the current program for concession holders (pensioners, low-income earners and students) can be maintained. There would be some subsidy but the government would be supporting those in need without subsidising the well-to-do—and without altering the incentives of a competitive environment. Conclusion There is little rationale for government intervention in ferry operations. Passenger growth has been low since the network was taken over in 1951 and particularly poor in recent history. Heavy regulation thwarts reinvestment and innovation, while subsidies prolong dependency and drain the public purse. The NSW government’s new franchise plan is being promoted as a significant change and the solution to the ferries’ problems while in reality the subsidies, controls and incentive problems will all remain. It is likely that governments will forget about containing subsidies amid the desire to achieve large increases in patronage. The solution that will restore financial responsibility to the ferries and increase consumer choice cannot come from continued government intervention. Instead, the government needs to introduce a competitive environment similar to the successful Manly experiment. The ferry market must be a free market. A deregulated competitive market for ferries will deliver services to areas where demand is highest, put downward pressure on costs and prices, and stop the industry’s subsidy dependence. With this system in place, the industry can begin to stand on its own feet and utilise the entrepreneurial potential of the private sector. Endnotes 1 Sydney Ferries, ‘About Us.’ 2 As above. 3 Sydney Ferries, ‘How we are Charting Performance Data.’ 4 State Transit Authority, Proactive Release of Performance Information (2004–05 to 2009–10); CityRail, ‘Our Performance.’ 5 Bret Walker SC, Report of the Special Commission of Inquiry into Sydney Ferries Corporation (NSW Department of Transport, 2007), 1. 6 Tom Parry, Final Report of the Ministerial Inquiry into Sustainable Transport (Sydney: Department of Transport Services, 2003). 7 For example, IPART, Report on the Determination of Fares for Sydney Ferries (2005) and Review of Fares for Sydney Ferries in NSW (2007). Subsidising the journeys of some of Sydney’s most well-to-do citizens is not a sensible use of taxpayers’ funds.
  • 16. Issue Analysis (ISSN:1440 6306) is a regular series published by The Centre for Independent Studies, evaluating public issues and Government policies and offering proposals for reform. Views expressed are those of the authors and do not necessarily reflect the views of the Centre’s staff, advisors, directors or officers. Issue Analysis papers (including back issues) can be purchased from CIS or can be downloaded free from www.cis.org.au. The Centre for Independent Studies l PO Box 92, St Leonards, NSW 1590 Australia l p: +61 2 9438 4377 l f: +61 2 9439 7310 l cis@cis.org.au 8 Sydney Ferries, Annual Reports (2004–05 to 2009–10). 9 ABS (Australian Bureau of Statistics), Consumer Price Index, Australia, Cat. No. 6401.0 (Canberra: ABS, June 2011), tables 1 and 2. 10 Bret Walker SC, Report of the Special Commission of Inquiry into Sydney Ferries Corporation, as above, 192. 11 As above, 207. 12 As above, 208. 13 CityRail, ‘Our Performance.’ 14 ABS (Australian Bureau of Statistics), Regional Population Growth, Australia, ABS Cat. No. 3218.0 (Canberra: ABS, March 2011); ABS, Official Yearbook of NSW No. 53 1950-51 (1955). 15 ABS (Australian Bureau of Statistics), Regional Population Growth, Australia, ABS Cat. No. 3218.0 (Canberra: ABS, March 2011), Table 3. 16 As above, Table 1. 17 Department of Transport, ‘NSW Government to begin reform of Sydney Ferries’ (11 May 2011). 18 Phone conversations with management of Sydney Fast Ferries and Bass Flinders. 19 Bret Walker SC, Report of the Special Commission of Inquiry into Sydney Ferries Corporation, as above, 63. 20 Sydney Ferries, Annual Reports (2004–05 to 2009–10). 21 Bret Walker SC, Report of the Special Commission of Inquiry into Sydney Ferries Corporation, as above, 48. 22 As above, 48. 23 Personal correspondence with Brisbane City Council. 24 Joshua Gans, Stephen King, and N. Gregory Mankiw, Principles of Microeconomics (Sydney: Harcourt Brace Company, 1999), 216. 25 Paul A. Samualson and William D. Nordhaus, Principles of Economics (13th edition) (New York: McGraw-Hill, 1989), 588. 26 Joshua Gans, et al., Principles of Microeconomics, as above, 302. 27 Rhys Haynes, ‘Taxpayers lose over $3 million after Sydney Ferries botches tender process for Manly JetCats,’ The Daily Telegraph (10 December 2009). 28 C.I. Chlomoudis, P.L. Pallis, Stratos Papadimitriou, and E.S. Tzannatos, ‘The Liberalisation of Maritime Transport and the Island Regions in EU. Evidence from Greece,’ European Transport 37 (2007), 1. 29 BTCE (Bureau of Transport and Communications Economics), Information Sheet 6: Deregulation of Domestic Aviation in Australia 1990–1995, 1. 30 As above, 3. 31 Steven Morrison and Clifford Winston, ‘Airline Deregulation and Public Policy,’ Science 245:4919 (August 1989), 707–711; Edward Iacobucci, Michael Trebilcock, and Ralph A. Winter, ‘The Canadian Experience with Deregulation,’ The University of Toronto Law Journal 56:1 (Winter, 2006), 51. 32 C.A. Nash, ‘British Bus Deregulation,’ The Economic Journal 103:419 (July 1993), 1042. 33 As above, 1046. 34 Andrew Evans, ‘Are Urban Bus Services Natural Monopolies?’ Paper presented to the Fifteenth Australasian Transport Research Forum (Sydney: 1990), 253–256. 35 J. Enrique Fernandez and Juan Carlos Muñoz, ‘Privatisation and Deregulation of Urban Bus Services: An Analysis of Fare evolution Mechanisms,’ Journal of Transport Economics and Policy 41:1 (January 2007), 25–49. 36 C.A. Nash, ‘British Bus Deregulation,’ as above, 1046. 37 NSW Passenger Transport Regulation 2007, clause 216A. 38 Bret Walker SC, Report of the Special Commission of Inquiry into Sydney Ferries Corporation, as above, 315. 39 NSW Passenger Transport Act 1990, clause 16.