Regional Housing Aug 2016
•
1 like•315 views

- Housing prices in Vancouver and Toronto have continued rising unexpectedly in 2016, defying expectations of a soft landing. - Vancouver's housing market is expected to experience a modest price correction of around 10% by mid-2017 due to new foreign buyer taxes and high unaffordability. - Toronto's housing market is projected to continue accelerating in the near term due to limited supply response and potential increased foreign investment switching from Vancouver.

Recommended
Recommended
More Related Content
What's hot
What's hot (20)
Viewers also liked
Viewers also liked (16)
Similar to Regional Housing Aug 2016
Similar to Regional Housing Aug 2016 (20)
More from TD Wealth Private Investment Advice
More from TD Wealth Private Investment Advice (18)
Recently uploaded
Recently uploaded (20)
Regional Housing Aug 2016
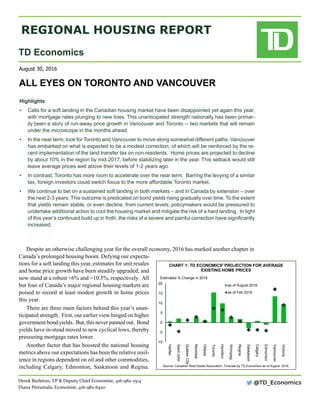
- 1. REGIONAL HOUSING REPORT TD Economics all eyes on toronto and vancouver August 30, 2016 Derek Burleton, VP & Deputy Chief Economist, 416-982-2514 Diana Petramala, Economist, 416-982-6420 Highlights • Calls for a soft landing in the Canadian housing market have been disappointed yet again this year, with mortgage rates plunging to new lows. This unanticipated strength nationally has been primar- ily been a story of run-away price growth in Vancouver and Toronto -- two markets that will remain under the microscope in the months ahead. • In the near term, look for Toronto and Vancouver to move along somewhat different paths. Vancouver has embarked on what is expected to be a modest correction, of which will be reinforced by the re- cent implementation of the land transfer tax on non-residents. Home prices are projected to decline by about 10% in the region by mid-2017, before stabilizing later in the year. This setback would still leave average prices well above their levels of 1-2 years ago. • In contrast, Toronto has more room to accelerate over the near term. Barring the levying of a similar tax, foreign investors could switch focus to the more affordable Toronto market. • We continue to bet on a sustained soft landing in both markets – and in Canada by extension – over the next 2-3 years. This outcome is predicated on bond yields rising gradually over time. To the extent that yields remain stable, or even decline, from current levels, policymakers would be pressured to undertake additional action to cool the housing market and mitigate the risk of a hard landing. In light of this year’s continued build up in froth, the risks of a severe and painful correction have significantly increased. Despite an otherwise challenging year for the overall economy, 2016 has marked another chapter in Canada’s prolonged housing boom. Defying our expecta- tions for a soft landing this year, estimates for unit resales and home price growth have been steadily upgraded, and now stand at a robust +6% and +10.5%, respectively. All but four of Canada’s major regional housing markets are poised to record at least modest growth in home prices this year. There are three main factors behind this year’s unan- ticipated strength. First, our earlier view hinged on higher government bond yields. But, this never panned out. Bond yields have in-stead moved to new cyclical lows, thereby pressuring mortgage rates lower. Another factor that has boosted the national housing metrics above our expectations has been the relative resil- ience in regions dependent on oil and other commodities, including Calgary, Edmonton, Saskatoon and Regina. @TD_Economics -10 -5 0 5 10 15 20 Halifax SaintJohn QuébecCity Montréal Ottawa Toronto Hamilton Winnipeg Regina Saskatoon Calgary Edmonton Vancouver Victoria as of August 2016 as of Feb 2016 Source: Canadian Real Estate Association. Forecast by TD Economics as of August 2016. CHART 1: TD ECONOMICS' PROJECTION FOR AVERAGE EXISTING HOME PRICES Estimated % Change in 2016
- 2. TD Economics | www.td.com/economics 2August 30, 2016 While these economies were hard hit by the commodity price downturn, home price declines have thus far been much shallower than feared, supported in part by still fairly healthy population growth. Still, an imminent rebound in prices is yet to be seen across these markets with softness likely to extend over the next several quarters. But, the major culprit for the Canadian market’s over- heated state remains the runaway price growth in Vancouver and Toronto’s white-hot markets. In this edition of the Re- gional Housing Outlook, we shine the spotlight on these two similar yet distinct housing markets. In the coming months, these regions are likely to move along somewhat different paths, as Toronto continues to forge ahead, while the recent foreign buyer’s tax and past erosion in affordability set the stage for a pull-back in Vancouver housing activity. Looking out to 2017-18, however, the outlook becomes murkier. Although there is a real risk that housing activ- ity in Vancouver will rebound strongly next year as the impact of the tax fades, we continue to bet that the start of multi-year, gradual normalization in bond yields will help to keep activity in check. The modest upward pressure on mortgage rates, combined with the dampening effect on sales and prices from this year’s erosion in affordability should lead to a moderate cooling in Toronto’s market over the medium term. Excesses in housing can either be addressed through a quick and painful correction or a less severe, but more drawn out period of sub-par activity – a so-called “soft landing”. Our baseline projections for Toronto and Vancouver, and by extension Canada, continue to be built on the latter narra- tive. At the start of the year, we had believed that Toronto and Vancouver would experience a 3-4 year period of more subdued housing market conditions, but in light of the subsequent run-up in prices, that longer-term adjustment phase is now likely to be even longer. Moreover, the risk of a much more severe outcome than in our base case has increased significantly over the past year. Some air starting to come out of the Vancouver market In recent months, average home prices inVancouver have risen by an alarming 30% above their previous year’s levels. As such, it was likely only a matter of time before ultra- stretched housing affordability would trigger an adjustment in housing demand, and consequently prices. Wild swings in prices and activity are well documented in the history of the Vancouver housing market, which tends to be significantly more volatile than most other Canadian housing markets. Indeed, statistics on market performance in the months ahead of the implementation of the foreign buyers on Au- gust 2nd, revealed a market that was already beginning to cool. In July, Vancouver home sales were 20% lower than a year earlier. Meanwhile, new and resale supply – which had remained stubbornly low earlier in the year – showed clear signs of responding to price strength. New homes under construction surged in early-2016 to a record level. And while resale listings have not responded to the same extent, they too have started to inch up. Home prices are still growing at a hot pace, with the average resale price up a still-hot 17% y/y in July, and a measure of prices that adjusts for compositional shifts in sales holding firm at 33% y/y. However, prices tend to lag activity, with turning points in demand-supply conditions manifesting in prices a month or two later. 0 200,000 400,000 600,000 800,000 1,000,000 1,200,000 1990 1995 2000 2005 2010 2015 CHART 3: HOME PRICES SURGE Toronto Vancouver (f. as of August 2016) Source: Canadian Real Estate Board. F. by TD Economics as of August 2016. Average Home Price, Level Fcst. Forecast as of Feb 2016 0 1 2 3 4 5 6 7 8 2007 2012 2017 CHART 2: INTEREST RATES STAY LOWER FOR EVEN LONGER 5-Year Government Bond Yield Forecast as of January 2016 5-Year Mortgage Rates Source: Bank of Canada. F. by TD Economics as of August 2016. 5-Year Interest Rates, % Forecast
- 3. TD Economics | www.td.com/economics 3August 30, 2016 By virtually all accounts, the Vancouver region’s market remains drum-tight. The ratio of sales to listings continues to favour sellers, and the level of new home inventories has stayed historically depressed. However, there is little doubt that market momentum has been on the wane – a trend that will only be reinforced in the near term by the foreigner-buyer tax. In addition to its timing, the scope of the new land transfer tax on non-residents in Vancouver (along with a proposed tax measure targeting empty housing) will likely increase its impact. The tax is relatively high as compared to similar measures undertaken in some jurisdictions such asAustralia, while recent data collected by the B.C. govern- ment confirmed that foreign buyers have been a key source of demand in the Vancouver region. Between June 10th and July 14th, non-residents accounted for a significant one in every seven transactions. Our modelling suggests that the tax measures could re- duce sales activity by 10-15% in the Vancouver region over the next six months. Such an outcome assumes a substantial direct impact on foreign purchases as well as an indirect pull- back in buying by residents – speculators included – who may prefer to sit on the sidelines given the heightened market uncertainty. The resulting demand adjustment, combined with the continued supply pipeline, should help rebalance the Vancouver housing market in the coming months, and push prices somewhat lower. Little slackening seen in Toronto The other side of the coin is Toronto, where housing activity looks set to sustain its recent momentum, or perhaps ramp up further in the coming months. Three factors set apart the near-term outlook for Toronto from that of Van- couver. First, despite the price gains, Toronto’s market has displayed a more muted supply response than Vancouver. The supply of resale listings has remained stuck at close to seven year lows in recent months. This lack of response has fueled further talk of what TD Economics coined as “buyer’s gridlock”, whereby rising premium of prices on upper-end homes has limited the options available to move up buyers and reduced churn in the marketplace. This dynamic, also evident in Vancouver, is discussed in more detail in a re- cent TD Economics’ article. As far as new supply goes, the Toronto market continues to register an elevated number of units under construction, but lengthy permitting processes and infrastructure deficiencies are commonly cited as key factors that have dramatically slowed the rate at which starts 0.0 0.2 0.4 0.6 0.8 1.0 1.2 1.4 1.6 1.8 1990 1993 1996 1999 2002 2005 2008 2011 2014 CHART 4: EXISTING HOME SALES Vancouver Toronto Source: Canaadian Real Estate Association, TD Economics. Level indexed at long-run average=1.0, 4-Month Moving Average 0.0 2.0 4.0 6.0 8.0 10.0 12.0 14.0 16.0 18.0 2001 2004 2007 2010 2013 2016 CHART 5: NEW HOMES UNDER CONSTRUCTION PER 1,000 OF PERSONS Vancouver Toronto Source: Canadian Housing and Mortgage Corporation, TD Economics. Level 0.0 0.1 0.2 0.3 0.4 0.5 0.6 0.7 0.8 0.9 2000 2003 2006 2009 2012 2015 CHART 6: EXISTING SALES-TO-LISTINGS RATIO Vancouver Toronto Source: Canaadian Real Estate Association. F. by TD Economics as of August 2016. Ratio, Level Forecast Balanced Market Seller's Market Buyer's Market
- 4. TD Economics | www.td.com/economics 4August 30, 2016 are translated into new completions. As such, the market is expected to witness a supply response over time, it just may be more staggered than in the Vancouver market. Second, in light of the new tax measures in Vancouver, theToronto housing market may look increasingly appealing to foreign buyers who are less particular on where in Canada they park their money. While substitutability of Toronto and Vancouver is hard to estimate, we suspect that foreign flows were already beginning to gravitate to Toronto even prior to the tax measure announcement, given the marked slowdown in Vancouver’s high-end market and concurrent pickup in Toronto earlier this year. Third, the Toronto market has exhibited significantly less price appreciation on a quality-adjusted basis over the last three years, suggesting less room for a near-term cor- rection. Having said that, price gains in these cities over a longer (i.e., 5 year) horizon have run more or less in line with each other. 2017 outlook much murkier As such, Toronto and Vancouver’s housing markets are likely to head into 2017 on different trajectories. As supply- demand conditions continue to slacken in the months ahead, Vancouver average home prices could see an outright decline by as much as 10% from their recent peak in April 2016. This would mark a similar price adjustment to that recorded in the region in 2010-12. The timing and targeted nature of the new tax on foreign buyers and the frothier market condi- tions currently could result in a quicker price hit this time around. In contrast, for Toronto, we would not be surprised to see annual price growth sustained at their double-digit pace over the remainder of this year. The bigger questions surround the outlook for these markets beyond the near term. Can Toronto maintain its current heady pace of momentum into 2018? An even more challenging forecast to pin down is that of Vancou- ver. For one, international experience suggests that similar policy moves have generally only manifested in a transitory market cooldown of only one to two quarters.Furthermore, while expected near-term slowdown in housing could clip the wings of job growth in Vancouver, economic and de- mographic fundamentals in the region are likely to remain generally supportive to home buying. There likely continues to be a large pool of pent-up demand in Vancouver, buyers who have been priced out of the market, but are ready to jump in once prices fall. This highlights the potential for Vancouver’s market to resume its ascent once the impact of the tax fades. 0 20 40 60 80 100 120 140 2007 2010 2013 2016 CHART 9: AUSTRALIA HOME PRICE INDEX Source: Australian Bureau of Statistics, TD Economics. Indexed at 2011 Q2 to 2012 Q2=100 New South Wales and Victoria introduce a 3% land transfer tax on foreign buyers 0.0 2.0 4.0 6.0 8.0 10.0 12.0 14.0 16.0 Vancouver (Metro) Rest of B.C. CHART 7: FOREIGN BUYING IN B.C. AS A SHARE OF TOTAL TRANSACTIONS Jun 10 - Jul 14 Jun 30 - Jul 14 Source: B.C. Government Statistics % -20 -10 0 10 20 30 40 2006 2009 2012 2015 CHART 8: MLS HOME PRICE INDEX Vancouver Toronto Source: Canaadian Real Estate Association, TD Economics. Year-over-Year % Change
- 5. TD Economics | www.td.com/economics 5August 30, 2016 Higher rates to keep markets in check in 2017-18 Still, our baseline forecast predicts neither a continued acceleration in Toronto housing market activity nor a sharp revival in Vancouver’s market next year. Instead, we expect Toronto’s hot market to cool steadily as affordability con- tinues to erode and impact demand. For Vancouver we still forecast price growth to resume, but only at a modest pace given affordability is unlikely to be restored even following a 10% contraction in prices. Such an outcome is conditional on the view that Canadian bond yields will in fact edge up in the coming quarters. The risk in the near term is that yields push lower, dragged down by global weakness. However, with the Federal Reserve likely to remove accommodation next year, in the form of two 25 basis point hikes next year, Canadian yields should ultimately follow U.S. yields gradually higher. We expect the longer-run yields to increase by 40 basis points by next year and 90 basis points by the end of 2018. Alongside this gradual uptick in bond yields, a planned move by the bank regulator (OSFI) to raise capital require- ments on chartered banks next year is poised to further tighten mortgage borrowing conditions. Combined, these actions are expected to keep a lid on housing demand. We suspect that any talk of higher interest rates may be met with a groan from readers – an understandable reac- tion given the poor record by economists in anticipating rate increases that never came. To assuage the skeptics, we provide a scenario for price growth in both markets in the event that yields fall in the near term and hold at those levels through 2017 and into 2018 (Chart 12). Under such a scenario, Vancouver prices would record a more notable rebound, while unsustainable home price appreciation in the double-digit range would likely continue in Toronto. Other regions in Canada would also draw support from the lower rates and outperform relative to our base case forecast. This would have mixed implications for a number of markets. For those which have embarked on multi-year soft landings and/or where prices appear appropriately valued – including a number of markets east of Toronto – stronger demand would help to mop up any supply glut that persists and provide some stimulus to growth conditions. In a number of other markets where signs of over-valuation remain – including Calgary, Saskatoon, Regina and Edmon- ton – needed adjustments would be delayed beyond 2017-18. 0 2 4 6 8 10 12 14 16 0 5,000 10,000 15,000 20,000 25,000 30,000 35,000 40,000 45,000 1988 1994 2000 2006 2012 CHART 10: LOW RATES DRIVE SALES UP Toronto and Vancouver Existing Home Sales 5-Year Mortgage Rate Source: Bank of Canada. F. by TD Economics as of August 2016. Unit Sales, 000's 5-Year Mortgage Rate, % -6 -4 -2 0 2 4 6 8 10 Toronto Vancouver CHART 12: EXPECTED FORECAST FOR AVERAGE HOME PRICE GROWTH OVER 2017-16 UNDER VARIOUS INTEREST RATE SCENARIOS Base Case If rates are 1% lower If rates stay the same Source: CREA. F. by TD Economics as of August 2016 % 0 10 20 30 40 50 60 70 80 1988 1994 2000 2006 2013 CHART 11: TD ECONOMICS HOUSING AFFORDABILITY INDEX Vancouver @ a 1% reduction in interest rates Toronto @ a 1% reduction in interest rates Vancouver @ base case interest rate outlook Toronto @ base case interest outlook Source: Statistics Canada, CREA. Forecast by TD Economics as at August 2016. Index based on avrg priced home, avrg household income and conventional mortgage terms Fcst
- 6. TD Economics | www.td.com/economics 6August 30, 2016 through either a higher qualifying interest rate (of say 5% in some countries) or standardizing the qualifying amortization to 25 years on non-insured mortgages (currently, 30 years is often applied). The former action is likely to have a much more dampening impact than the latter. Other considerations arise. Much of the recent focus has been on increasing regulations on Canadian banks in light of the regulatory framework and the argument that these institutions are systematically important. However, any such regulations are necessarily going to shift activity to the un- regulated sector with potentially unintended consequences for the housing market and the economy. Ultimately, the federal government will likely tread carefully. Any additional actions undertaken would need to be supported by the data and consider both the potential unintended consequences as well as impacts from other planned measures – notably, OSFI’s efforts to increase bank capital rules on mortgage lending. A word on the fixing the supply side A number of recent commentaries have cast focus on impediments to supply as the main driver of the recent housing affordability crisis in Vancouver and Toronto. While we view the recent froth as a fairly complex inter- play between supply and demand dynamics, we have also pounded the drum on the supply issue in a GTA-focused report in January 2015. In that report, we stressed the need for governments to address a number of barriers that have raised development costs and reduced the sensitivity of sup- ply to prices which ultimately signal market demand. These include lengthy permitting processes, inefficient property tax and development charge systems as well as land policies. Inadequate infrastructure has also been a culprit driving up the cost on housing. While Vancouver faces some of its own unique challenges, both Toronto and Vancouver share many commonalities as two rapidly-growing urban regions. Unfortunately, in the 18 month period since that report, little has changed from an active policy standpoint and the supply pipeline has grossly under paced the demand side of the equation. In this regard, we view the federal-provincial-municipal working group established by Minister Morneau to study solutions to the housing crisis in Toronto and Vancouver as a significant opportunity. The broad mandate of the working committee – which plans to look at housing as a system rather than looking exclusively at home ownership or affordable rental and consider policies across all levels of Pressure could increase on governments and regulators to take further action If left unchecked, housing booms of this degree can continue on for years. The U.S. bubble lasted more than five years. The longer they go on for, the harder the land- ing is likley to be. As such, to the extent that interest rates continue to surprise on the downside and/or markets fail to cool in the coming quarters, pressure on policy makers to implement further actions would intensify. These would be carried out under the banner of addressing the affordability crisis and protecting the financial system against growing risks to stability. There would be heightened calls for addi- tional real estate taxes targeted at foreigners or speculators, particularly in Toronto.Additional changes to the mortgage regulatory environment (also known as macroprudential rule changes) would also likely be on the table. Staff at the Bank of Canada recently analyzed the ef- fectiveness of various policy tools in targeting excessive home price and debt growth, while taking into account their costs on economic growth. The researchers consid- ered macro-prudential regulations, interest rate hikes, and real estate taxes, and concluded macro-prudential rules are the most efficient in addressing housing excesses in a low- growth environment.Adjusting the allowable loan-to-value ratio would have a bigger impact on reducing home price growth, with the lowest cost to economic output among all three options. Yet if one boils it down to macro-prudential policies there is no precise playbook and impacts are not only uncertain but vary widely across choices. For example, there has been dis- cussion of making mortgage income testing more stringent 0.0 10.0 20.0 30.0 40.0 50.0 60.0 70.0 80.0 Toronto Vancouver CHART 13: HOUSING AFFORDABILITY UNDER VARIOUS MORTGAGE QUALIFICATION RATES At Special rate At 5-year Posted At 5% Mortgage Rate Source: CREA. Statistics Canada. Calculated by TD Economics Affordability index under various 5-year mortgage rates, %
- 7. TD Economics | www.td.com/economics 7August 30, 2016 Derek Burleton, VP & Deputy Chief Economist 416-982-2514 Diana Petramala, Economist 416-982-6420 actions in the still red-hot Toronto market. We still expect a sustained, rate-induced soft landing as the most likely outcome in these two markets in 2017-18 timeframe. Still, without a catalyst – which could take the form of a gradual increase in interest rates – there is a strong likelihood that Vancouver’s market could reheat while Toronto’s remains on an unsustainable track over the medium term. To the extent that bond yields fail to track higher, policymakers may need to consider other alternatives to rein in the Canadian housing market. government – fits with the holistic approach that we cham- pioned in our 2015 report. However, by the time policies are studied, decided and implemented, it will be ineffective in alleviating supply constraints in the near term. Cyclical dynamics will continue to rule the day. The bottom line Canada’s two hottest housing markets increasingly appear to be moving in separate directions. The new tax program in Vancouver will put further downward pressure on an already cooling housing market, while boosting trans-
- 8. TD Economics | www.td.com/economics 8August 30, 2016 SUMMARY TABLES 2015 2016F 2017F 2018F 2015 2016F 2017F 2018F canada 506.4 537.2 522.2 518.5 canada 5.4 6.1 -2.8 -0.7 n. & l. 4.3 4.2 4.2 4.3 n. & l. 3.7 -0.3 -0.3 2.4 St. John's* -- -- -- -- St. John's* -- -- -- -- P.e.I. 1.7 2.0 2.0 2.1 P.e.I. 20.8 18.5 1.7 2.4 n.s. 9.2 9.5 9.4 9.5 n.s. 2.8 3.8 -0.9 0.5 Halifax 4.8 4.9 4.7 4.7 Halifax 1.7 2.3 -4.8 -0.2 n.B. 6.7 6.8 6.9 6.9 n.B. 6.5 2.4 0.9 0.3 Saint John 1.7 1.9 1.9 1.9 Saint John 5.5 10.5 1.5 1.2 Québec 74.2 78.9 81.2 82.0 Québec 5.0 6.4 2.9 1.1 Québec City 6.6 6.9 7.1 7.1 Québec City 2.4 4.4 2.7 0.0 Montréal 37.9 40.5 42.1 42.6 Montréal 6.1 6.7 4.0 1.2 ontario 224.6 242.3 244.8 244.4 ontario 9.5 7.9 1.0 -0.2 Ottawa 14.8 15.8 16.5 16.8 Ottawa 5.3 6.1 5.0 1.5 Toronto 101.8 113.0 115.2 112.5 Toronto 9.2 10.9 2.0 -2.4 Hamilton 15.9 16.1 17.5 17.9 Hamilton 11.1 1.4 8.6 1.9 Manitoba 14.0 14.8 14.9 15.2 Manitoba 1.7 5.7 0.5 1.9 Winnipeg 12.3 13.0 13.1 13.4 Winnipeg 1.0 6.3 0.8 1.9 sask. 12.4 11.5 11.5 11.7 sask. -10.8 -7.1 -0.3 2.0 Regina 3.4 3.3 3.3 3.4 Regina -8.1 -3.3 -0.8 2.3 Saskatoon 5.2 4.8 4.8 5.0 Saskatoon -13.0 -8.2 1.1 3.1 alberta 56.5 52.1 53.4 54.0 alberta -21.3 -7.7 2.5 1.2 Calgary 24.0 22.5 23.3 23.9 Calgary -28.6 -6.3 3.4 2.7 Edmonton 18.7 17.5 18.3 18.8 Edmonton -9.1 -6.0 4.1 3.0 B.c. 102.5 114.6 93.9 88.4 B.c. 22.0 11.8 -18.0 -5.9 Vancouver 43.1 41.8 32.4 33.0 Vancouver 28.1 -3.2 -22.5 1.8 Victoria 7.9 10.1 8.6 8.3 Victoria 23.5 27.9 -14.4 -3.8 F. by TD Economics as of August 2016 *Insufficient Data Source: Canadian Real Estate Association taBle 1: eXIstInG HoMe sales 000's of units Annual per cent change
- 9. TD Economics | www.td.com/economics 9August 30, 2016 2015 2016F 2017F 2018F 2015 2016F 2017F 2018F canada 440.0 486.7 482.2 484.2 canada 8.1 10.6 -0.9 0.4 n. & l. 276.3 254.8 250.5 250.5 n. & l. -2.8 -7.8 -1.7 0.0 St. John's* -- -- -- -- St. John's* -- -- -- -- P.e.I. 164.1 178.6 182.5 184.7 P.e.I. -0.6 8.8 2.2 1.2 n.s. 217.8 213.6 212.5 213.7 n.s. 2.1 -1.9 -0.5 0.6 Halifax 281.3 282.9 291.7 295.2 Halifax 3.4 0.6 3.1 1.2 n.B. 159.5 163.0 170.3 172.4 n.B. -0.9 2.2 4.5 1.2 Saint John 162.9 166.3 170.2 172.3 Saint John -4.1 2.1 2.4 1.2 Québec 275.4 281.2 284.9 289.0 Québec 1.5 2.1 1.3 1.4 Québec City 265.7 266.0 273.6 276.9 Québec City 0.2 0.1 2.9 1.2 Montréal 337.9 346.6 352.7 360.1 Montréal 1.9 2.6 1.8 2.1 ontario 461.5 523.7 548.6 550.4 ontario 7.5 13.5 4.8 0.3 Ottawa 366.4 370.4 377.1 378.2 Ottawa 1.6 1.1 1.8 0.3 Toronto 616.6 711.9 744.7 747.4 Toronto 9.4 15.5 4.6 0.4 Hamilton 440.4 483.8 497.0 507.6 Hamilton 8.9 9.9 2.7 2.1 Manitoba 268.1 275.6 279.5 282.5 Manitoba 1.3 2.8 1.4 1.1 Winnipeg 275.9 283.2 287.5 290.9 Winnipeg 1.4 2.6 1.5 1.2 sask. 296.1 292.5 291.9 294.8 sask. -0.6 -1.2 -0.2 1.0 Regina 308.3 313.7 312.6 314.3 Regina -2.1 1.8 -0.4 0.6 Saskatoon 343.1 333.4 327.8 332.2 Saskatoon 0.7 -2.8 -1.7 1.3 alberta 391.4 388.2 383.0 385.8 alberta -2.1 -0.8 -1.3 0.7 Calgary 451.7 455.8 447.3 448.0 Calgary -1.7 0.9 -1.9 0.2 Edmonton 368.2 364.1 359.7 362.6 Edmonton 1.9 -1.1 -1.2 0.8 B.c. 637.0 703.7 670.0 686.4 B.c. 11.7 10.5 -4.8 2.4 Vancouver 900.7 1,046.9 990.0 966.8 Vancouver 10.8 16.2 -5.4 -2.3 Victoria 519.0 567.7 559.0 565.0 Victoria 4.8 9.4 -1.5 1.1 Annual per cent change F. by TD Economics as of August 2016 *Insufficient Data Source: Canadian Real Estate Association taBle 2: averaGe eXIstInG HoMe PrIce Canadian $, 000's
- 10. TD Economics | www.td.com/economics 10August 30, 2016 2015 2016F 2017F 2018F 2015 2016F 2017F 2018F canada 193.6 196.8 179.6 173.9 canada 2.3 1.6 -8.8 -3.1 n. & l. 1.8 1.6 1.4 1.8 n. & l. -19.0 -9.7 -12.5 28.6 St. John's* 1.0 0.7 0.5 0.9 St. John's* -20.1 -26.9 -28.6 80.0 P.e.I. 0.54 0.58 0.60 0.60 P.e.I. 5.1 7.4 3.4 0.0 n.s. 3.9 3.3 3.4 3.5 n.s. 27.2 -14.9 3.0 2.9 Halifax 2.6 2.0 2.1 2.2 Halifax 46.2 -22.4 5.0 4.8 n.B. 1.9 1.8 2.3 2.2 n.B. -15.2 -9.9 29.7 -1.8 Saint John 0.2 0.3 0.4 0.3 Saint John -10.1 18.9 48.0 -13.5 Québec 36.8 37.0 40.5 43.2 Québec -6.3 0.4 9.5 6.7 Québec City 5.5 4.5 5.5 6.2 Québec City 23.1 -17.5 22.2 12.7 Montréal 18.8 15.5 18.0 20.0 Montréal 0.5 -17.4 16.1 11.1 ontario 68.8 74.6 62.0 55.5 ontario 17.5 8.4 -16.9 -10.5 Ottawa 4.9 4.3 4.0 3.9 Ottawa -15.4 -11.7 -7.0 -2.5 Toronto 42.0 43.0 37.0 30.0 Toronto 45.8 2.4 -14.0 -18.9 Hamilton 2.0 3.3 3.0 2.6 Hamilton -28.9 64.1 -9.1 -13.3 Manitoba 5.6 5.5 5.8 6.0 Manitoba -9.3 -1.9 5.5 3.4 Winnipeg 4.4 4.2 4.5 4.4 Winnipeg 4.8 -5.3 7.1 -2.2 sask. 5.2 4.5 4.4 4.6 sask. -37.2 -13.4 -2.2 4.5 Regina 1.6 1.0 1.1 1.2 Regina -28.4 -37.4 10.0 9.1 Saskatoon 2.3 2.0 1.8 1.9 Saskatoon -33.2 -14.2 -10.0 5.6 alberta 37.5 23.0 22.3 23.5 alberta -7.4 -38.7 -3.0 5.4 Calgary 13.1 8.0 7.5 8.5 Calgary -23.6 -38.8 -6.3 13.3 Edmonton 17.1 9.2 8.8 9.0 Edmonton 23.5 -46.3 -4.3 2.3 B.c. 31.5 45.0 36.9 33.0 B.c. 11.4 42.8 -18.0 -10.6 Vancouver 20.9 30.0 26.0 23.0 Vancouver 8.7 43.7 -13.3 -11.5 Victoria 2.0 3.0 2.9 2.0 Victoria 54.0 48.7 -3.3 -31.0 Thousands of Units Per cent change taBle 3: HousInG starts F. by TD Economics as of August 2016 Source: Canadian Mortgage and Housing Corporation, Statistics Canada
- 11. TD Economics | www.td.com/economics 11August 30, 2016 2015 2016F 2017F 2018F 2015 2016F 2017F 2018F canada 56.2 61.1 56.8 55.2 canada 2.6 4.9 -4.3 -1.6 n. & l. 39.1 37.7 37.5 37.9 n. & l. 1.8 -1.4 -0.2 0.5 St. John's* -- -- -- -- St. John's* -- -- -- -- P.e.I. 45.2 57.5 61.5 62.2 P.e.I. 9.1 12.3 4.0 0.7 n.s. 44.3 53.4 58.0 58.6 n.s. 1.2 9.1 4.6 0.7 Halifax 46.4 56.1 58.2 57.4 Halifax 0.2 9.8 2.1 -0.8 n.B. 41.6 44.3 44.7 45.1 n.B. 3.3 2.7 0.4 0.4 Saint John 39.0 43.1 45.1 45.1 Saint John 3.3 4.1 1.9 0.0 Québec 46.3 51.4 51.8 51.7 Québec 2.3 5.1 0.4 -0.2 Québec City 48.1 50.7 52.1 52.3 Québec City -0.4 2.6 1.4 0.1 Montréal 48.9 55.3 55.4 55.0 Montréal 3.0 6.4 0.1 -0.4 ontario 60.4 68.8 64.6 62.8 ontario 4.2 8.4 -4.2 -1.8 Ottawa 46.3 52.8 57.0 57.9 Ottawa 1.0 6.5 4.2 0.9 Toronto 63.1 71.1 62.9 59.4 Toronto 3.7 8.0 -8.2 -3.5 Hamilton 77.0 86.5 89.4 87.9 Hamilton 3.3 9.5 2.9 -1.5 Manitoba 54.4 58.4 57.6 55.4 Manitoba -3.3 4.0 -0.8 -2.2 Winnipeg 55.3 59.4 59.0 57.3 Winnipeg -3.6 4.1 -0.4 -1.7 sask. 40.1 40.3 41.8 42.1 sask. -6.0 0.2 1.5 0.3 Regina 43.9 47.4 48.8 49.3 Regina -1.1 3.5 1.4 0.5 Saskatoon 37.7 37.6 39.0 39.8 Saskatoon -8.8 -0.1 1.4 0.7 alberta 51.5 48.5 48.8 48.3 alberta -13.1 -3.0 0.2 -0.5 Calgary 56.2 53.9 55.0 55.1 Calgary -13.7 -2.2 1.0 0.1 Edmonton 49.9 48.0 48.6 48.9 Edmonton -12.8 -1.9 0.7 0.3 B.c. 67.4 69.5 53.7 49.7 B.c. 11.6 2.1 -15.8 -4.0 Vancouver 73.3 64.8 45.3 45.0 Vancouver 14.9 -8.5 -19.5 -0.3 Victoria 66.6 83.3 69.7 66.3 Victoria 11.5 16.7 -13.6 -3.5 F. by TD Economics as of August 2016 Source: Canadian Real Estate Association taBle 4: sales-to-neW lIstInGs ratIo Per cent *Insufficient Data Per cent change
- 12. TD Economics | www.td.com/economics 12August 30, 2016 2015 2016F 2017F 2018F 2015 2016F 2017F 2018F canada 26.3 30.4 31.5 32.3 canada 0.0 4.1 1.1 0.8 n. & l. 19.0 18.3 18.9 19.2 n. & l. -2.1 -0.7 0.5 0.4 St. John's** St. John's** -- -- -- -- P.e.I. 12.7 14.4 15.4 15.9 P.e.I. -1.1 1.7 1.0 0.5 n.s. 16.3 16.7 17.4 17.8 n.s. -1.0 0.4 0.7 0.4 Halifax 17.3 18.2 19.7 20.3 Halifax -1.0 0.9 1.5 0.6 n.B. 12.5 13.3 14.6 15.0 n.B. -1.1 0.8 1.3 0.5 Saint John 12.7 13.6 14.5 15.0 Saint John -1.6 0.8 1.0 0.5 Québec 19.9 21.3 22.6 23.3 Québec -1.3 1.3 1.3 0.8 Québec City 15.4 16.1 17.3 17.9 Québec City -1.2 0.7 1.2 0.6 Montréal 23.0 24.6 26.2 27.3 Montréal -1.4 1.6 1.6 1.1 ontario 26.5 31.4 34.5 35.3 ontario -0.1 4.9 3.1 0.8 Ottawa 17.8 18.8 20.0 20.5 Ottawa -1.1 1.0 1.2 0.5 Toronto 31.9 38.5 42.2 43.1 Toronto 0.4 6.6 3.7 1.0 Hamilton 22.8 26.2 28.2 29.3 Hamilton 0.2 3.4 2.0 1.2 Manitoba 17.3 18.6 19.8 20.4 Manitoba -1.1 1.3 1.2 0.6 Winnipeg 15.9 17.1 18.1 18.7 Winnipeg -1.0 1.1 1.1 0.6 sask. 17.8 18.4 19.2 19.8 sask. -1.5 0.6 0.8 0.6 Regina 18.6 19.7 20.6 21.1 Regina -1.9 1.2 0.9 0.5 Saskatoon 20.7 21.0 21.6 22.3 Saskatoon -1.5 0.3 0.6 0.7 alberta 18.2 18.9 19.5 20.0 alberta -1.9 0.7 0.6 0.5 Calgary 17.7 18.6 19.1 19.5 Calgary -1.7 1.0 0.5 0.4 Edmonton 19.8 20.4 21.1 21.7 Edmonton -1.2 0.7 0.7 0.6 B.c. 40.8 47.1 46.9 49.0 B.c. 1.4 6.3 -0.1 2.1 Vancouver 53.8 66.0 66.0 66.3 Vancouver 1.9 12.2 0.0 0.4 Victoria 36.1 41.2 42.5 43.8 Victoria -1.1 5.1 1.3 1.3 Source: Canadian Real Estate Association, Statistics Canada taBle 5: HoMe aFFordaBIlIty* Per cent Per cent change * Mortgage payment as % of average household income, average home price, 25% downpayment, 25-year amortization and 5-year fixed posted rate. **Insufficient Data F. by TD Economics as of August 2016 *Insufficient Data
- 13. TD Economics | www.td.com/economics 13August 30, 2016 2015 2016F 2017F 2018F 2015 2016F 2017F 2018F canada 5.7 6.2 5.9 5.8 canada 0.3 0.4 -0.2 -0.1 n. & l. 4.2 3.7 3.6 3.5 n. & l. -0.2 -0.4 -0.2 -0.1 St. John's* -- -- -- -- St. John's* -- -- -- -- P.e.I. 2.8 2.9 2.9 2.9 P.e.I. -0.1 0.2 0.0 -0.1 n.s. 3.6 3.4 3.3 3.2 n.s. 0.0 -0.2 -0.1 -0.1 Halifax 3.8 3.7 3.7 3.6 Halifax 0.0 -0.1 0.0 -0.1 n.B. 2.7 2.7 2.7 2.7 n.B. -0.1 0.0 0.0 0.0 Saint John 2.8 2.8 2.7 2.7 Saint John -0.2 0.0 0.0 0.0 Québec 4.4 4.3 4.2 4.2 Québec -0.1 0.0 -0.1 -0.1 Québec City 3.4 3.3 3.3 3.2 Québec City -0.1 -0.1 0.0 -0.1 Montréal 5.0 5.0 4.9 4.9 Montréal -0.1 0.0 -0.1 0.0 ontario 5.8 6.4 6.5 6.3 ontario 0.3 0.6 0.1 -0.2 Ottawa 3.9 3.8 3.8 3.7 Ottawa -0.1 -0.1 0.0 -0.1 Toronto 7.0 7.8 7.9 7.7 Toronto 0.4 0.8 0.1 -0.2 Hamilton 5.0 5.3 5.3 5.3 Hamilton 0.3 0.3 0.0 0.0 Manitoba 3.8 3.8 3.7 3.7 Manitoba -0.1 0.0 -0.1 -0.1 Winnipeg 3.5 3.5 3.4 3.4 Winnipeg -0.1 0.0 0.0 -0.1 sask. 3.9 3.7 3.6 3.6 sask. -0.1 -0.2 -0.1 -0.1 Regina 4.1 4.0 3.9 3.8 Regina -0.2 0.0 -0.1 -0.1 Saskatoon 4.5 4.3 4.1 4.0 Saskatoon -0.1 -0.3 -0.2 -0.1 alberta 4.0 3.8 3.7 3.6 alberta -0.2 -0.1 -0.2 -0.1 Calgary 3.9 3.8 3.6 3.5 Calgary -0.2 -0.1 -0.2 -0.1 Edmonton 4.3 4.2 4.0 3.9 Edmonton -0.1 -0.2 -0.2 -0.1 B.c. 8.9 9.6 8.8 8.8 B.c. 0.7 0.6 -0.7 0.0 Vancouver 11.8 13.4 12.4 11.9 Vancouver 0.9 1.6 -1.0 -0.5 Victoria 7.9 8.4 8.0 7.9 Victoria 0.1 0.5 -0.4 -0.1 F. by TD Economics as of August 2016 Source: Canadian Real Estate Association, Statistics Canada taBle 6: PrIce-to-IncoMe ratIo Level Per cent change *Insufficient Data
- 14. TD Economics | www.td.com/economics 14August 30, 2016 This report is provided by TD Economics. It is for informational and educational purposes only as of the date of writing, and may not be appropriate for other purposes. The views and opinions expressed may change at any time based on market or other conditions and may not come to pass. This material is not intended to be relied upon as investment advice or recommendations, does not constitute a solicitation to buy or sell securities and should not be considered specific legal, investment or tax advice. The report does not provide material information about the business and affairs of TD Bank Group and the members of TD Economics are not spokespersons for TD Bank Group with respect to its business and affairs. The information contained in this report has been drawn from sources believed to be reliable, but is not guaranteed to be accurate or complete. This report contains economic analysis and views, including about future economic and financial markets performance. These are based on certain assumptions and other factors, and are subject to inherent risks and uncertainties. The actual outcome may be materially different. The Toronto-Dominion Bank and its affiliates and related entities that comprise the TD Bank Group are not liable for any errors or omissions in the information, analysis or views contained in this report, or for any loss or damage suffered.