In CBO’s projections, economic output is expected to grow by 2.3 percent in 2019, supporting strong labor market conditions that feature low unemployment and rising wages. After 2019, economic growth averages 1.8 percent per year, which is less than the historical average.
CBO estimates that the federal budget deficit for 2019 will be $960 billion. Under current law, budget deficits are projected to average $1.2 trillion a year between 2020 and 2029, boosting debt held by the public to 95 percent of GDP in that year—its highest level since just after World War II.
Since 2007, federal debt held by the public has more than doubled in relation to the size of the economy, and it will keep growing significantly if the large annual budget deficits projected under current law come to pass. The Congress faces an array of policy choices as it confronts the challenges posed by such large and growing debt.
Fitch affirms south africa at 'bb+'; outlook stableSABC News
South Africa's ratings are weighed down by low trend growth, sizeable government debt and contingent liabilities and deteriorating governance standards. These weaknesses are balanced by a favourable government debt structure, deep local capital markets and a flexible exchange rate that helps to absorb external shocks. The affirmation reflects that while a number of developments point to a weaker fiscal outlook and consequent faster pace of debt accumulation, potential fiscal consolidation measures after the ANC's elective conference in December could mitigate those trends. Additionally, GDP growth could recover more strongly than currently anticipated if the outcome of the conference is viewed favourably by consumers and businesses.
CBO uses several models to analyze the effects of fiscal policy. In CBO’s view, changes in fiscal policy affect the economy in both the short and long term:
Short-term effects are driven by changes in the demand for goods and services (such as consumption and investment) and changes in supply-side factors (such as growth in productivity and the supply of labor), as well as by the interactions between them.
Long-term effects are primarily driven by changes in supply-side factors such as national saving, productivity, and people’s incentives to work, save, and invest.
The life-cycle growth model (also called an overlapping-generations, or OLG, model) is one model that CBO uses to estimate the long-term effects of changes in fiscal policy. CBO uses the model to analyze the effects of fiscal policy on the following:
People’s incentives to work and save; the distribution of income, wealth, consumption, and taxes across households; and
the well-being of different generations of households.
The life-cycle growth model is one model that CBO uses to estimate the long-term effects of changes in fiscal policy. For example, the model can analyze the effects of changes to the Social Security system.
CBO projects a 2019 deficit of $897 billion, equaling 4.2 percent of gross domestic product (GDP). The projected shortfall (adjusted to exclude the effects of shifts in the timing of certain payments) grows to 4.7 percent of GDP in 2029. Federal debt held by the public is projected to reach $16.6 trillion at the end of 2019. That amount would equal 78 percent of GDP—nearly twice its average over the past 50 years. Debt is estimated to reach $28.7 trillion, or 93 percent of GDP, by 2029, a larger amount than at any time since just after World War II. It would continue to grow after 2029, reaching about 150 percent of GDP by 2049.
The fourth quarter of 2012 brought an abundance of angst and speculation surrounding how, and
when, Congress might resolve its ongoing battle over fiscal policy. As investors worried about the
impact of the tax and spending provisions the Budget Control Act of 2011 would have on an already
fragile economy, Congress showed little inclination to reach a bi-partisan compromise. For more info: www.nafcu.org/nifcus
Presentation by Ben Page, CBO's Fiscal Policy Studies Unit Chief, at the National Tax Association 108th Annual Conference on Taxation.
CBO’s long-term budget projections generally reflect current law and estimates of future economic conditions and demographic trends. Those projections depend on estimates of the future paths of mortality rates, productivity, interest rates, and health care costs, among many other variables. To illustrate some of the uncertainty about long-term budgetary outcomes, CBO constructed alternative projections showing what would happen to the budget if those factors differed from the values used in the extended baseline.
Presentation by Wendy Edelberg, an Associate Director for Economic Analysis at CBO, at the National Bureau of Economic Research conference, Economics of Infrastructure Investment.
Federal investment in physical capital, education, and research and development boosts private-sector productivity gradually, CBO estimates. The overall macroeconomic and budgetary effects of federal investment depend on how that spending is financed.
Presentation by Wendy Edelberg, an Associate Director for Economic Analysis at CBO, at the Seminar on Forecasting at George Washington University.
Under current law, CBO projects that economic activity will expand at a modest pace this year and then grow more slowly in subsequent years.
Presentation by Xiaotong Niu, an analyst in CBO's Health, Retirement, and Long-Term Analysis Division, at the Biennial Conference of the American Society of Health Economists.
The consequences of any change to Medicare for different socioeconomic groups depend on the distribution of taxes paid to and benefits received from the current system by each group. However, only a few studies have estimated that distribution, and they offer conflicting views. This presentation describes an analysis of the distribution of Medicare taxes and spending using a unique dataset with information on beneficiaries’ lifetime earnings and Medicare spending. The dataset includes more recent cohorts of beneficiaries than earlier studies, and the distribution of Medicare taxes and spending is projected based on demographic and economic projections from CBO’s long-term microsimulation model.
The Medicare system is progressive. For people born in the 1950s, lifetime Medicare spending net of both premiums and dedicated Medicare taxes, as a share of lifetime earnings, tends to be lower for beneficiaries with higher lifetime household earnings. Almost all of the variation in lifetime Medicare spending net of premiums by lifetime household earnings can be explained by the variation in life expectancy. Medicare is projected to become more progressive for later cohorts because lifetime earnings are expected to grow faster for those with higher earnings.
Most recently, the strengthening economy has improved the budgetary outlooks of most state and local governments, leading them to reduce their pace of fiscal tightening. At the same time, though, fiscal policy at the federal level has become significantly more restrictive. In particular, the expiration of the payroll tax cut, the enactment of tax increases, the effects of the budget caps on discretionary spending, the onset of the sequestration, and the declines in defense spending for overseas military operations are expected, collectively, to exert a substantial drag on the economy this year. The Congressional Budget Office (CBO) estimates that the deficit reduction policies in current law will slow the pace of real GDP growth by about 1-1/2 percentage points during 2013, relative to what it would have been otherwise.
A comprehensive fiscal analysis of the policies put forward by presidential candidates Donald Trump and Hillary Clinton. It shows how each would affect the federal budget and national debt. See more at http://crfb.org/.
In 2020, CBO estimates a deficit of $1.0 trillion, or 4.6 percent of gross domestic product (GDP). Under current law, the projected gap between outlays and revenues increases to 5.4 percent of GDP in 2030. Federal debt held by the public is projected to rise over the coming decade, from 81 percent of GDP in 2020 to 98 percent of GDP in 2030. It continues to grow thereafter, in CBO’s projections, reaching 180 percent of GDP in 2050, well above the highest level ever recorded in the United States.
This presentation provides an overview of the Congressional Budget Office’s most recent budget and economic projections, which were published on August 21. In those projections, the federal budget deficit is nearly $1 trillion in 2019 and averages $1.2 trillion each year between 2020 and 2029. Because of persistently large deficits, federal debt held by the public is projected to grow steadily, reaching 95 percent of gross domestic product (GDP) in 2029.
Real GDP is projected to grow by 2.3 percent in 2019, supporting strong labor market conditions that feature low unemployment and rising wages. Economic growth is projected to slow to an average of 1.8 percent through 2029, which is less than the long-term historical average. That slowdown occurs primarily because the labor force is expected to grow more slowly than it has in the past.
Presentation by Keith Hall, CBO Director, to the National Association for Business Economics.
In fiscal year 2016, for the first time since 2009, the federal budget deficit increased in relation to the nation’s economic output. The Congressional Budget Office projects that over the next decade, if current laws remained generally unchanged, budget deficits would eventually follow an upward trajectory—the result of strong growth in spending for retirement and health care programs targeted to older people and rising interest payments on the government’s debt, accompanied by only modest growth in revenue collections. Those accumulating deficits would drive debt held by the public from its already high level up to its highest percentage of gross domestic product (GDP) since shortly after World War II.
CBO’s estimate of the deficit for 2017 has decreased since August 2016, when the agency issued its previous estimates, primarily because mandatory spending is expected to be lower than earlier anticipated. However, the current projection for the cumulative deficit for the 2017–2026 period is about the same as that reported in August.
CBO’s economic forecast—which underlies its budget projections—indicates that under current law, economic growth over the next two years would remain close to the modest rate observed since the end of the recession in 2009. Nevertheless, economic growth would continue to outpace growth in potential (maximum sustainable) GDP and thus continue to reduce the amount of underused resources, or slack, in the economy. The result would be increases in hiring, employment, and wages, along with upward pressure on inflation and interest rates. In the later part of the 10-year projection period, output growth would be constrained by a relatively slow increase in the nation’s supply of labor.
Missed out on the Union Budget 2017 Presentation?
Indian Finance Minister, Mr. Arun Jaitely has once again taken the nation by wave with his pro-poor, pro-growth, pro-middle class, pro-youth & paradigm shifting Budget. Read the highlights of the Budget here.
Norman Bergrun, RIMGMAKERS OF SATURN, SATURN.
Norman Bergrun is a scientist/engineer who worked in an above top secret capacity (his level of clearance, way above the President) for Lockheed. Prior to that he was at NACA a precursor to NASA.
Upon leaving Lockheed, he wrote “Ringmakers of Saturn” about the enormous craft spotted in the rings of Saturn and became something of an outcast in the scientific community. This interview covers his views on time travel, the nature of the vehicles that he says are creating the rings and much more… His conclusion is that the Ringmakers of Saturn are now creating rings around other planets and they are on their way here….
Groundbreaking and a real wake-up call for the mainstream scientific community not to mention the World.
La informacion mas completa de Mexico, Oaxaca y la Costa chica. Denuncian corrupción en venta de predios en Chacahua; área protegida en peligro. Con gas lacrimógeno, impide policía ingresar a Sección 22 al zócalo de Oaxaca.
Plan pour la paix: Pour un renouveau des relations internationalesFlorian Brunner
Dans son Appel du 18 Juin 1940, le Général De Gaulle avait lancé cette affirmation restée légendaire : « Quoi qu'il arrive, la flamme de la résistance française ne doit pas s'éteindre et ne s'éteindra pas. ». Nous devons aujourd’hui continuer à porter cette flamme, à défendre la paix et la liberté, dans un monde ébranlé et mouvant. Après 1945, nous avons créé en Europe, les conditions d’une stabilité durable. Le Prix Nobel de la Paix 2012 avait récompensé l’Union européenne, qui avait su favoriser la construction d’un espace uni et apaisé. Mais si nous avons su associer les peuples européens, nous manquons désormais de résolution pour enrayer le cycle terrible des guerres. Nous devons être portés, par une nouvelle ambition pour la paix. Notre vocation n’est pas de nous aligner, mais d’agir en toute indépendance, au service d’une vision partagée. Alors que le monde semble se perdre, dans une logique de conflits incessants, dont les ficelles sont tirées par des acteurs influents et empressés. Alors que de grands empires activent tous leurs leviers d’influence et d’action, dans une course machinale à la puissance. Alors que l’aventurisme généralisé, paralyse l’expression des intelligences et la recherche d’un véritable sens. Il est temps que la France assume son rôle et son message. Il est temps que l’Union européenne se dote des moyens nécessaires à la conduite d’une véritable action universelle. Il faut une Europe politique, qui s’affirme sur la scène internationale. Il n’y a que l’Europe pour devenir le point d’équilibre d’un nouvel ordre mondial. La France a un rôle déterminant à jouer, dans la construction d’une nouvelle architecture européenne. Elle a aussi une place qui compte dans les relations internationales. C’est à la France et à l’Europe de se remettre en mouvement, pour faire bouger les lignes. Reprendre l’initiative, ouvrir le dialogue, être une force motrice pour l’instauration de la paix. Voilà ce doivent être nos résolutions. Nous ne pouvons plus rester figés dans des schémas dépassés, nous devons recouvrer notre capacité à inventer et à innover. Retrouvons le sens de l’Histoire et portons une véritable vision, au service de la paix et de la réconciliation.
El comercio de bienes actual del Perú con la India es menor pero esta creciendo
La inversión de la India en el Perú también muestra signos de aumentar
En junio próximo deben iniciarse en Lima las negociaciones para alcanzar un acuerdo comercial con la India, que abarcaría temas como “aranceles, medidas sanitarias y fitosanitarias, obstáculos técnicos al comercio, inversiones, comercio de servicios, movimiento de personas, cooperación, entre otros“
Discover what services we offer here at MagenTys, from BDD and DevOps to Agility Assessments. If you would like to find out more, visit www.magentys.io
San Joaquin Delta
Community College District
Office of Fiscal Services
5151 Pacific Avenue
Stockton, CA 95207
TO: Board of Trustees
Jeff Marsee Ph.D, Superintendent/President
District Leadership
FROM: Michael Hill, Administrative Consultant
Raquel Puentes-Griffith, Controller
SUBJECT: 2011-12 Adoption Budget
The budget development process has been much smoother this year than last. As you will see from the
presentation materials the changes from tentative to adoption are smaller in number and less dramatic
than 2010-2011. This is a more typical pattern for the unrestricted general fund portion of the budget.
The heavy lifting is normally done in preparation for the tentative budget. We do place added emphasis
on the restricted funds moving from the tentative to adoption budgets.
For the restricted funds there are no major surprises and with the effort made during this last year by the
fiscal services staff and program managers the restricted funds budgets are cleaner and reflect more
clearly the true status of programs.
Regarding the unrestricted general fund we are pleased to report that there is some revenue improvement
as a result of the state budget that was adopted but at the same time our estimate of the beginning fund
balance turned out to be higher than the actual results. We will expand on these points in this
memorandum.
We also want to provide you with a sense of what the current circumstance means for the 2012-2013
fiscal year. It has been the district strategy to approach the state funding loss in a multi-year plan and the
2011-12 budget represents the first year of the plan.
State Budget
The state budget had to confront a shortfall of $26 billion. About $13 billion was addressed back in
March through reduced funding of programs, the community colleges included. This became the best
case scenario in the evaluative process. Facing more cuts to close the gap for the remaining $13 billion,
extending taxes or a combination of both, the legislature and governor could not reach agreement on how
to proceed. The process bogged down in the usual political way.
The “May Revise” is that point where the state measures revenue flows and makes adjustments to the
revenue estimates for the next year. When that measurement occurred it was determined that the revenue
estimates could be increased which covered a portion of the $13 billion gap. In the final days of June to
get the budget out the door the revenue estimates were increased further but because there was a sense the
numbers were soft and unlikely to materialize, triggers were incorporated which would impose mid-year
cuts. The trigger date for making the determination is December 15, 2011. The triggers are as follows:
Tier 0
If between $3 and $4 billion of the new revenue materializes, no ad.
San Joaquin Delta
Community College District
Office of Fiscal Services
5151 Pacific Avenue
Stockton, CA 95207
TO: Board of Trustees
Jeff Marsee Ph.D, Superintendent/President
District Leadership
FROM: Michael Hill, Administrative Consultant
Raquel Puentes-Griffith, Controller
SUBJECT: 2011-12 Adoption Budget
The budget development process has been much smoother this year than last. As you will see from the
presentation materials the changes from tentative to adoption are smaller in number and less dramatic
than 2010-2011. This is a more typical pattern for the unrestricted general fund portion of the budget.
The heavy lifting is normally done in preparation for the tentative budget. We do place added emphasis
on the restricted funds moving from the tentative to adoption budgets.
For the restricted funds there are no major surprises and with the effort made during this last year by the
fiscal services staff and program managers the restricted funds budgets are cleaner and reflect more
clearly the true status of programs.
Regarding the unrestricted general fund we are pleased to report that there is some revenue improvement
as a result of the state budget that was adopted but at the same time our estimate of the beginning fund
balance turned out to be higher than the actual results. We will expand on these points in this
memorandum.
We also want to provide you with a sense of what the current circumstance means for the 2012-2013
fiscal year. It has been the district strategy to approach the state funding loss in a multi-year plan and the
2011-12 budget represents the first year of the plan.
State Budget
The state budget had to confront a shortfall of $26 billion. About $13 billion was addressed back in
March through reduced funding of programs, the community colleges included. This became the best
case scenario in the evaluative process. Facing more cuts to close the gap for the remaining $13 billion,
extending taxes or a combination of both, the legislature and governor could not reach agreement on how
to proceed. The process bogged down in the usual political way.
The “May Revise” is that point where the state measures revenue flows and makes adjustments to the
revenue estimates for the next year. When that measurement occurred it was determined that the revenue
estimates could be increased which covered a portion of the $13 billion gap. In the final days of June to
get the budget out the door the revenue estimates were increased further but because there was a sense the
numbers were soft and unlikely to materialize, triggers were incorporated which would impose mid-year
cuts. The trigger date for making the determination is December 15, 2011. The triggers are as follows:
Tier 0
If between $3 and $4 billion of the new revenue materializes, no ad ...
Presentation by Christina Hawley Anthony, Robert Arnold, and Joshua Shakin, CBO Unit Chiefs, at a joint seminar by CBO and the Congressional Research Service.
Moving Michigan Forward - Investing in Our Future.
Michigan House Republicans unveil plan to balance state budget through cuts, reforms, no tax increases
http://www.mlive.com/news/grand-rapids/index.ssf/2009/07/michigan_house_republicans_unv.html
Rarely has there been more uncertainty regarding the course of the public finances over the next five years. In this note we aim to answer some of the big questions for the economy in light of the 2021 budget.
Laurentian Bank Securities - Economic Research and Strategy Mark MacIsaac
Quebec Fiscal Update: Additional tax relief for individuals without compromising debt reduction.
The fiscal update unveiled in Quebec City on November 21st could be appropriately dubbed a responsible mini-budget.
The Union Finance Minister Shri Arun Jaitley tabled the Economic Survey 2016-17 today, the first day of the Budget Session of the Parliament. The Economic Survey says that the adverse impact of demonetisation on GDP growth will be transitional and the economy will recover with remonetisation. The Survey states that once the cash supply is replenished, which is likely to be achieved by end of March 2017, the economy would revert to normal. The GDP growth in 2017-18, as per the survey, is projected to be in the range of 6¾-7½ percent.
The Survey suggests a few measures to maximise long-term benefits and minimise short-term costs. One, fast remonetisation and early elimination of withdrawal limits. This would reduce GDP growth deceleration and cash hoarding. Two, continued impetus to digitalisation while ensuring that this transition is gradual and inclusive, and appropriately balances the costs and benefits of cash versus digitalisation. Three, following up demonetisation by bringing land and real estate into the GST. Four, reducing tax rates and stamp duties.
This is an analysis and brief overview document on the Survey
India Economic Survey 2017 by Edelman IndiaAklanta Kalita
The Union Finance Minister Shri Arun Jaitley tabled the Economic Survey 2016-17 today, the first day of the Budget Session of the Parliament. The Economic Survey says that the adverse impact of demonetisation on GDP growth will be transitional and the economy will recover with remonetisation. The Survey states that once the cash supply is replenished, which is likely to be achieved by end of March 2017, the economy would revert to normal. The GDP growth in 2017-18, as per the survey, is projected to be in the range of 6¾-7½ percent.
The Survey suggests a few measures to maximise long-term benefits and minimise short-term costs. One, fast remonetisation and early elimination of withdrawal limits. This would reduce GDP growth deceleration and cash hoarding. Two, continued impetus to digitalisation while ensuring that this transition is gradual and inclusive, and appropriately balances the costs and benefits of cash versus digitalisation. Three, following up demonetisation by bringing land and real estate into the GST. Four, reducing tax rates and stamp duties.
Presentation by Wendy Edelberg, an Associate Director for Economic Analysis at CBO, at the Brookings Institution’s Hutchins Center on Fiscal and Monetary Policy.
Revenues and spending as a share of economic output have varied over business cycles as a result of both changes in legislation and automatic stabilizers. Automatic stabilizers are the automatic increases in revenues and decreases in outlays in the federal budget that occur when the economy strengthens, and the opposite changes that occur when the economy weakens.
In this issue:
1. TD Wealth Asset Allocation Committee: Market outlook: the year ahead
2. TD Economics: A foundation for uncertain times
3. TD Wealth: New principal residence exemption rules
Inside This Issue:
• Certainty in an Age of Uncertainty
• Happy 60th Birthday, RSP!
• Teaching Kids About Money
• The Value of Dividend-Paying Equities
• In Brief: Housing Market Changes
• Elder Care: Planning Ahead
We expect the Bank of Canada to keep its overnight
rate unchanged at 0.50% next week.
The Bank is likely to echo its recent statements that the downside risks to inflation have increased, leading to an overall dovish tone to the statement and accompanying Monetary Policy Report. We expect the Bank to remain on the sidelines until 2019.
Recent fiscal and macroprudential policies have helped ease some of the pressure off the Bank of Canada, with last week’s new housing sector measures removing some of the downside risks from household imbalances.
In this edition of Return On Investment, we have included information on the following topics:
1. The Importance of Risk Control
2. Are You Nearing the Age of 71?
3. Pension Reform: The CPP is Set to Change
4. Transferring Wealth: Preparing Your Heirs
5. Unclaimed Balances: Are Funds Owed to You?
6. Year-End Tax Planning Considerations
1. Time: A most Valuable Asset
2. Federal Budget 2016: A Recap
3. Perspective: A Story of Bulls and Bears
4. The Big Picture: Beneficiary Designations
5. How are my Dividends Taxed?
6. Understanding the Fees You Pay
The Bank of Canada today announced that it is maintaining its target for the overnight rate at 1/2 per cent. The Bank Rate is correspondingly 3/4 per cent and the deposit rate is 1/4 per cent.
The global economy is evolving largely as the Bank projected in its April Monetary Policy Report (MPR). In the United States, despite weakness in the first quarter, a number of indicators, including employment, point to a return to solid growth in 2016. Financial conditions remain accommodative, with ongoing geopolitical factors contributing to fragile market sentiment. Oil prices are higher, in part because of short-term supply disruptions.
In Canada, the economy’s structural adjustment to the oil price shock continues, but is proving to be uneven. Growth in the first quarter of 2016 appears to be in line with the Bank’s April projection, although business investment and intentions remain disappointing. The second quarter will be much weaker than predicted because of the devastating Alberta wildfires. The Bank’s preliminary assessment is that fire-related destruction and the associated halt to oil production will cut about 1 1/4 percentage points off real GDP growth in the second quarter. The economy is expected to rebound in the third quarter, as oil production resumes and reconstruction begins. While the Canadian dollar has been fluctuating in response to shifting expectations of US monetary policy and higher oil prices, it is now close to the level assumed in April.
Inflation is roughly in line with the Bank’s expectations. Total CPI inflation has risen recently, largely due to movements in gasoline prices, but remains slightly below the 2 per cent target. Measures of core inflation remain close to 2 per cent, reflecting the offsetting influences of past exchange rate depreciation and excess capacity.
Canada’s housing market continues to display strong regional divergences, reinforced by the complex adjustment underway in the economy. In this context, household vulnerabilities have moved higher. Meanwhile, the risks to the Bank’s inflation projection remain roughly balanced. Therefore, the Bank’s Governing Council judges that the current stance of monetary policy is still appropriate, and the target for the overnight rate remains at 1/2 per cent.
In this issue:
TD Wealth: Developing a roadmap for success
TD Economics: Oil prices remain a wild card for Canada’s outlook
TD Wealth Asset Allocation Committee: Market Outlook
The European Unemployment Puzzle: implications from population agingGRAPE
We study the link between the evolving age structure of the working population and unemployment. We build a large new Keynesian OLG model with a realistic age structure, labor market frictions, sticky prices, and aggregate shocks. Once calibrated to the European economy, we quantify the extent to which demographic changes over the last three decades have contributed to the decline of the unemployment rate. Our findings yield important implications for the future evolution of unemployment given the anticipated further aging of the working population in Europe. We also quantify the implications for optimal monetary policy: lowering inflation volatility becomes less costly in terms of GDP and unemployment volatility, which hints that optimal monetary policy may be more hawkish in an aging society. Finally, our results also propose a partial reversal of the European-US unemployment puzzle due to the fact that the share of young workers is expected to remain robust in the US.
BYD SWOT Analysis and In-Depth Insights 2024.pptxmikemetalprod
Indepth analysis of the BYD 2024
BYD (Build Your Dreams) is a Chinese automaker and battery manufacturer that has snowballed over the past two decades to become a significant player in electric vehicles and global clean energy technology.
This SWOT analysis examines BYD's strengths, weaknesses, opportunities, and threats as it competes in the fast-changing automotive and energy storage industries.
Founded in 1995 and headquartered in Shenzhen, BYD started as a battery company before expanding into automobiles in the early 2000s.
Initially manufacturing gasoline-powered vehicles, BYD focused on plug-in hybrid and fully electric vehicles, leveraging its expertise in battery technology.
Today, BYD is the world’s largest electric vehicle manufacturer, delivering over 1.2 million electric cars globally. The company also produces electric buses, trucks, forklifts, and rail transit.
On the energy side, BYD is a major supplier of rechargeable batteries for cell phones, laptops, electric vehicles, and energy storage systems.
how to sell pi coins effectively (from 50 - 100k pi)DOT TECH
Anywhere in the world, including Africa, America, and Europe, you can sell Pi Network Coins online and receive cash through online payment options.
Pi has not yet been launched on any exchange because we are currently using the confined Mainnet. The planned launch date for Pi is June 28, 2026.
Reselling to investors who want to hold until the mainnet launch in 2026 is currently the sole way to sell.
Consequently, right now. All you need to do is select the right pi network provider.
Who is a pi merchant?
An individual who buys coins from miners on the pi network and resells them to investors hoping to hang onto them until the mainnet is launched is known as a pi merchant.
debuts.
I'll provide you the Telegram username
@Pi_vendor_247
If you are looking for a pi coin investor. Then look no further because I have the right one he is a pi vendor (he buy and resell to whales in China). I met him on a crypto conference and ever since I and my friends have sold more than 10k pi coins to him And he bought all and still want more. I will drop his telegram handle below just send him a message.
@Pi_vendor_247
what is the future of Pi Network currency.DOT TECH
The future of the Pi cryptocurrency is uncertain, and its success will depend on several factors. Pi is a relatively new cryptocurrency that aims to be user-friendly and accessible to a wide audience. Here are a few key considerations for its future:
Message: @Pi_vendor_247 on telegram if u want to sell PI COINS.
1. Mainnet Launch: As of my last knowledge update in January 2022, Pi was still in the testnet phase. Its success will depend on a successful transition to a mainnet, where actual transactions can take place.
2. User Adoption: Pi's success will be closely tied to user adoption. The more users who join the network and actively participate, the stronger the ecosystem can become.
3. Utility and Use Cases: For a cryptocurrency to thrive, it must offer utility and practical use cases. The Pi team has talked about various applications, including peer-to-peer transactions, smart contracts, and more. The development and implementation of these features will be essential.
4. Regulatory Environment: The regulatory environment for cryptocurrencies is evolving globally. How Pi navigates and complies with regulations in various jurisdictions will significantly impact its future.
5. Technology Development: The Pi network must continue to develop and improve its technology, security, and scalability to compete with established cryptocurrencies.
6. Community Engagement: The Pi community plays a critical role in its future. Engaged users can help build trust and grow the network.
7. Monetization and Sustainability: The Pi team's monetization strategy, such as fees, partnerships, or other revenue sources, will affect its long-term sustainability.
It's essential to approach Pi or any new cryptocurrency with caution and conduct due diligence. Cryptocurrency investments involve risks, and potential rewards can be uncertain. The success and future of Pi will depend on the collective efforts of its team, community, and the broader cryptocurrency market dynamics. It's advisable to stay updated on Pi's development and follow any updates from the official Pi Network website or announcements from the team.
How to get verified on Coinbase Account?_.docxBuy bitget
t's important to note that buying verified Coinbase accounts is not recommended and may violate Coinbase's terms of service. Instead of searching to "buy verified Coinbase accounts," follow the proper steps to verify your own account to ensure compliance and security.
what is the best method to sell pi coins in 2024DOT TECH
The best way to sell your pi coins safely is trading with an exchange..but since pi is not launched in any exchange, and second option is through a VERIFIED pi merchant.
Who is a pi merchant?
A pi merchant is someone who buys pi coins from miners and pioneers and resell them to Investors looking forward to hold massive amounts before mainnet launch in 2026.
I will leave the telegram contact of my personal pi merchant to trade pi coins with.
@Pi_vendor_247
What website can I sell pi coins securely.DOT TECH
Currently there are no website or exchange that allow buying or selling of pi coins..
But you can still easily sell pi coins, by reselling it to exchanges/crypto whales interested in holding thousands of pi coins before the mainnet launch.
Who is a pi merchant?
A pi merchant is someone who buys pi coins from miners and resell to these crypto whales and holders of pi..
This is because pi network is not doing any pre-sale. The only way exchanges can get pi is by buying from miners and pi merchants stands in between the miners and the exchanges.
How can I sell my pi coins?
Selling pi coins is really easy, but first you need to migrate to mainnet wallet before you can do that. I will leave the telegram contact of my personal pi merchant to trade with.
Tele-gram.
@Pi_vendor_247
Empowering the Unbanked: The Vital Role of NBFCs in Promoting Financial Inclu...Vighnesh Shashtri
In India, financial inclusion remains a critical challenge, with a significant portion of the population still unbanked. Non-Banking Financial Companies (NBFCs) have emerged as key players in bridging this gap by providing financial services to those often overlooked by traditional banking institutions. This article delves into how NBFCs are fostering financial inclusion and empowering the unbanked.
how to swap pi coins to foreign currency withdrawable.DOT TECH
As of my last update, Pi is still in the testing phase and is not tradable on any exchanges.
However, Pi Network has announced plans to launch its Testnet and Mainnet in the future, which may include listing Pi on exchanges.
The current method for selling pi coins involves exchanging them with a pi vendor who purchases pi coins for investment reasons.
If you want to sell your pi coins, reach out to a pi vendor and sell them to anyone looking to sell pi coins from any country around the globe.
Below is the contact information for my personal pi vendor.
Telegram: @Pi_vendor_247
how to sell pi coins in South Korea profitably.DOT TECH
Yes. You can sell your pi network coins in South Korea or any other country, by finding a verified pi merchant
What is a verified pi merchant?
Since pi network is not launched yet on any exchange, the only way you can sell pi coins is by selling to a verified pi merchant, and this is because pi network is not launched yet on any exchange and no pre-sale or ico offerings Is done on pi.
Since there is no pre-sale, the only way exchanges can get pi is by buying from miners. So a pi merchant facilitates these transactions by acting as a bridge for both transactions.
How can i find a pi vendor/merchant?
Well for those who haven't traded with a pi merchant or who don't already have one. I will leave the telegram id of my personal pi merchant who i trade pi with.
Tele gram: @Pi_vendor_247
#pi #sell #nigeria #pinetwork #picoins #sellpi #Nigerian #tradepi #pinetworkcoins #sellmypi
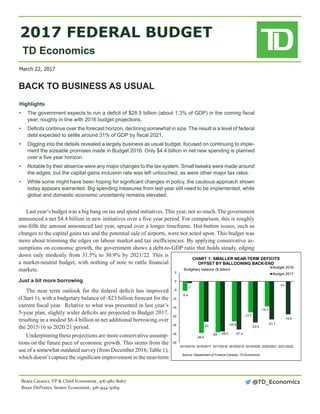
1. 2017 FEDERAL BUDGET
TD Economics
Last year’s budget was a big bang on tax and spend initiatives. This year, not so much. The government
announced a net $4.4 billion in new initiatives over a five year period. For comparison, this is roughly
one-fifth the amount announced last year, spread over a longer timeframe. Hot-button issues, such as
changes to the capital gains tax and the potential sale of airports, were not acted upon. This budget was
more about trimming the edges on labour market and tax inefficiencies. By applying conservative as-
sumptions on economic growth, the government shows a debt-to-GDP ratio that holds steady, edging
down only modestly from 31.5% to 30.9% by 2021/22. This is
a market-neutral budget, with nothing of note to rattle financial
markets.
Just a bit more borrowing
The near term outlook for the federal deficit has improved
(Chart 1), with a budgetary balance of -$23 billion forecast for the
current fiscal year. Relative to what was presented in last year’s
5-year plan, slightly wider deficits are projected in Budget 2017,
resulting in a modest $6.4 billion in net additional borrowing over
the 2015/16 to 2020/21 period.
Underpinning these projections are more conservative assump-
tions on the future pace of economic growth. This stems from the
use of a somewhat outdated survey (from December 2016; Table 1),
which doesn’t capture the significant improvement in the near-term
BACK TO BUSINESS AS USUAL
Highlights
• The government expects to run a deficit of $28.5 billion (about 1.3% of GDP) in the coming fiscal
year, roughly in line with 2016 budget projections.
• Deficits continue over the forecast horizon, declining somewhat in size. The result is a level of federal
debt expected to settle around 31% of GDP by fiscal 2021.
• Digging into the details revealed a largely business as usual budget, focused on continuing to imple-
ment the sizeable promises made in Budget 2016. Only $4.4 billion in net new spending is planned
over a five year horizon.
• Notable by their absence were any major changes to the tax system. Small tweaks were made around
the edges, but the capital gains inclusion rate was left untouched, as were other major tax rates.
• While some might have been hoping for significant changes in policy, the cautious approach shown
today appears warranted. Big spending measures from last year still need to be implemented, while
global and domestic economic uncertainty remains elevated.
March 22, 2017
Beata Caranci, VP & Chief Economist, 416-982-8067
Brian DePratto, Senior Economist, 416-944-5069
@TD_Economics
-5.4
-29.4
-29
-22.8
-17.7
-14.3
-1
-23
-28.5 -27.4
-23.4
-21.7
-18.8
-35
-30
-25
-20
-15
-10
-5
0
5
2015/2016 2016/2017 2017/2018 2018/2019 2019/2020 2020/2021 2021/2022
CHART 1: SMALLER NEAR-TERM DEFICITS
OFFSET BY BALLOONING BACK-END
Budget 2016
Budget 2017
Source: Department of Finance Canada, TD Economics.
Budgetary balance ($ billion)
N/A
2. TD Economics | www.td.com/economics
2March 22, 2017
economic outlook, and thus likely overstates the near-term
deficit outlook. Conversely, the December survey does ap-
pear to better reflect the medium-term growth headwinds
facing Canada, presenting a lower long-term growth profile
than that used in Budget 2016.
Even this slower profile does not fully reflect the longer-
term headwinds facing Canada. TD Economics remains
of the view that growth is likely to trend closer to 1.4% in
coming years, creating a potential fiscal headwind. Perhaps
reflecting this, the government has reintroduced a ‘risk ad-
justment’, adding $3 billion per year to the projected deficit
from fiscal 2017/18 onwards. This, in combination with the
government’s growth outlook, suggests that near-term defi-
cits may come in smaller than what has been indicated today.
Persistent deficits
A largely unchanged deficit outlook means that there
remains nothing but red ink on the horizon. The size of the
deficits are fairly small in the grand scheme of things, and
the federal debt-to-GDPratio is set to stabilize through time,
settling at around 31% of GDP by fiscal 2021-22 (Table 2).
Despite this, gone from today’s budget are explicit refer-
ences to a target level of the debt ratio. While the best fiscal
anchor could be debated (we would suggest a modestly
declining debt-to-GDP ratio as a reasonable target), having
a fiscal anchor, whatever it may be, provides reassurances to
markets that some form of fiscal restraint is in place.Areturn
to an explicit anchor would thus be a welcome development.
Spending what was planned
Today’s budget is largely focused on implementing exist-
ing promises. The government made significant spending
commitments in key areas such as housing, but the bulk
of the funds allocated are back-end-loaded. The rubber
hits the road over the five year fiscal horizon, where only
$5.2 billion in net new spending was introduced in today’s
budget, as the impact of newly announced measures were
offset by shifting funds from other areas. For instance, the
government announced $6.6 billion in planned spending
to support skills and innovation. But, once the reshuffling
of pre-existing commitments is taken into account, the net
impact on the deficit is expected to be $2.9 billion. In some
areas, the government has actually reduced its planned
spending (on net) over the near-term horizon. These include
what the government calls “Communities Built for Change”,
such as infrastructure spending, early learning and childcare
initiatives, and indigenous communities.
When it comes to existing spending commitments, the
government provided an indication of progress to date.
Most major areas are reported to be largely on track (in
terms of Budget 2016 commitments), with the exception of
infrastructure spending, where only 50% to 75% of projects
are reported to be on track. From an economic growth per-
spective, even this statistic may be somewhat misleading,
as it tracks cash disbursements, not shovels in the ground.
Indeed, data from Infrastructure Canada indicates that only a
smallfractionofprojectsapprovedsincethetimeoflastyear’s
budgethaveactuallybegunconstruction.ThusTDEconomics
remains of the view that the majority of the growth impact
from existing spending commitments is yet to come, and will
extend into 2018 given delays already observed.
2016-17 2017-18 2018-19 2019-20 2020-21 2021-22
Budgetary Revenues 292.1 304.7 315.6 327.7 340.3 356.0
% change -1.2 4.3 3.6 3.8 3.8 4.6
Program Expenses 290.9 305.4 313.7 319.8 328.6 338.5
% change 7.4 5.0 2.7 1.9 2.8 3.0
Public Debt Charges 24.3 24.7 26.3 28.3 30.4 33.3
% change -5.1 1.6 6.5 7.6 7.4 9.5
Total Expenditures 315.1 330.2 340.0 348.1 359.0 371.8
% change 6.3 4.8 3.0 2.4 3.1 3.6
Risk Adjustment - 3.0 3.0 3.0 3.0 3.0
Budgetary Balance -23.0 -28.5 -27.4 -23.4 -21.7 -18.8
Federal Debt 637.1 665.5 692.9 716.3 738.1 756.9
% change 3.4 4.5 4.1 3.4 3.0 2.5
Per cent of GDP
Budgetary Revenues 14.4 14.4 14.4 14.4 14.4 14.5
Program Expenses 14.4 14.5 14.3 14.1 13.9 13.8
Public Debt Charges 1.2 1.2 1.2 1.2 1.3 1.4
Budgetary Balance -1.1 -1.4 -1.2 -1.0 -0.9 -0.8
Federal Debt 31.5 31.6 31.6 31.5 31.3 30.9
Table 2: 2017 Federal Budget Forecast Summary
(C$ billion, unless otherwise specificed)
Source: Department of Finance Canada.
Calendar Year 2016 2017 2018 2019 2020 2021
Real GDP
Budget 2017 1.3 1.9 2.0 1.7 1.7 1.8
TD Forecast 1.4 2.3 1.9 1.6 1.4 1.4
Nominal GDP
Budget 2017 2.0 4.1 4.0 3.5 3.8 3.8
TD Forecast 2.1 4.7 4.0 3.6 3.4 3.5
Nominal GDP ($ billion)
Budget 2017 2,025 2,109 2,194 2,271 2,357 2,447
TD Forecast 2,027 2,123 2,207 2,286 2,365 2,447
3-Month T-Bill Rate
Budget 2017 0.5 0.6 0.9 1.4 1.8 2.3
TD Forecast 0.5 0.5 0.8 1.3 1.9 2.3
Budget 2017 1.3 1.8 1.3 2.7 3.0 3.3
TD Forecast 1.3 2.1 2.7 3.0 3.3 3.3
Table 1: Economic Assumptions for Canada
Annual, percent change (unless otherwise indicated)
10-Year Gov't Bond Yield
Source: Department of Finance Canada, TD Economics
3. TD Economics | www.td.com/economics
3March 22, 2017
Nothing comprehensive, but some tax tweaks in the
offing
The federal government had been planning a compre-
hensive tax expenditure review, but it was not to be found
in today’s budget. Nor were changes to the inclusion rate for
capital gains, or the treatment of stock option compensation.
Still, many tweaks around the edges were brought into play.
Key among these:
• Elimination of the public transit tax credit
• The tax credit for oil and gas exploration is being
tweaked to gradually decline over time, rather than
deducted immediately
• The alcohol tax will be nudged up immediately, and
continue to increase in line with the pace of consumer
inflation.
• The definition of a taxi service is to be changed such
that ridesharing services such as Uber are taxed in the
same way as traditional taxi services.
• Last year’s increase in CRA vigilance will be met with
a further budget increase aimed at cracking down on tax
evasion.
The cautious approach to the tax system shown today is
likely warranted in light of the significant uncertainty ema-
nating from south of the border. Discussions and negotia-
tions are underway that could result in significant reductions
in U.S. corporate tax burdens, impacting Canada’s current
competitive advantage. At the same time, it would have
been unusual to see significant changes around capital gains
or stock options as part of a budget focused on innovation.
Ultimately though, while caution was today’s watchword,
this is not the end of the story. It would hardly be surprising
to see the tax system revisited once there is more certainty
around Canada’s relative competitiveness on this front.
Innovation a focus
As was communicated heading into the budget, a sig-
nificant portion of the document was devoted to Canadian
innovation. Measures included funds aimed at supporting
innovation “superclusters”, the creation of a “Strategic In-
novation Fund” that consolidates and expands a number of
existing funds and initiatives, and spending to support Clean-
Tech and AgTech development. A focus was also placed
on support for skills training. A welcome development is a
change to the EI qualification system, allowing EI recipients
to pursue education without losing their EI payments.
Potential market reaction
Ahead of the budget, rumours were swirling around
potential tax changes – particularly the treatment of capital
gains. In the event, no major changes were in the offing, with
the changes that were put in place generally consisting of
minor tweaks. As a result, it is unlikely that today’s budget
will have any meaningful market impact.
The theme of minor tweaks extends to the debt manage-
ment strategy. Reflecting the modest spending commitments,
gross bond issuance is expected to reach $142 billion in fiscal
2017-18, an increase of $7 billion from the year prior. The
focus is likely to remain again on shorter-term debt (2-, 3-,
and 5-year bonds), and no changes to the target maturity
pattern or benchmark sizes are planned. There is no explicit
plan, but the government again indicated a willingness to
issue ultra-long maturity bonds on a ‘tactical’ basis.
Bottom Line
Ultimately, what the government delivered felt more like
a fiscal update than a budget. Little was on offer in terms of
new spending, while at the same time much of the concern
around significant tax changes proved misplaced. This lack
of excitement may not be a bad thing. The economic land-
scape remains shrouded by uncertainty, presenting a strong
case for today’s wait and see approach.
4. TD Economics | www.td.com/economics
4March 22, 2017
This report is provided by TD Economics. It is for informational and educational purposes only as of the date of writing, and may not be
appropriate for other purposes. The views and opinions expressed may change at any time based on market or other conditions and
may not come to pass. This material is not intended to be relied upon as investment advice or recommendations, does not constitute a
solicitation to buy or sell securities and should not be considered specific legal, investment or tax advice. The report does not provide
material information about the business and affairs of TD Bank Group and the members of TD Economics are not spokespersons for TD
Bank Group with respect to its business and affairs. The information contained in this report has been drawn from sources believed to
be reliable, but is not guaranteed to be accurate or complete. This report contains economic analysis and views, including about future
economic and financial markets performance. These are based on certain assumptions and other factors, and are subject to inherent
risks and uncertainties. The actual outcome may be materially different. The Toronto-Dominion Bank and its affiliates and related entities
that comprise the TD Bank Group are not liable for any errors or omissions in the information, analysis or views contained in this report,
or for any loss or damage suffered.