Download as PDF, PPTX


![The shift from cost and speed to business performance
“How important were the following benefits in your firm’s decision to use SaaS?”
(Percentage of respondents who selected 4 [important factor] or 5 [very important factor])
(Select one for each row)
“Lower overall cost” “Improved business agility”
71% 72%
58%
61% 60%
32%
2009 (N = 287) 2010 (N = 534) 2011 (N = 920)
2009 2010 2011
(N = 287) (N = 534) (N = 920)
Base: North American and European software decision-makers who
are using or p
g planning to use SaaS
g
Source: Source: Enterprise And SMB Software Survey, North America And Europe, Q4 2009; Forrsights Software Survey,
Q4 2010; Forrsights Software Survey, Q4 2011
60 © 2012 Forrester Research, Inc. Reproduction Prohibited](https://image.slidesharecdn.com/rebootyoursmmay182012-120517102206-phpapp01/85/Reboot-Your-IT-Service-Management-60-320.jpg)

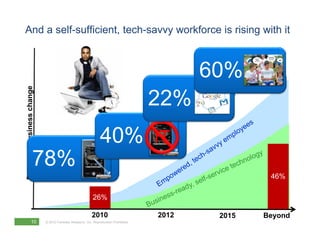
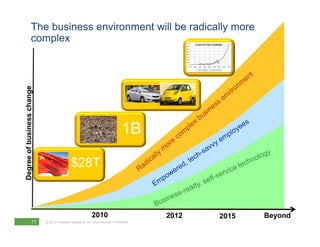
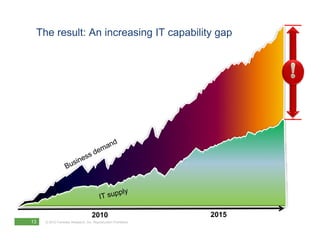
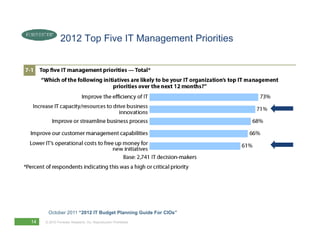
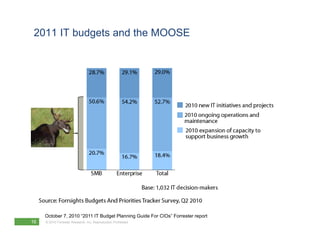
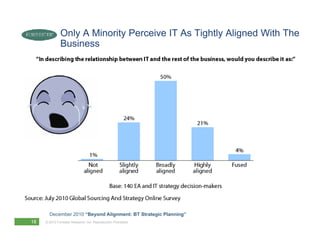
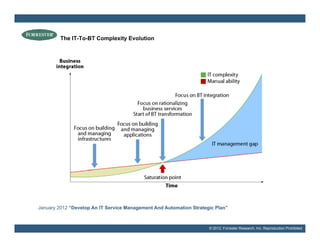
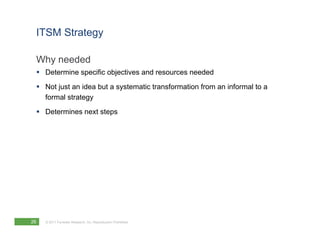
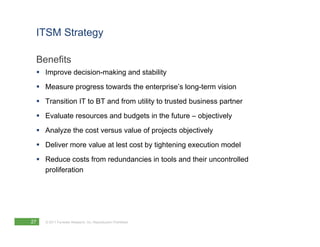
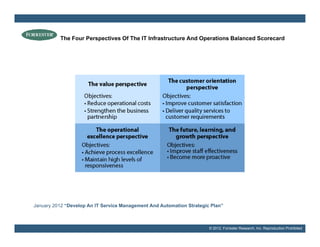
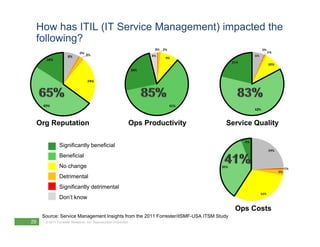
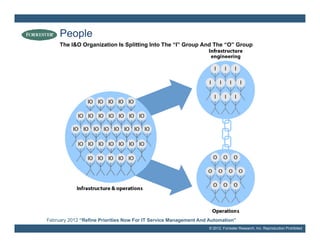
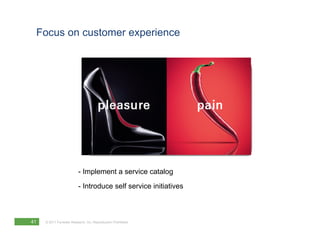
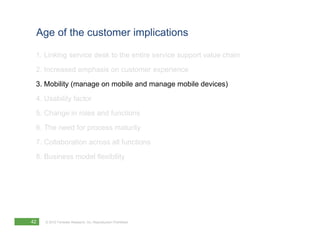
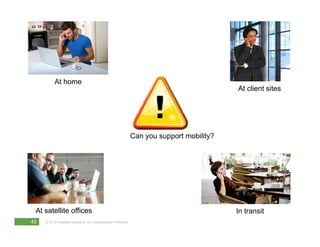
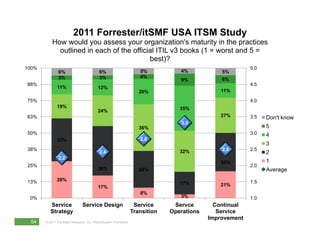
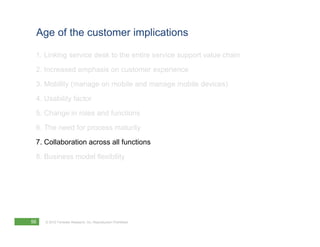
The document discusses the importance of IT service management (ITSM) amidst shifting business demands and an evolving IT landscape. It emphasizes the need for a strategic approach to ITSM to improve efficiency, customer experience, and alignment with business goals. Key priorities for IT management include cloud adoption, operational cost reduction, and process improvement, along with the emergence of new roles and a focus on mobility and usability.


![Partner facing vspex deck[1]](https://cdn.slidesharecdn.com/ss_thumbnails/partnerfacingvspexdeck1-120501091540-phpapp02-thumbnail.jpg?width=640&height=640&fit=bounds)