Download to read offline


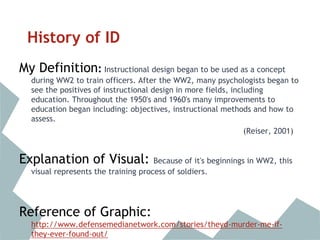

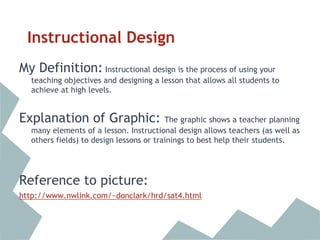

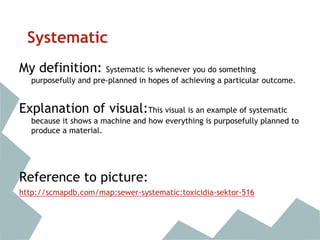


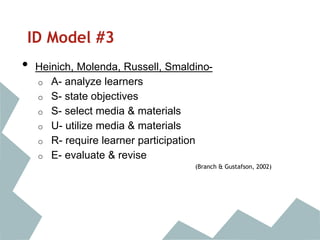

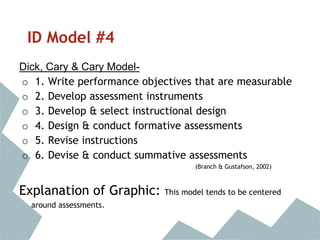

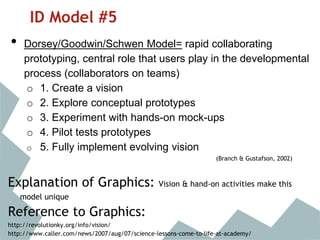

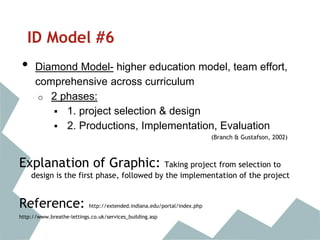


This document provides an overview of different instructional design models through a series of slides. It begins with providing context on the history of instructional design. It then defines key concepts like instructional design, systematic approaches, and models. The bulk of the document describes six different instructional design models through graphics and explanations of each model's steps or phases. It concludes by defining and providing graphics for concepts related to learning theories - constructivism, empiricism, behaviorism, information processing theory, and educational technology.


