Downloaded 238 times


![5
required in the sector at full and current capacities from 2003 to 2006. And this shortfall of 6,178, 997 to 3,167, 726 3,011,271 respectively over a period of 4 years.
2.3 Raw Material Requirements on Sub-Sectoral Basis
More than ninety (90) percent of raw materials used in the Iron and Steel, Foundries and Welding Electrodes sub-sectors are imported, even though some of them can be sourced locally with appropriate technology and production methods. However, raw materials required by each of the sub-sector are presented as follows:
2.3.1 Base Metals sub-sector
Base metals are non-ferrous metals such as aluminum, copper, lead, zinc, tin, gold, manganese columbite, nickel, tourmaline, chromites, e.t.c, while some of these metals can be used in their natural forms, others are used as alloys. In recent times, non-ferrous metals and alloys are significantly contributing to global technological development. Focus of activities in this sub- sector had been mostly on tin, a metal for which Nigeria has attained international standing in the early ‘70s. Some of the available local raw materials and other activities are presented below:
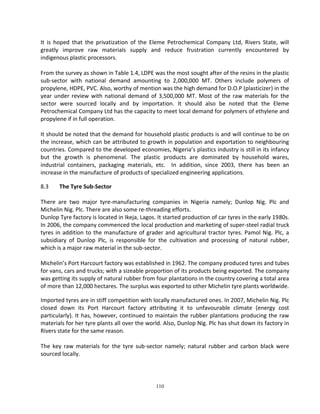
Table 2.1: Raw Materials and Status of Industries in Base-Metal Sub-Sector.
S/N
BASE METAL
DEPOSIT [STATE]
PROVEN RESERVE [MT]
REMARKS
INDUSTRY AND STATUS
Name
Status
1
Aluminum
Benue, Delta, Ekiti, Enugu, Kebbi, Taraba,
N/A
Exploration
1. ALSCON
2. Private Mills
About to be rehabilitated after privatization
Functional
2
Tin
Bauchi, Cross River, Ekiti, Kaduna, Kano, Niger, Plateau, Nassarawa, Taraba, FCT
300,000
Mining in progress
Makeri Smelting Co. Ltd., Jos
Reorganization/ rehabilitation
3
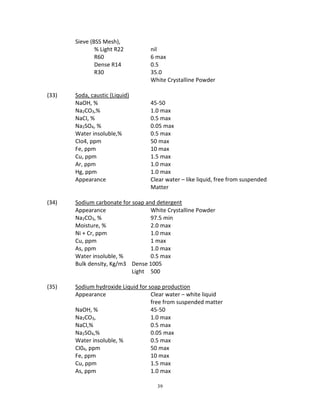
Lead and Zinc
Bauchi, Benue, Cross River, Ebonyi, Imo, Kano, Plateau,
20,000
Legal/illegal mining in progress
-
-
4
Gold
Cross River, Edo, Kaduna, Katsina, Kebbi, Niger, Osun, Zamfara,
N/A
Organized gold mining going on
-
-
5
Copper
Bauchi, Edo, Enugu, Kano, Niger,
N/A
-
-
-
6
Silver
Ebonyi, Gombe, Osun
N/A
Associated with gold, lead and zinc
-
-
7
Manganese
Cross River, Kaduna, Katsina, Kebbi,
300,000
Illegal mining in progress
-
-
8
Titanium
Plateau, Kaduna
Associated with tin ore. Presently waste in tin extraction.
-
-
Source: RMRDC.](https://image.slidesharecdn.com/rawmaterialsandtheiruses-141128053927-conversion-gate02/85/Raw-materials-and-their-uses-18-320.jpg)
![6
2.3.2: Iron and Steel sub-sector
Most of the operators in the sub-sectors are process equipment fabricators, spare parts producers, welders, steel furniture, doors, windows and burglary-proof fabricators.
Some of the essential raw materials and consumables required in the sub sector are Iron Ore, Coking Coal, Limestone, dolomite, refractory bricks, Ferro-alloys, Iron and Steel Scrap, natural gas and billets. Major Iron ore deposits in Nigeria are presented in Table 2.2.
Table 2.2 Major Iron Ore Deposits in Nigeria.
STATE
LOCATION
% FE
PROVEN RESERVES [MILLION TONNES]
REMARKS
Kogi
Agbaja
Itakpe
Bass Nge
Agbado-Okuda
Ajbanoko
Chokochoko
Fatti
Koton-Karfe
45 – 54
38 – 45
43 – 49
38 – 43
40
35
46
43 - 53
1,159
200 – 300
4,000
60
60
20
37
803
UI
Mining in progress
-do-
-do-
-do-
-do-
-do-
-do-
Plateau
Muro Hills
32
N/A
UI
Bauchi
Rishi
Gamawa
10 – 19
40 – 45
N/A
N/A
G
UI
Kebbi
Darkin-Gari
37
N/A
UI
Anambra
Nsude Hills
43 – 50
65
UI
Source: Oyeyinka et al [1997]
KEY UI = Under investigation
N/A = Not available
G = Only geological confirmation of ore presence
2.3.3. Foundaries
The Foundry sub-sector provides base for production of industrial components, spare parts, equipment and machinery. Most of the foundries in Nigeria deal with iron castings, low quality aluminum, brass, bronze and copper. The main raw materials required are scrap, pig Iron, coke, ferro-silicon ferro-manganese, limestone, silica sand, bentonite and sodium silicate. Iron castings are made from scraps such as (engine blocks, crank shafts, etc), while for non-ferrous castings, usually aluminum, copper, brass and tin are required. The major material inputs for the foundry industry include:
Feedstock for melting pig iron, cast Iron Scrap, Steel Scrap, ferro-alloys, copper and its alloys, aluminum scraps, ingot, fluxes, etc.
Molding materials – foundry sands, bentonite, binders
Refractory lining materials, crucibles and other consumables.
2.3.4. Welding Electrodes
Welding electrodes are widely used in Base Metal, Iron and Steel and Engineering Services Sector. Electrodes contain various minerals which remove impurities during welding and protect weld area from oxygen and nitrogen, etc. Some minerals used in its production which](https://image.slidesharecdn.com/rawmaterialsandtheiruses-141128053927-conversion-gate02/85/Raw-materials-and-their-uses-19-320.jpg)


This document provides a summary of raw material sourcing for manufacturing in Nigeria. It examines the raw material requirements and specifications across 10 sectors of the economy. The sectors covered include base metals, iron and steel, chemicals and pharmaceuticals, electrical and electronics, food and beverages, motor vehicles, non-metallic minerals, plastics and rubber, pulp and paper, and textiles. For each sector, the report analyzes local availability of raw materials, capacity utilization, potential for local substitution, industries operating in the sector, research and development activities, and recommendations. It aims to support manufacturers and investors by providing information on raw material options and developing local raw material industries.


