Download to read offline
![International Journal of Mathematical Education in
Science and Technology, Vol. 38, No. 8, 15 December 2007, 1075–1092
A case study of dynamic visualization and problem solving
ILANA LAVY*
The Max Stern Academic College of Emek Yezreel, Israel
(Received 24 January 2006)
This paper reports an example of a situation in which university students had to
solve geometrical problems presented to them dynamically using the interactive
computerized environment of the ‘MicroWorlds Project Builder’. In the process
of the problem solving, the students used ten different solution strategies. The
unsuccessful strategies were then classified into three main categories: distracting,
reducing and confusing. One student group had to solve the same problem in its
non-dynamic version. The results received from both groups were compared and
analysed. Analysis of the solution strategies and the process of the categorization
revealed that the percentage of success in both groups was similar and in the case
of the given problem, the dynamic visual mode of the problem distracted the
students’ attention away from proper handling of the solution of the problem.
1. Introduction
A great deal of research has discussed the advantages of visualization with regard to
problem solving [1–5]. Visualization enables various ways of thinking, different from
traditional approaches where formalism and symbolism dominate teaching. Visual
thought can offer an alternative and powerful resource in learning mathematics.
Kosslyn [6] argued that one of the main components of imagery processing involved
representation. Problem representation has been viewed as an important stage of the
problem solving process [7]. In the initial stages of the problem solving process it is
beneficial to represent the problem in a visual manner [8].
Research also discusses difficulties which involved imagery with regard to visual
thinking [1, 2]: (1) The one-case concreteness of an image or diagram may tie thought
to irrelevant details, or may even bring in false data. (2) An image of a
standard figure may induce inflexible thinking which prevents the recognition of a
concept in a nonstandard diagram. (3) An uncontrollable image may persist, thereby
preventing the opening up of more fruitful avenues of thought, a difficulty which is
particularly severe if the image is vivid. (4) Imagery which is vague needs to be
coupled with rigorous analytical thought processes if it is to be helpful.
Distinction should be drawn between difficulties that are intrinsic to visualization
such as the difficulties described in the previous paragraph and difficulties that are
*Email: llanaL@yvc.ac.il
International Journal of Mathematical Education in Science and Technology
ISSN 0020–739X print/ISSN 1464–5211 online ß 2007 Taylor & Francis
http://www.tandf.co.uk/journals
DOI: 10.1080/00207390601129196](https://image.slidesharecdn.com/acasestudyofdynamicvisualizationandproblemsolving-230806124745-fa774285/85/A-Case-Study-Of-Dynamic-Visualization-And-Problem-Solving-1-320.jpg)
![International Journal of Mathematical Education in
Science and Technology, Vol. 38, No. 8, 15 December 2007, 1075–1092
A case study of dynamic visualization and problem solving
ILANA LAVY*
The Max Stern Academic College of Emek Yezreel, Israel
(Received 24 January 2006)
This paper reports an example of a situation in which university students had to
solve geometrical problems presented to them dynamically using the interactive
computerized environment of the ‘MicroWorlds Project Builder’. In the process
of the problem solving, the students used ten different solution strategies. The
unsuccessful strategies were then classified into three main categories: distracting,
reducing and confusing. One student group had to solve the same problem in its
non-dynamic version. The results received from both groups were compared and
analysed. Analysis of the solution strategies and the process of the categorization
revealed that the percentage of success in both groups was similar and in the case
of the given problem, the dynamic visual mode of the problem distracted the
students’ attention away from proper handling of the solution of the problem.
1. Introduction
A great deal of research has discussed the advantages of visualization with regard to
problem solving [1–5]. Visualization enables various ways of thinking, different from
traditional approaches where formalism and symbolism dominate teaching. Visual
thought can offer an alternative and powerful resource in learning mathematics.
Kosslyn [6] argued that one of the main components of imagery processing involved
representation. Problem representation has been viewed as an important stage of the
problem solving process [7]. In the initial stages of the problem solving process it is
beneficial to represent the problem in a visual manner [8].
Research also discusses difficulties which involved imagery with regard to visual
thinking [1, 2]: (1) The one-case concreteness of an image or diagram may tie thought
to irrelevant details, or may even bring in false data. (2) An image of a
standard figure may induce inflexible thinking which prevents the recognition of a
concept in a nonstandard diagram. (3) An uncontrollable image may persist, thereby
preventing the opening up of more fruitful avenues of thought, a difficulty which is
particularly severe if the image is vivid. (4) Imagery which is vague needs to be
coupled with rigorous analytical thought processes if it is to be helpful.
Distinction should be drawn between difficulties that are intrinsic to visualization
such as the difficulties described in the previous paragraph and difficulties that are
*Email: llanaL@yvc.ac.il
International Journal of Mathematical Education in Science and Technology
ISSN 0020–739X print/ISSN 1464–5211 online ß 2007 Taylor & Francis
http://www.tandf.co.uk/journals
DOI: 10.1080/00207390601129196](https://image.slidesharecdn.com/acasestudyofdynamicvisualizationandproblemsolving-230806124745-fa774285/75/A-Case-Study-Of-Dynamic-Visualization-And-Problem-Solving-1-2048.jpg)
![extrinsic to visualization such as described in the given task. Intrinsic difficulties are
difficulties that emerge as a consequence of visual thinking. Extrinsic difficulties are
difficulties that emerge as a consequence of the use of certain modes of visual
representations of a problem. In the case of the problem given in this study,
questions might be raised whether intrinsic and extrinsic difficulties have a reciprocal
influence on each other.
One of the possible ways to visualize a problem is by the use of a computerized
environment. When a visualized problem is presented in an interactive computerized
environment, the interactivity enables continuity in the process of thinking about
the problem since the learner gets immediate feedback to his or her operation,
which might motivate him or her to keep on trying various options in order to
solve the problem. The ability to solve a problem interactively also enables the
checking of an enormous number of situations rapidly and with an immediate
response, and as a result facilitates the process of problem solving. Finally, in
certain interactive environments, the software enables one to examine a conjecture
so that one can see if a hypothesis is valid before making any great efforts trying
to prove it.
Being aware of all the above advantages along with the possible difficulties, the
author gave one group of university students a dynamic visualized geometrical
problem that was presented to them in the ‘MicroWorlds Project-Builder’ (MWPB)
environment; to a second group of students the author gave the non-dynamic version
of the same problem, and was surprised by the results obtained.
2. Literature survey
The present study examines the effect of visual representation of a geometrical
problem given in the interactive environment of the ‘‘Microworlds Project Builder’’
on the process of solving the said problem. Hence, the literature survey includes
references to the role of visualization regarding problem solving and to the evolution
of mathematical microworlds in general and to the environment of the ‘MicroWorlds
Project Builder’ in particular.
2.1. The evolution of mathematical microworlds
‘Microworlds are environments where people can explore and learn from what they
receive back from the computer in return for their exploration’ [9, p. 30].
Mathematical Microworlds developed in recent years met the need for a learning
environment in which learners could create a common language and be engaged in
mathematical processes such as generalization, abstraction, problem solving and
gradual transition from intuitive to formal description of mathematical concepts.
One of the purposes of using Microworlds was to connect intuitive and formal
aspects of thinking. Hoyles and Noss [10] suggested a definition of the Microworld
concept that relates to the following components: technical (software), pedagogical,
the learner and the context.
‘A microworld cannot be defined in isolation from either the learner, the
teacher or the setting; activity in the Microworld will be shaped by the past
experience and intuitions of the learner, and by the aims and expectations of the
teacher’ [10].
1076 I. Lavy](https://image.slidesharecdn.com/acasestudyofdynamicvisualizationandproblemsolving-230806124745-fa774285/85/A-Case-Study-Of-Dynamic-Visualization-And-Problem-Solving-2-320.jpg)
![Various researchers were motivated by Papert’s vision, appearing in his book,
Mindstorms that: ‘. . . Children get to know what it is like to explore the properties of
a chosen microworld undisturbed by extraneous questions. In doing so they learn to
transfer habits of exploration from their personal lives to the formal domain of
scientific theory construction’ [11, p. 117]. Researchers developed Microworlds in
science and mathematics [12–16]. Some examples of mathematical Microworlds are:
‘Mathsticks’ – developed by Noss, Healy and Hoyles [15] for learning algebraic
themes; ‘Turtles Mirrors’ – developed by Hoyles and Healy [16] for learning
reflective symmetry. Sinclair, Zazkis and Liljedahl [17] explored the impact of the
MicroWorld Number Worlds on the understanding of pre-service elementary
teachers of concepts and relationships underlying elementary number theory. They
found that interaction with Number Worlds had a positive effect in helping
participants construct those concepts.
The above mentioned microworlds serve as settings for developing problem-
solving skills and mathematical thinking, and only partly for the use of
programming. While being aware of the fact that programming is time-consuming,
too hard, and diverts attention from the underlying knowledge goals, in their
rethinking of the microworld ideas, Hoyles, Noss and Adamson [9] wrote that a
microworld without programming runs the risk of avoiding just the thing that gives a
microworld its power.
Edwards [18] distinguished between ‘internal’ representations, which are
constructed by the learner and which may involve both conventional and ‘private’
imagery, and ‘external’ representations: socially-shared, externally displayed nota-
tions and means of expressing ideas which are encountered in the course of learning
about mathematics. Computer microworlds can be viewed as specific forms of
external representations of mathematical ideas.
2.1.1. The ‘‘Microworlds Project Builder’’. The present research was carried out in
an interactive computerized environment called ‘MicroWorlds Project Builder’.y The
MWPB is an interactive LOGO based programming environment consisting of
objects (i.e. turtle, textbox, button, colour and slider) and a set of operations such as
changing the turtle shape, making it move in different directions with varying speeds
and so forth.
The general aim of the course in which this research was carried out is to expose
the students to innovative learning/teaching approaches. In this course the students
interact with activities including major computer science concepts such as objects,
variables, procedures, functions and recursion through engagement with program-
ming in the Logo language which takes place in an interactive multimedia
environment.
One of the MWPB’s objects are the colours. The operation of a programmed
colour can be done in two different ways: (a) by clicking with the mouse on the
programmed colour; and (b) by a turtle touching the programmed colour. When
either of the two options is performed, certain commands that were previously
programmed for that specific colour will be executed. For example, one can program
the blue colour to change the shape of the turtle when the turtle touches it, or one can
yMicroWorlds Project Builder is a product of Logo Computer Systems Inc. (LCSI). For more
details see the company’s Web site: http://www.microworlds.com
Dynamic visualization and problem solving 1077](https://image.slidesharecdn.com/acasestudyofdynamicvisualizationandproblemsolving-230806124745-fa774285/85/A-Case-Study-Of-Dynamic-Visualization-And-Problem-Solving-3-320.jpg)
![program the pink colour to change the shape of the currenty turtle when she/he clicks
with the mouse on the pink colour.
In the problem presented to the students the programmed attributes of the
colours were used. In the present study, although a new microworld was not
developed, a simple environment was used, which can be viewed as a kind of
microworld since it consists of two colours (of the shape and of the background),
a turtle and simple Logo commands.
2.2. Visualization and problem solving
Visualization has an important role in the development of thinking and
mathematical understanding and in the transition from concrete to abstract thinking
with regard to problem solving.
Computing technology is making it much more rewarding for mathematics to
use graphics, and in turn mathematics is showing an increased interest in visual
approaches to both teaching and research. [18, p. 75]
Presmeg [1, 2, 19, 20] classified the different types of visualization appearing in
mathematical activities in general and in problem solving in particular: concrete
pictorial imagery, pattern imagery, memory images of formulae, kinesthetic imagery
and dynamic imagery.
Visualization is a process of construction or use in geometrical or graphical
presentations of concepts, or ideas built by means of paper and pencil, a computer
software or imagination. Visualization is important for building a concept image,
and helps in understanding of concepts [21]. In addition, it is considered in
supporting intuition and in the learning of mathematical concepts [22]. There is a
distinction between external presentation (signifier) and an internal presentation
(signified) of concepts [23–26]. The external representations of concepts include
diagrams, graphs and models and are essential for communication while the internal
representations of concepts include mental or cognitive models with which a person
examines and interprets new knowledge. Within the latter process modifications are
made in case there is no match between the existing models and the new knowledge.
The internal presentations are invisible and their existence can be inferred by
observations of the learning process. Steen (in [18]) wrote that mathematics is the
science of patterns and the mathematician looks for patterns in numbers, in space,
in the computer and in the imagination.
Zimmermann and Cunningham [29] refer to visualization which is computer
based. The graphics and the dynamics provided by computers enabled visual
presentation of mathematical ideas and concepts. The problem given to the
participants in this study was computer-based and presented in a visual mode.
Although researchers pointed out various advantages regarding the use of
visualization in the process of problem solving, some of them refer to the difficulties
that might be raised [1, 27]. Dreyfus [22] indicated that it is important to be aware of
difficulties that might arise due to improper use in visualization, difficulties in
reading graphs properly, lack of distinction between the geometrical image and its
yThe turtle, which made the last movement or operation on the computer screen, is considered
to be the current turtle.
1078 I. Lavy](https://image.slidesharecdn.com/acasestudyofdynamicvisualizationandproblemsolving-230806124745-fa774285/85/A-Case-Study-Of-Dynamic-Visualization-And-Problem-Solving-4-320.jpg)
![visual presentation. Dreyfus also pointed out the phenomenon that visualization
does not have a proper status in mathematics education and that those causing
this situation are the mathematicians themselves. Although most of them use visual
justifications while working on a proof, when the proof is completed – they omit
from the proof all the visual elements. Thus it can be inferred that visual
justifications are good only as a supportive tool. Dreyfus claimed that this status
given to visual justification is not warranted and he presented examples from
geometry that demonstrate the fact that proofs without their visual parts are difficult
to comprehend. Arcavi [27] classified the difficulties surrounding visualization into
three main categories: cultural, cognitive and sociological. The cultural category
refers to the beliefs and values regarding what is mathematically legitimate or
acceptable and what is not. The cognitive difficulties refer to the discussion regarding
the issue of whether visual thinking is easier or more difficult. In addition, reasoning
with concepts in visual settings may imply that there are not always procedurally
‘safe’ routines to rely on and as a consequence this mode of cognition is rejected by
students. The sociological difficulties refer to issues of teaching. Some teachers find
analytic representations, which are sequential in nature, to be more appropriate and
efficient than visual representations [28].
The present study examines a situation in which a certain visualization of a
specific problem does not facilitate the process of solving it. By ‘certain visualization’
is meant the dynamic version of the given problem presented to the students from
which they had to infer the geometrical problem and solve it. The results obtained
from the student group that had to solve the non-dynamic version of the same
problem were similar in their percentage of success to the solutions received from the
dynamic version.
3. The study
3.1. The participants
92 undergraduate university students participated in this research. Most of them
were second or third semester students. The research was carried out during five
consecutive semesters and in each semester between 15 to 20 students participated.
They were all students of the computer-teaching education department. Only an
insignificant number of them were students of higher semesters. All the students had
previously studied additional courses in programming. There was no preliminary
testing of the students regarding their visual skills. 78 of the participants had to solve
the problems which were presented in dynamic visualized version, while 4 of the
students were given the same problems without their dynamic visualized version.
The results from both groups were compared.
3.2. The tasks
3.2.1. The dynamic visualized version. As part of the curriculum, the study
participants have to take a course in which computing principals such as procedures,
functions, recursion and so forth are taught. The environment used in this course is
the ‘MicroWorlds Project Builder’ (MWPB).
Dynamic visualization and problem solving 1079](https://image.slidesharecdn.com/acasestudyofdynamicvisualizationandproblemsolving-230806124745-fa774285/85/A-Case-Study-Of-Dynamic-Visualization-And-Problem-Solving-5-320.jpg)
![(3) when it moves parallel to the radial direction. Then the students were asked to try
to solve the given problem individually using programming and/or geometrical
considerations.
Analysis of the solutions handed in by the students revealed that none of them
used programming in the process of the problem solving despite the fact that at this
stage of the course all of them knew how to program very well. When some of them
were asked coincidentally why they did not use programming the most common
answer was: ‘I did not feel that it (programming) will support the solving process of the
problem and I felt that instead of investing a big effort in the programming which I am
not sure that will help me to solve the problem, it is better for me to focus on the
geometrical attributes of the problem’. The above students’ reaction is consistent with
Hoyles, Noss and Adamson [9], who claim that although a microworld
without programming runs a risk of avoiding just the thing that gives a microworld
it’s power – it takes too much time, is too hard and diverts attention from the
underlying knowledge goals.
4.2. Distribution of the solution strategies used by the students – dynamic visualized
version
In the individual part of working on the given problem, the students had to solve the
problem and present it to the researcher after two weeks. The students’ solutions
were then classified into 10 solution categories according to the nature of the
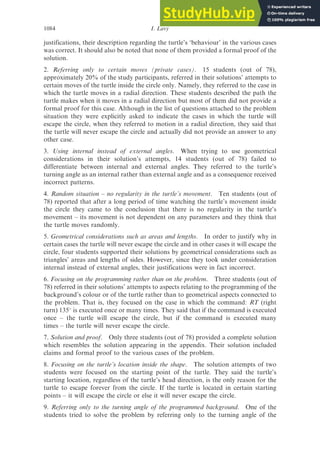
presented solution. Table 1 demonstrates the distribution of the students’ solutions
strategies. In the following section, a description of each strategy will be presented.
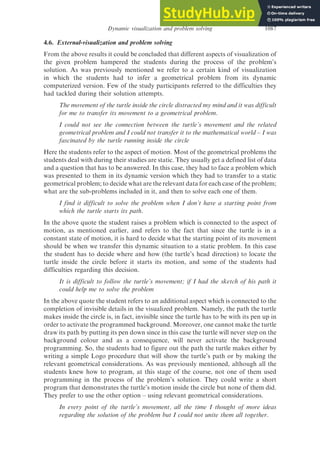
4.3. Solution strategies – dynamic visualized version
1. Descriptive solution – no proof. Twenty-one students (out of 78) provided a
descriptive solution of the problem. The students’ solutions included an informal
description of the turtle’s path as it moves in a radial direction. They also provided
an informal description of the cases in which the turtle will escape the circle or will
never escape it. Although they did not support their solution with mathematical
Table 1. The distribution of the solution strategies used by the students.
# Strategy
No. of
students %
1. Descriptive solution – no proof 21 27
2. Referring only to certain moves (private cases) 15 19.2
3. Using internal instead of external angles 14 18
4. Random situation – no regularity in the turtle’s movement 10 12.8
5. Geometrical considerations such as areas and lengths 4 5.2
6. Focusing on the programming rather than on the problem 3 3.8
7. Solution and a proof 3 3.8
8. Focusing on the turtle’s location inside the shape 2 2.6
9. Referring only to the turning angle of the
programmed background
1 1.2
10. Others 5 6.4
Total 78 100
Dynamic visualization and problem solving 1083](https://image.slidesharecdn.com/acasestudyofdynamicvisualizationandproblemsolving-230806124745-fa774285/85/A-Case-Study-Of-Dynamic-Visualization-And-Problem-Solving-9-320.jpg)
![References
[1] Presmeg, N., 1986a, Visualization in high-school mathematics. For the Learning of
Mathematics, 6(3), 42–46.
[2] Presmeg, N., 1986b, Visualization and mathematical giftedness. Educational Studies in
Mathematics, 17(3), 297–311.
[3] Kent, L.B., 2000, Connecting integers of meaningful context. Mathematics Teaching in the
Middle School, 6(1), 62–66.
[4] Mariotti, M.A., 2000, Introduction to proof: the mediation of a dynamic software
environment. Educational Studies in Mathematics, 44(1–2), 25–53.
[5] Slovin, H., 2000, Moving to proportional reasoning. Mathematics Teaching in the Middle
School, 6(1), 58–60.
[6] Kosslyn, S.M., 1983, Ghosts in the Mind’s Machine: Creating and Using Images in the
Brain (New York: W.W.Norton); Hershkowitz, R., 1989, Visualization in geometry – two
sides of the coin. Focus on Learning Problems in Mathematics, 11(1), 61–76.
[7] Mayer, R.E., 1992, Thinking, Problem Solving, Cognition, 2nd edn (New York: W.H.
Freeman).
[8] Lowrie, T. and Hill, D., 1996, The development of a dynamic problem-solving model.
Journal of Science and Mathematics Education in Southeast Asia, XXIX(1), 1–11.
[9] Hoyles, C., Noss, R. and Adamson, R., 2002, Rethinking the microworlds idea. Journal of
Educational Computing Research, 27(12), 29–53.
[10] Hoyles, C. and Noss, R., 1987, Synthesizing mathematical conceptions and their
formalization through the construction of a Logo-based school mathematics curriculum.
International Journal of Mathematics Education, Science, and Technology, 18, 581–595.
[11] Papert, S., 1980, Mindstorms: Children, Computers, and Powerful Ideas. (New York:
Basic Books).
[12] diSessa, A., 1982, Unlearning Aristotelian physics: a study of knowledge-based learning.
Cognitive Science, 6, 37–75.
[13] Edwards, L., 1992, A Logo microworld for transformation geometry. In: C. Hoyles and
R. Noss (Eds) Learning Logo and Mathematics (Cambridge, MA: MIT Press),
pp. 127–155.
[14] Sendova, E. and Sendov, B., 1993, Learning to speak mathematically and speaking
mathematically to learn in the Logo-based environment ‘‘Geomland’’. 4th European Logo
Conference, Athens Greece, pp. 281–288.
[15] Noss, R., Healy, L. and Hoyles, C., 1997, The construction of mathematical meanings:
connecting the visual with the symbolic. Educational Studies in Mathematics, 33(2),
202–231.
[16] Hoyles, C. and Healy, L., 1997, Unfolding meanings for reflective symmetry.
International Journal of Computers for Mathematics Learning, 2(1), 27–59.
[17] Sinclair, N., Zazkis, R. and Liljedahl, P., 2003, Number worlds: visual and experimental
access to elementary number theory concepts. International Journal of Computers for
Mathematical Learning, 8(3), 235–263.
[18] Edwards, L.D., 1995, Microworlds as representations. In: A.A. diSessa, C. Hoyles and
R. Noss (Eds) Computers and Exploratory Learning, NATO ASI Series (VIII: Springer
Verlag), pp. 127–154.
[19] Presmeg, N., 1989, Visualization in multicultural mathematics classrooms. Focus on
Learning Problems in Mathematics, 11(1–2), 17–24.
[20] Presmeg, N., 1992, Prototypes, metaphors, metonymies and imaginative rationality in
high school mathematics. Educational Studies in Mathematics, 23(6), 595–610.
[21] Hershkowitz, R., 1990, Psychological aspects of learning geometry. In: P. Nesher and
J. Kilpatrick (Eds) Mathematics and Cognition (Cambridge: Cambridge University Press),
pp. 70–95.
[22] Dreyfus, T., 1991, On the status of visual reasoning in Mathematics and Mathematics
Education. Proceedings of the 15th International Conference for the Psychology of
Mathematical Education, Vol. 1, pp. 33–48.
[23] Kaput, J.J., 1987, Towards a theory of symbol use in mathematics. In: C. Janvier (Ed.)
Problems of Representation in the Teaching and Learning of Mathematics (Hillsdale, NJ:
Lawrence Erlbaum Associates), pp. 159–195.
Dynamic visualization and problem solving 1091](https://image.slidesharecdn.com/acasestudyofdynamicvisualizationandproblemsolving-230806124745-fa774285/85/A-Case-Study-Of-Dynamic-Visualization-And-Problem-Solving-17-320.jpg)
![[24] Kaput, J.J., 1989, Supporting concrete visual thinking in multiplicative reasoning:
difficulties and opportunities. Focus on Learning Problems in Mathematics, 11(1), 35–47.
[25] Janvier, C., 1987, Representation and understanding: the notion of function as an
example. In: C. Janvier (Ed.) Problems of Representation in the Teaching and Learning of
Mathematics (Hillsdale, NJ: Lawrence Erlbaum Associates), pp. 67–71.
[26] Janvier, C., Girardon, C. and Morand, J.-C., 1993, Mathematical symbols and
representations. In: P.S. Wilson (Ed.) Research Ideas for the Classroom, High School
Mathematics (New York: Macmillan), pp. 79–102.
[27] Arcavi, A., 2003, The role of visual representations in the learning of mathematics.
Educational Studies in Mathematics, 52, 215–241.
[28] Presmeg, N., (1991), Classroom aspects which influence use of visual imagery in high
school mathematics. In: F. Furunghetti (Ed.) Proceedings of Fifteenth International
Conference on the Psychology of Mathematics Education (PME) Conference, Assisi, Italy,
Vol. 3, pp. 191–198.
[29] Zimmermann, W. and Cunningham, S., 1991, What is mathematical visualization?
In: W. Zimmermann and S. Cunningham (Eds) Visualization in Teaching and Learning
Mathematics (Washington: Mathematical Association of America), pp. 1–8.
1092 I. Lavy](https://image.slidesharecdn.com/acasestudyofdynamicvisualizationandproblemsolving-230806124745-fa774285/85/A-Case-Study-Of-Dynamic-Visualization-And-Problem-Solving-18-320.jpg)

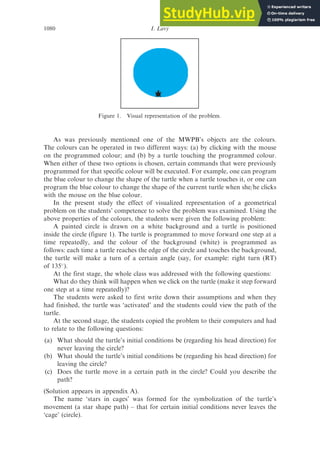
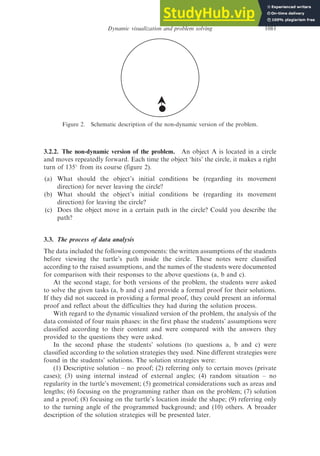
1. The study examined how university students solved geometrical problems presented dynamically using interactive computer software versus the same problems presented non-dynamically. 2. In the dynamic version, students were given a problem involving a turtle moving inside a circle that turned 135 degrees each time it hit the edge. 3. Results showed similar success rates between the dynamic and non-dynamic groups, suggesting the dynamic visuals did not aid problem-solving and may have distracted students' attention from the geometric aspects.


