Download to read offline


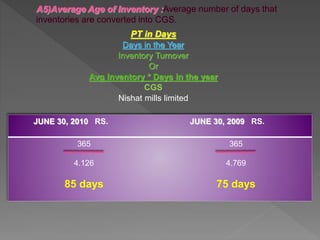


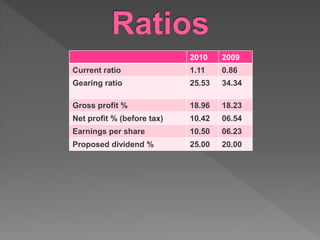


This document provides an analysis of the financial ratios of Nishat Mills Limited for the years ending June 30, 2010 and June 30, 2009. It includes calculations and comparisons of key liquidity, debt, coverage, activity, and profitability ratios. Specifically, it analyzes ratios such as current ratio, acid-test ratio, debt-to-equity ratio, inventory turnover, gross profit margin, and others to assess the company's financial performance and position.


