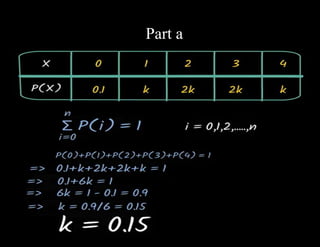
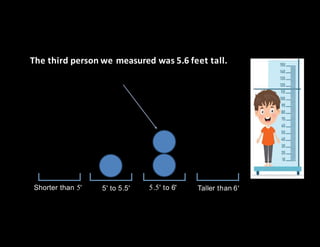
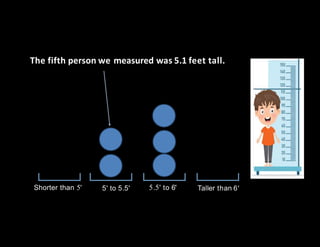
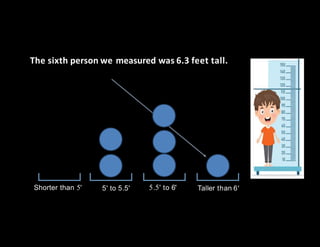
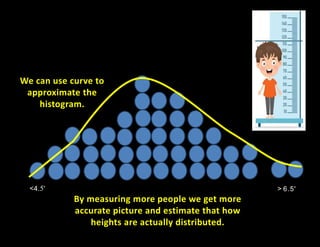
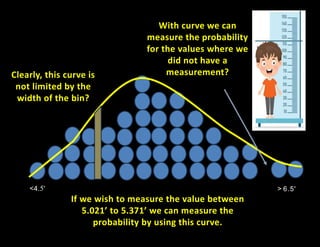
The document discusses random variables and probability distributions. It describes a scenario where X is the number of hours spent studying on a random school day. The probability that X takes on certain values (0, 1, 2, 3, or 4 hours) is given by a formula containing an unknown constant k. The questions ask to (1) find the value of k, and (2) calculate various probabilities related to the number of hours spent studying. The document then shifts to discussing histograms and probability distributions, using the example of measuring human heights and binning the results to visualize the distribution in a population. It describes how histograms can be approximated by curves to estimate probabilities across the full range of values.


![Lesson3 lpart one - Measures mean [Autosaved].pptx](https://cdn.slidesharecdn.com/ss_thumbnails/lesson2-measuresmeanautosaved-241011173812-613e1e66-thumbnail.jpg?width=640&height=640&fit=bounds)


![Human Reproduction [ Reproductive System ] Notes @irfanullah_mehar Irfanullah...](https://cdn.slidesharecdn.com/ss_thumbnails/humanreproductionreproductivesystemnotesirfanullahmeharirfanullahmeharjanantantra-260111172350-56e85778-thumbnail.jpg?width=640&height=640&fit=bounds)


