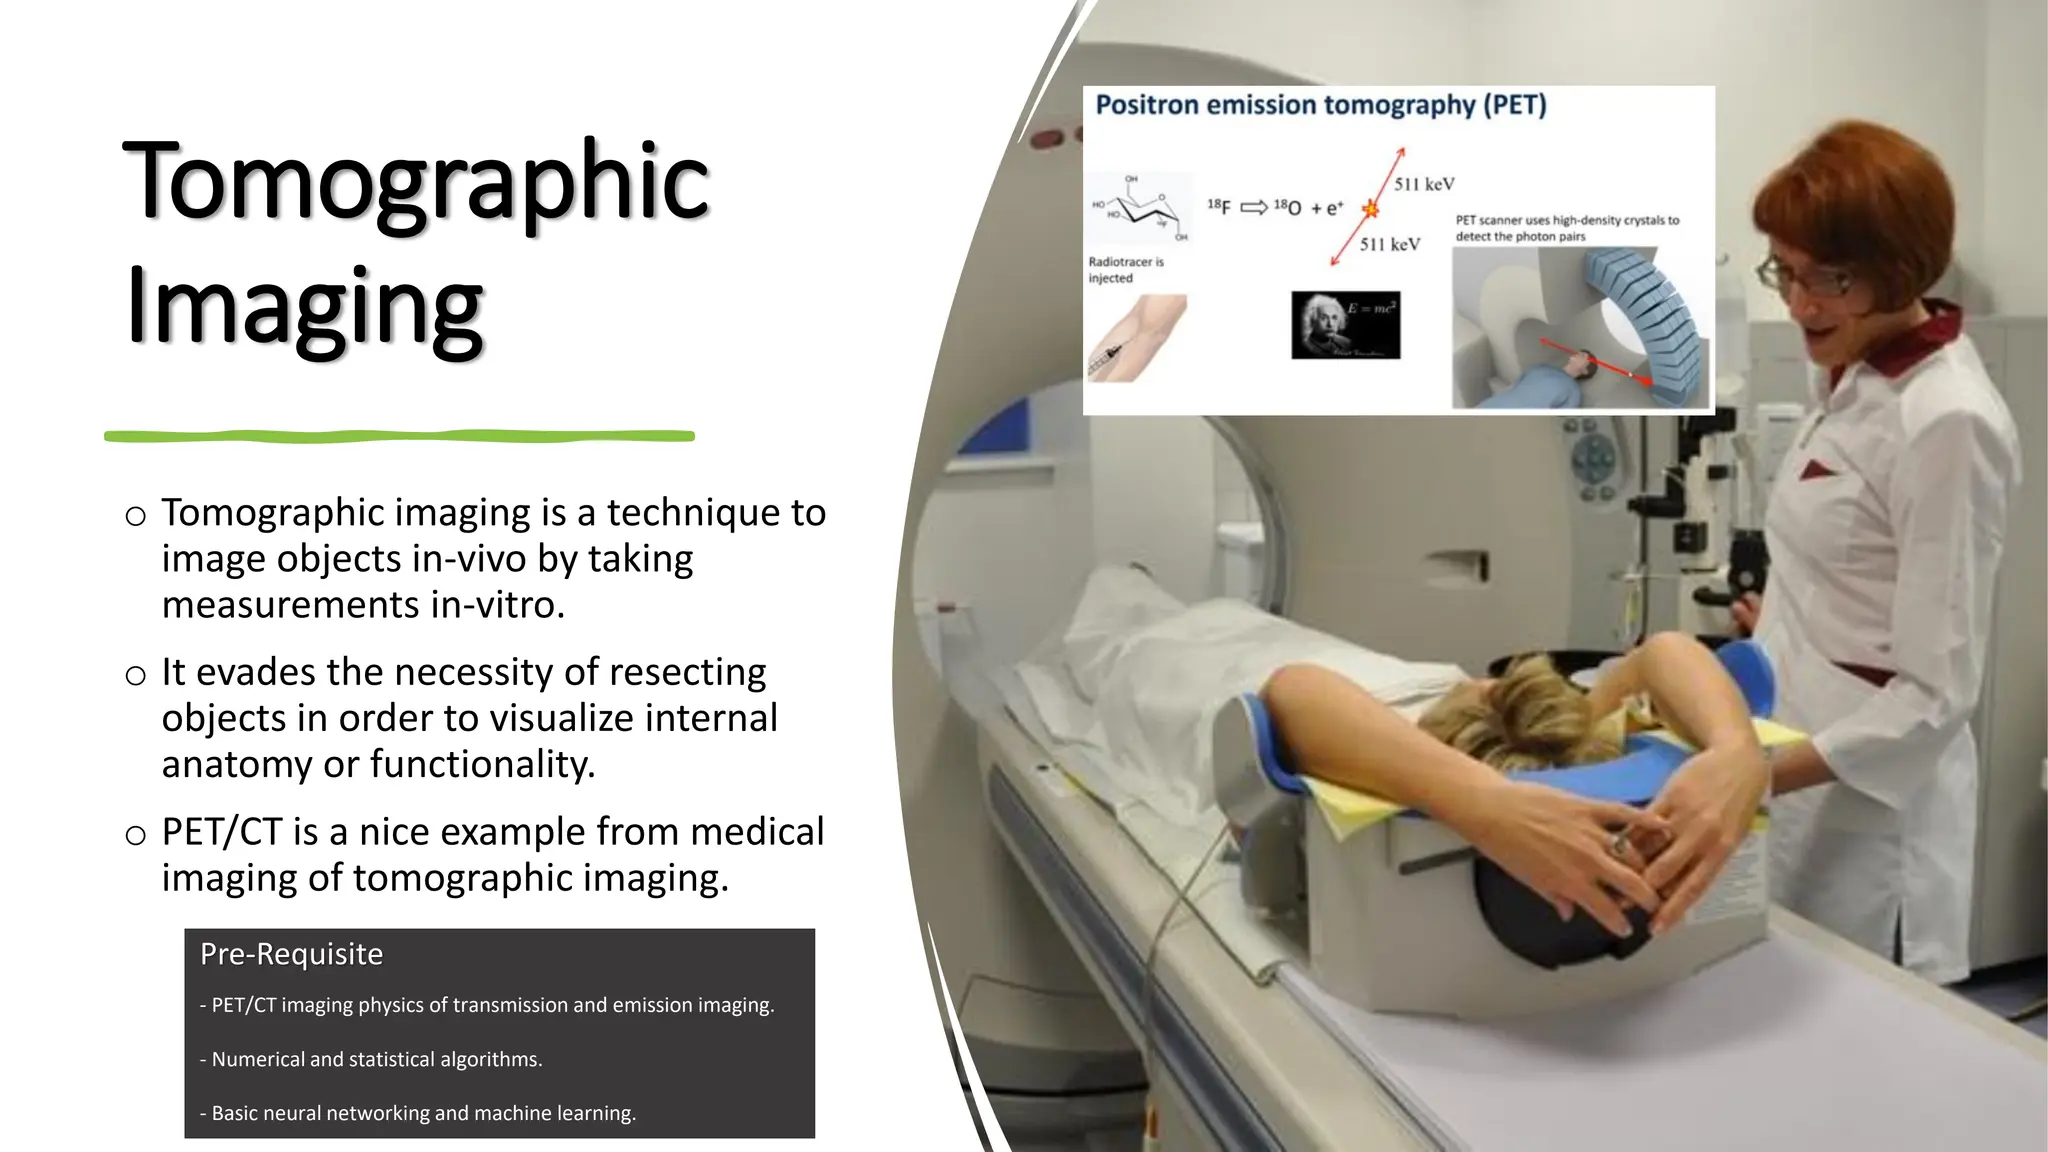
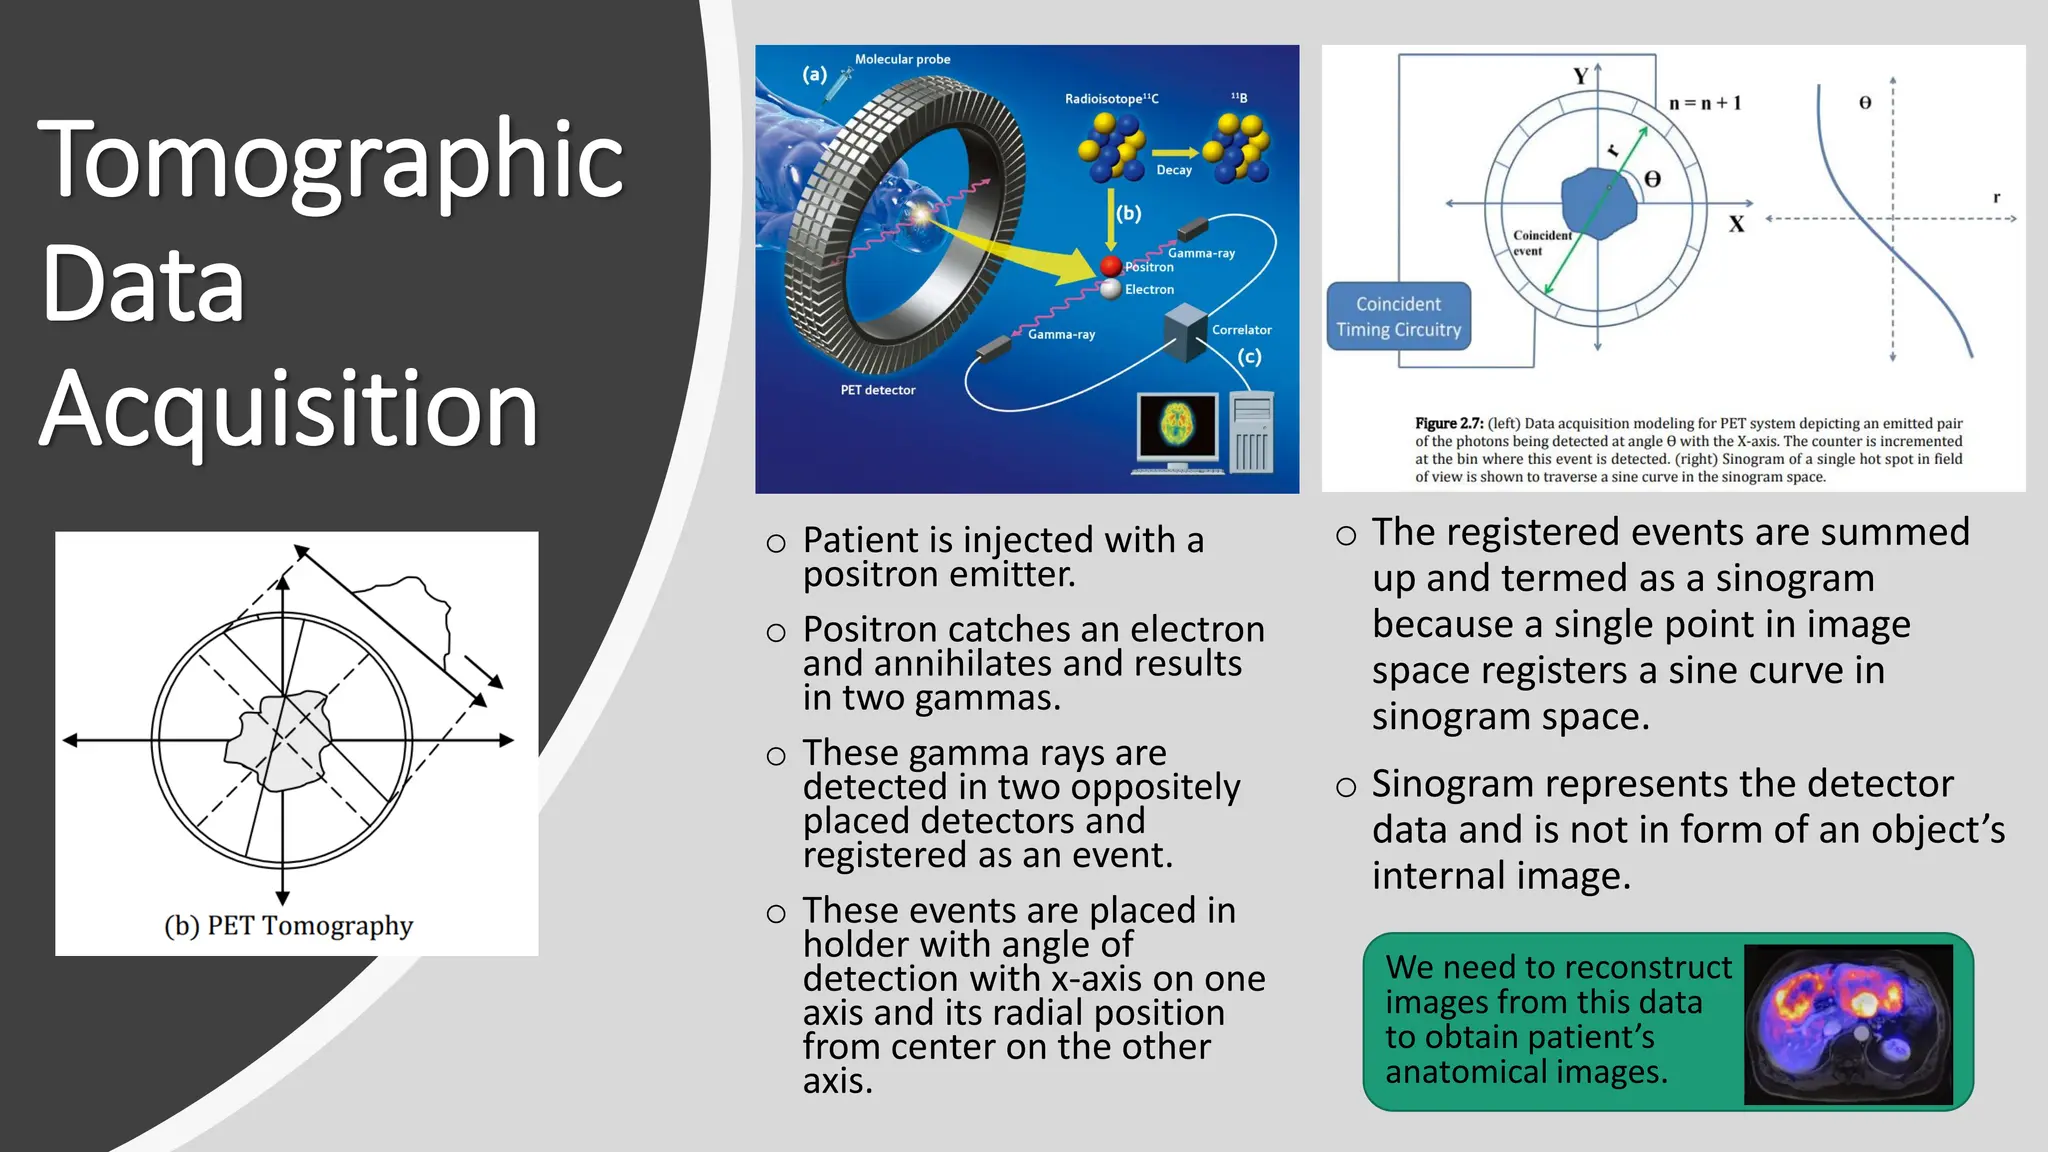
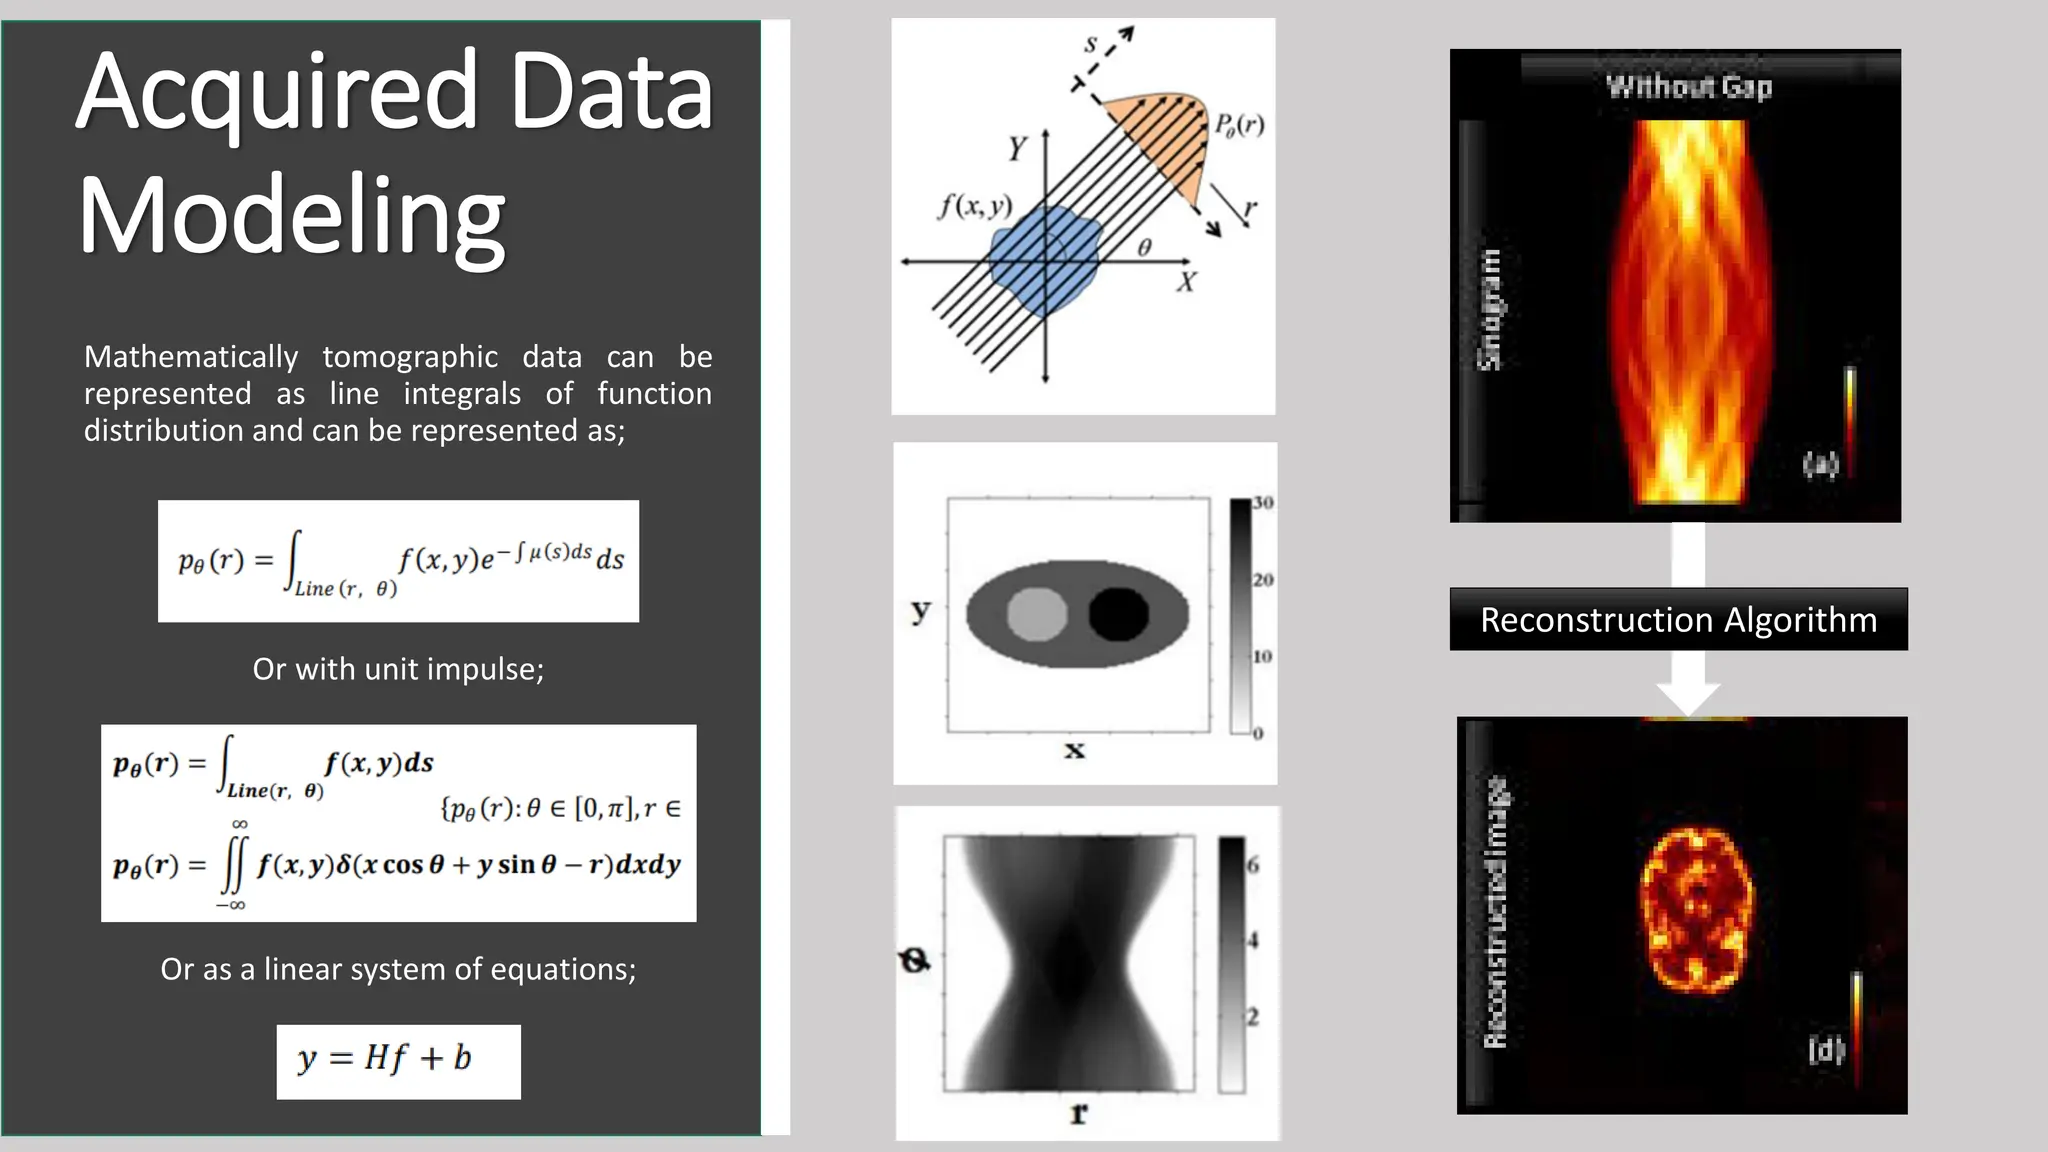
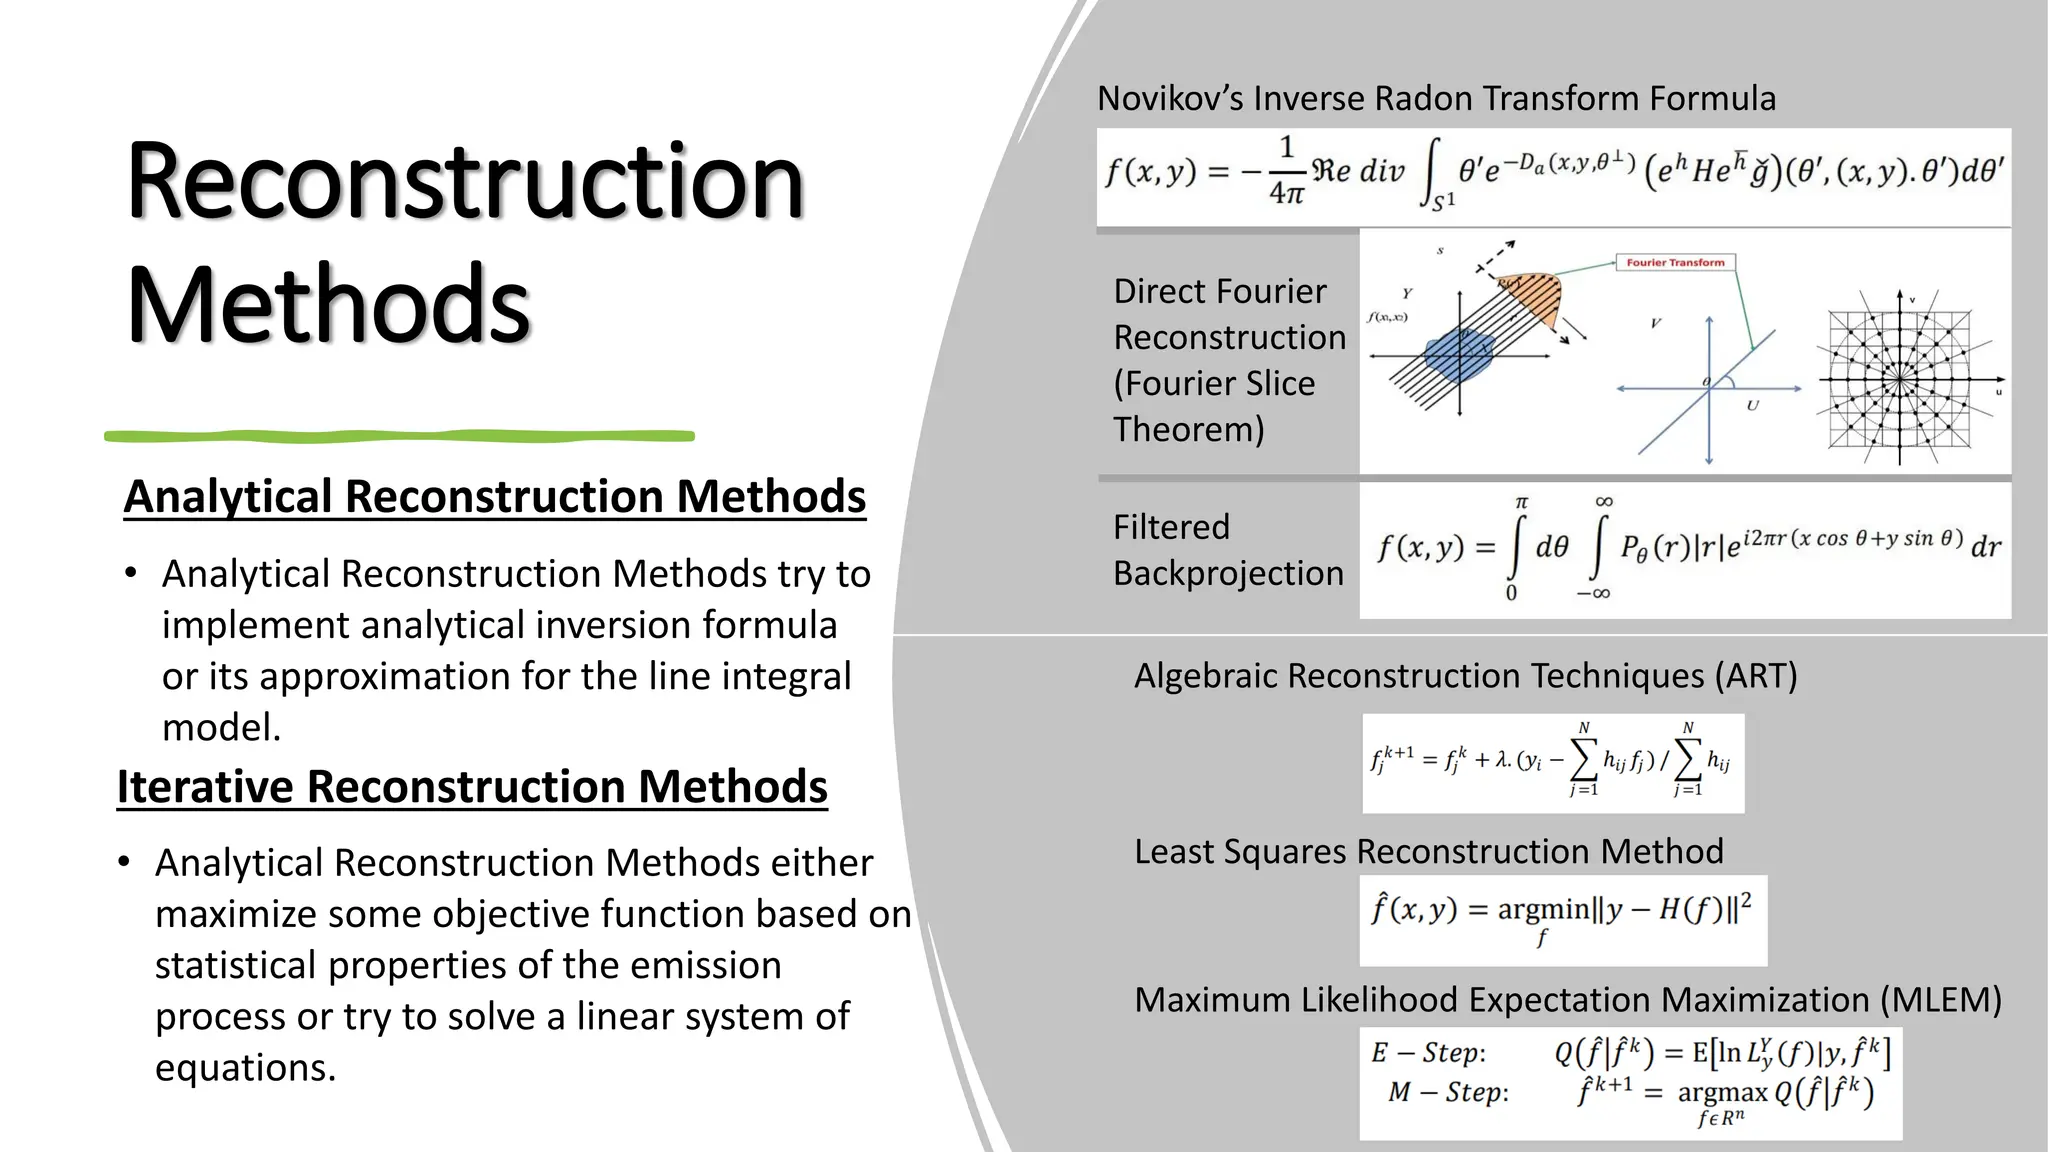
This document discusses using machine learning techniques for tomographic imaging reconstruction and denoising. It begins with an overview of tomographic imaging and PET/CT as an example. It then discusses tomographic data acquisition through PET imaging and sinogram generation. Various analytical and iterative reconstruction methods are described along with their limitations related to noise and ill-posed problems. Neural network approaches for image reconstruction from sinograms, CT image denoising, and mapping iterative reconstruction algorithms to neural networks are proposed to overcome these limitations. Specific network architectures discussed include a simple FBP mapping network, residual learning networks, and networks that unroll iterative algorithms. Applications to PET, SPECT, and developing new techniques like positronium imaging are envisioned.


![Result
output of
FBP
Mapping
to Neural
Network
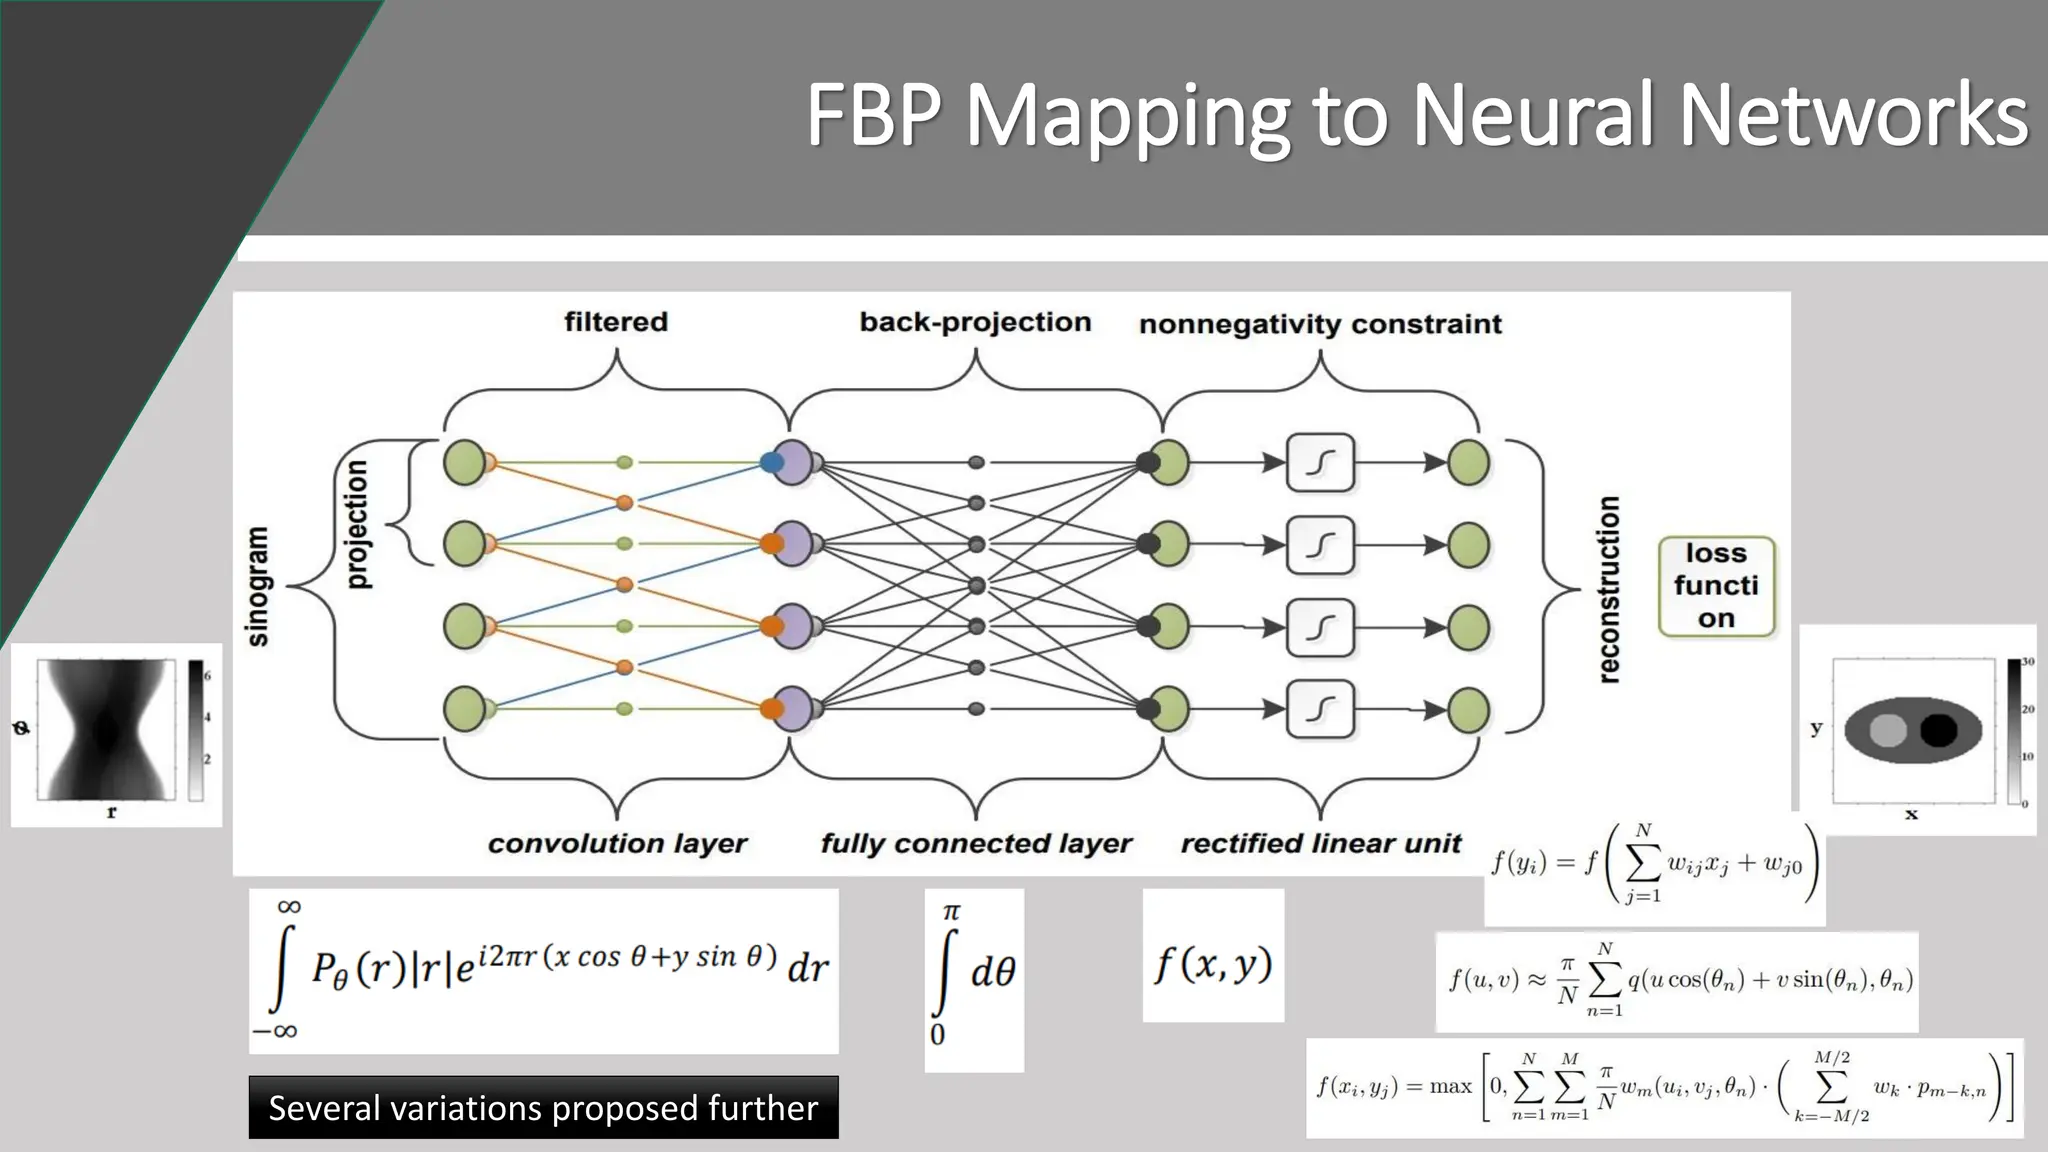
In this simple implementation, sinogram filtering has been performed by a convolutional layers
and to reduce backprojection parameters, all the parameters in this layerwere made un-adjustable
or non-trainable. [Tobias Wurfl et al. 2016, DOI: 10.1007/978-3-319-46726-9_50]
MSE
FBP 0.00531
NN 0.00392](https://image.slidesharecdn.com/mahmad-machinelearningfortomographicimaging-231014040918-c284aac3/75/Machine-learning-for-Tomographic-Imaging-pdf-9-2048.jpg)
![My Favorite FBP Mapping to NN
This model used a very simple network with an initial backprojection step. Each sinogram was backprojected
once and 2D images were generated which were then passed through a CNN network of 15 layers to obtain final
images. [Tobias Wurfl et al. 2016, DOI: 10.1007/978-3-319-46726-9_50]](https://image.slidesharecdn.com/mahmad-machinelearningfortomographicimaging-231014040918-c284aac3/75/Machine-learning-for-Tomographic-Imaging-pdf-10-2048.jpg)
![CT Image
Denoising
CNN based cross network residual encoder model
for low dose CT image denoiser (RED-CNN).
[Hu Chen, Yi Zang, 2017, DOI:
10.1109/TMI.2017.2715284]
Network Model for Image Denoising](https://image.slidesharecdn.com/mahmad-machinelearningfortomographicimaging-231014040918-c284aac3/75/Machine-learning-for-Tomographic-Imaging-pdf-11-2048.jpg)
![Network Model with Denoiser - FBPNet
Filtering has been performed in frequency domain by CNN and denoiser part tries to improve noise
characteristics induced by this filtering. [Bo Wang & Huafeng Liu, 2020, DOI: 10.1088/1361-6560/abc09d]](https://image.slidesharecdn.com/mahmad-machinelearningfortomographicimaging-231014040918-c284aac3/75/Machine-learning-for-Tomographic-Imaging-pdf-12-2048.jpg)
![Result
output of
FBP
Mapping
to Neural
Network Filtering has been performed in frequency domain by
CNN and denoiser part tries to improve noise
characteristics induced by this filtering. [Bo Wang &
Huafeng Liu, 2020, DOI: 10.1088/1361-6560/abc09d]](https://image.slidesharecdn.com/mahmad-machinelearningfortomographicimaging-231014040918-c284aac3/75/Machine-learning-for-Tomographic-Imaging-pdf-13-2048.jpg)
![Network Model with Residual Learning
Unrolled Log-likelihood reconstruction method uses EM updates as input and then they may further be passed through
penalty and again EM update may be used with denoising model.
[Hu Chen, Yi Zang, 2017, DOI: 10.1109/TMI.2017.2715284]](https://image.slidesharecdn.com/mahmad-machinelearningfortomographicimaging-231014040918-c284aac3/75/Machine-learning-for-Tomographic-Imaging-pdf-14-2048.jpg)
![Iterative
PET
Recon
Mapping
to
Neural
Network
[Kuang Gong, et.al., 2018,
DOI: 10.1109/TMI.2018.2869871]
Use GA for opt.
ADMM](https://image.slidesharecdn.com/mahmad-machinelearningfortomographicimaging-231014040918-c284aac3/75/Machine-learning-for-Tomographic-Imaging-pdf-15-2048.jpg)
![[A J Reader et al., 2021, DOI: 10.1109/TRPMS.2020.3014786]](https://image.slidesharecdn.com/mahmad-machinelearningfortomographicimaging-231014040918-c284aac3/75/Machine-learning-for-Tomographic-Imaging-pdf-16-2048.jpg)
![[A J Reader et al., 2021, DOI: 10.1109/TRPMS.2020.3014786]
Network
Architectures](https://image.slidesharecdn.com/mahmad-machinelearningfortomographicimaging-231014040918-c284aac3/75/Machine-learning-for-Tomographic-Imaging-pdf-17-2048.jpg)
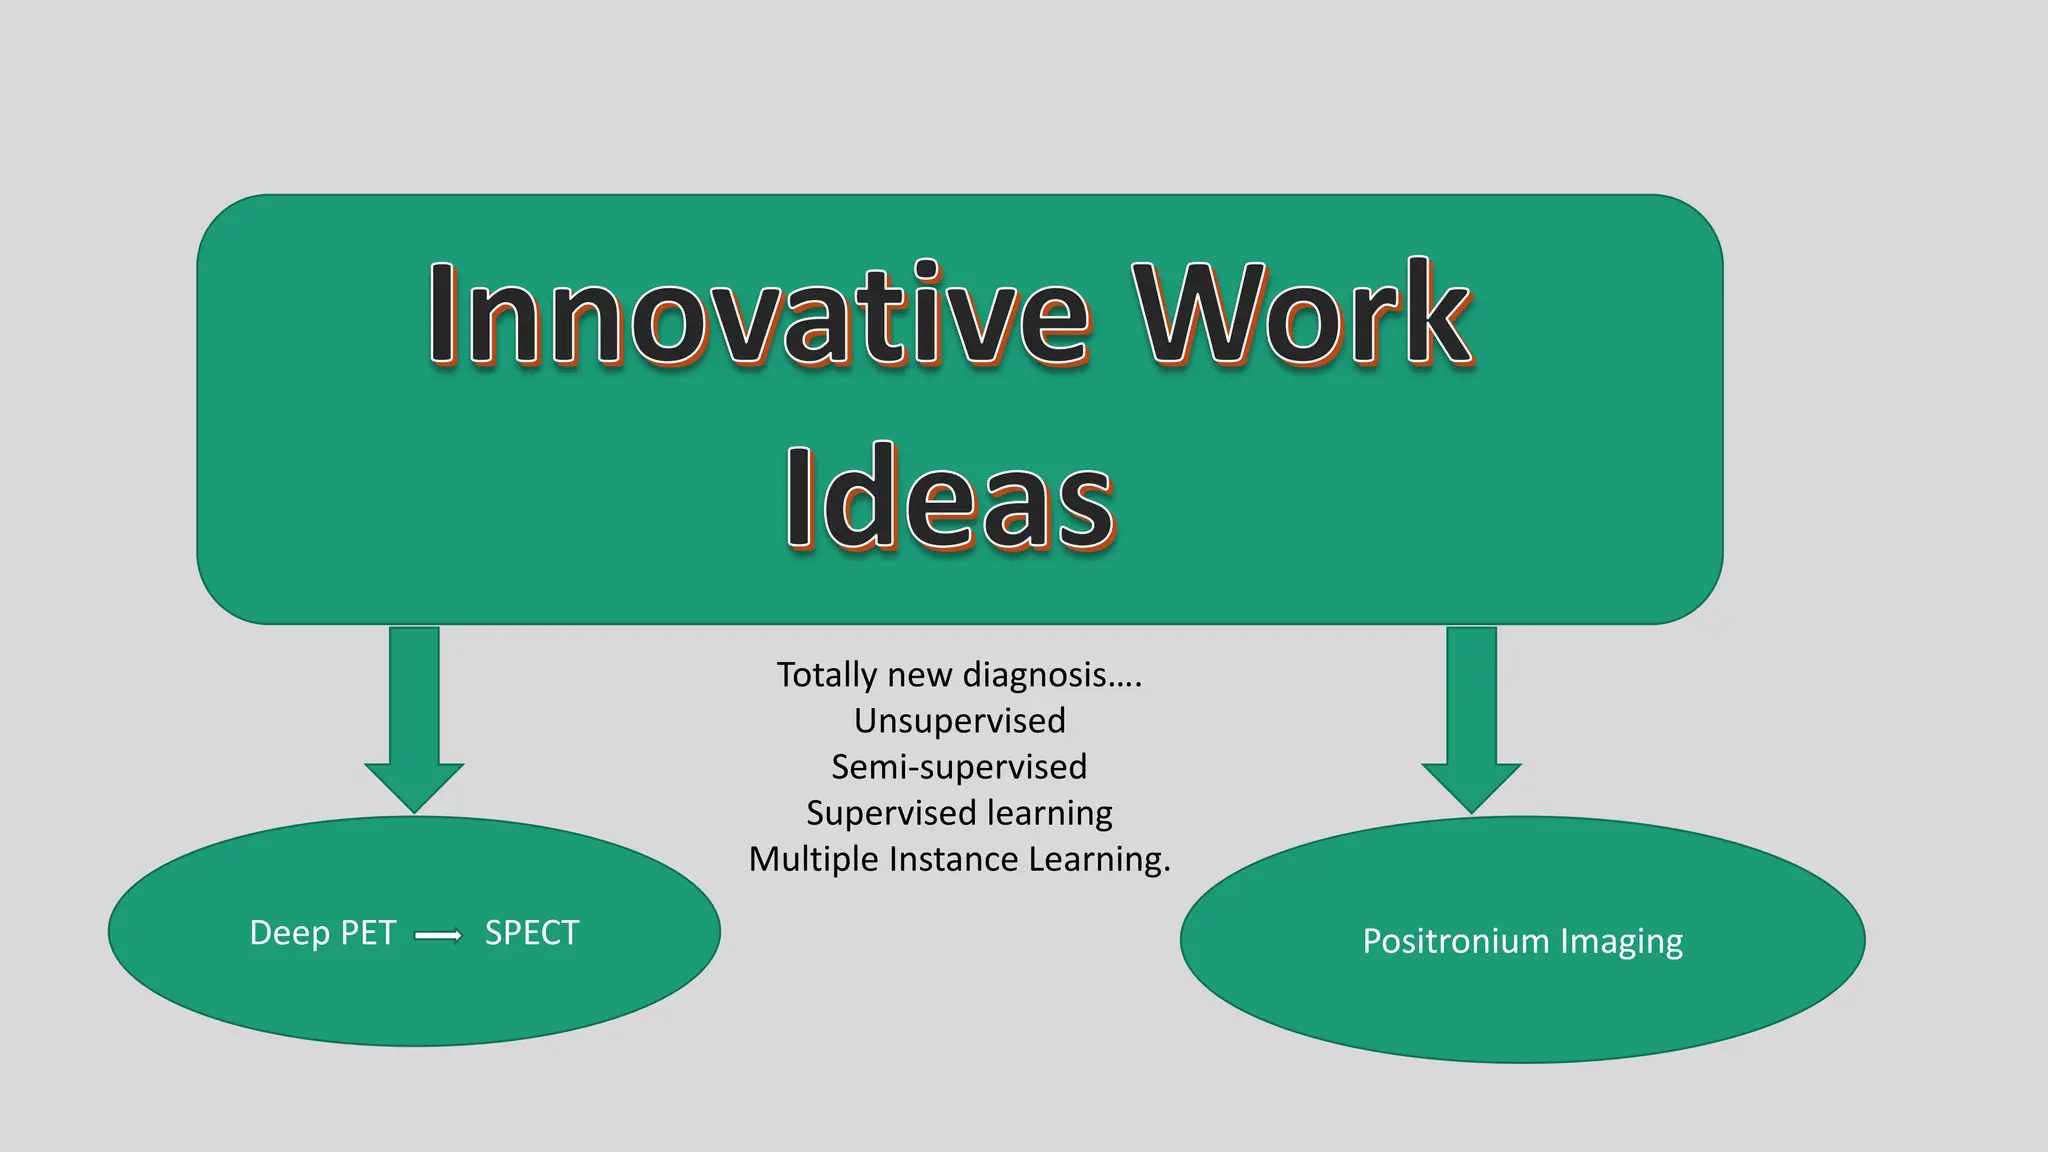
![Positronium
Imaging
[Powel Moskel et al., 2021, DOI:
10.1126/sciadv.abh4394]
Tumour
Infection
Inflammation](https://image.slidesharecdn.com/mahmad-machinelearningfortomographicimaging-231014040918-c284aac3/75/Machine-learning-for-Tomographic-Imaging-pdf-19-2048.jpg)
![Deep
PET
Imaging
with ToF
[Sun II Kwon et al., 2021, DOI:
10.1038/s41566-021-00871-2]
My vision is to
use this for
SPECT, if
possible.](https://image.slidesharecdn.com/mahmad-machinelearningfortomographicimaging-231014040918-c284aac3/75/Machine-learning-for-Tomographic-Imaging-pdf-20-2048.jpg)