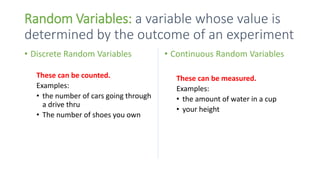
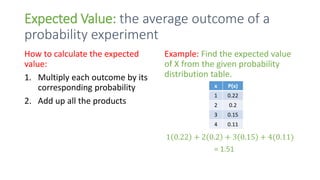
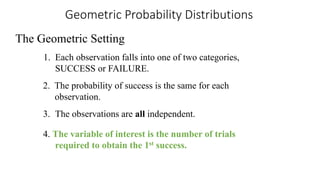
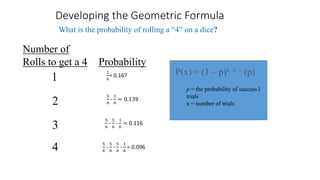
Module 6 Lesson 6
Random Variables and Expected Values
Random Variables: a variable whose value is
determined by the outcome of an experiment
• Discrete Random Variables
These can be counted.
Examples:
• the number of cars going through
a drive thru
• The number of shoes you own
• Continuous Random Variables
These can be measured.
Examples:
• the amount of water in a cup
• your height
Expected Value: the average outcome of a
probability experiment
How to calculate the expected
value:
1. Multiply each outcome by its
corresponding probability
2. Add up all the products
Example: Find the expected value
of X from the given probability
distribution table.
1 0.22 + 2 0.2 + 3 0.15 + 4(0.11)
= 1.51
x P(x)
1 0.22
2 0.2
3 0.15
4 0.11
Geometric Probability Distributions
The Geometric Setting
4. The variable of interest is the number of trials
required to obtain the 1st success.
1. Each observation falls into one of two categories,
SUCCESS or FAILURE.
2. The probability of success is the same for each
observation.
3. The observations are all independent.
Developing the Geometric Formula
Number of
Rolls to get a 4 Probability
1
2
3
4
What is the probability of rolling a “4” on a dice?
p = the probability of success l
trials
x = number of trials
P(x) = (1 – p)x -1 · (p)1
6
= 0.167
5
6
∙
1
6
= 0.139
5
6
∙
5
6
∙
1
6
= 0.116
5
6
∙
5
6
∙
5
6
∙
1
6
= 0.096
Example 1:
• Blood type is inherited. If both parents carry genes for the O and A
blood types, each child has probability 0.25 of getting two O genes
and so of having blood type O. Different children inherit
independently of each other. We wish to find the probability that the
first child these parents have with type O blood is their third child.
P(O blood) = 0.25
P(other blood type) = 1-P(O blood) = 1- 0.25 = 0.75
P(3rd child has O blood): failure, failure, success
P(3rd child) = 0.75 ∙ 0.75 ∙ 0.25 = 0.141
The parents have a 14.1% chance of their 3rd child have
type O blood.
image: “blood” by qimono at pixabay.com, license CCO Public Domain
Example 2:
• Suppose we have data that suggest that 3% of a company’s hard disc
drives are defective. You have been asked to determine the
probability that the first defective hard drive is the fifth unit tested.
Probability (defective) = 0.03
Probability (works) = 1-P(defective) = 1-.03 = 0.97
P(5th defective) = works ∙ work ∙ work ∙ work ∙ defective
P(5th defective) = 0.97 ∙ 0.97 ∙ 0.97 ∙ 0.97 ∙ 0.03 = 0.027
There is a 2.7% chance that the fifth hard drive will be the
first defective.
image: “girl” by Concord90 at pixabay.com, license CCO Public Domain

Random Variables and Geometric Probability

  • 1.
    Module 6 Lesson6 Random Variables and Expected Values
  • 2.
    Random Variables: avariable whose value is determined by the outcome of an experiment • Discrete Random Variables These can be counted. Examples: • the number of cars going through a drive thru • The number of shoes you own • Continuous Random Variables These can be measured. Examples: • the amount of water in a cup • your height
  • 3.
    Expected Value: theaverage outcome of a probability experiment How to calculate the expected value: 1. Multiply each outcome by its corresponding probability 2. Add up all the products Example: Find the expected value of X from the given probability distribution table. 1 0.22 + 2 0.2 + 3 0.15 + 4(0.11) = 1.51 x P(x) 1 0.22 2 0.2 3 0.15 4 0.11
  • 4.
    Geometric Probability Distributions TheGeometric Setting 4. The variable of interest is the number of trials required to obtain the 1st success. 1. Each observation falls into one of two categories, SUCCESS or FAILURE. 2. The probability of success is the same for each observation. 3. The observations are all independent.
  • 5.
    Developing the GeometricFormula Number of Rolls to get a 4 Probability 1 2 3 4 What is the probability of rolling a “4” on a dice? p = the probability of success l trials x = number of trials P(x) = (1 – p)x -1 · (p)1 6 = 0.167 5 6 ∙ 1 6 = 0.139 5 6 ∙ 5 6 ∙ 1 6 = 0.116 5 6 ∙ 5 6 ∙ 5 6 ∙ 1 6 = 0.096
  • 6.
    Example 1: • Bloodtype is inherited. If both parents carry genes for the O and A blood types, each child has probability 0.25 of getting two O genes and so of having blood type O. Different children inherit independently of each other. We wish to find the probability that the first child these parents have with type O blood is their third child. P(O blood) = 0.25 P(other blood type) = 1-P(O blood) = 1- 0.25 = 0.75 P(3rd child has O blood): failure, failure, success P(3rd child) = 0.75 ∙ 0.75 ∙ 0.25 = 0.141 The parents have a 14.1% chance of their 3rd child have type O blood. image: “blood” by qimono at pixabay.com, license CCO Public Domain
  • 7.
    Example 2: • Supposewe have data that suggest that 3% of a company’s hard disc drives are defective. You have been asked to determine the probability that the first defective hard drive is the fifth unit tested. Probability (defective) = 0.03 Probability (works) = 1-P(defective) = 1-.03 = 0.97 P(5th defective) = works ∙ work ∙ work ∙ work ∙ defective P(5th defective) = 0.97 ∙ 0.97 ∙ 0.97 ∙ 0.97 ∙ 0.03 = 0.027 There is a 2.7% chance that the fifth hard drive will be the first defective. image: “girl” by Concord90 at pixabay.com, license CCO Public Domain