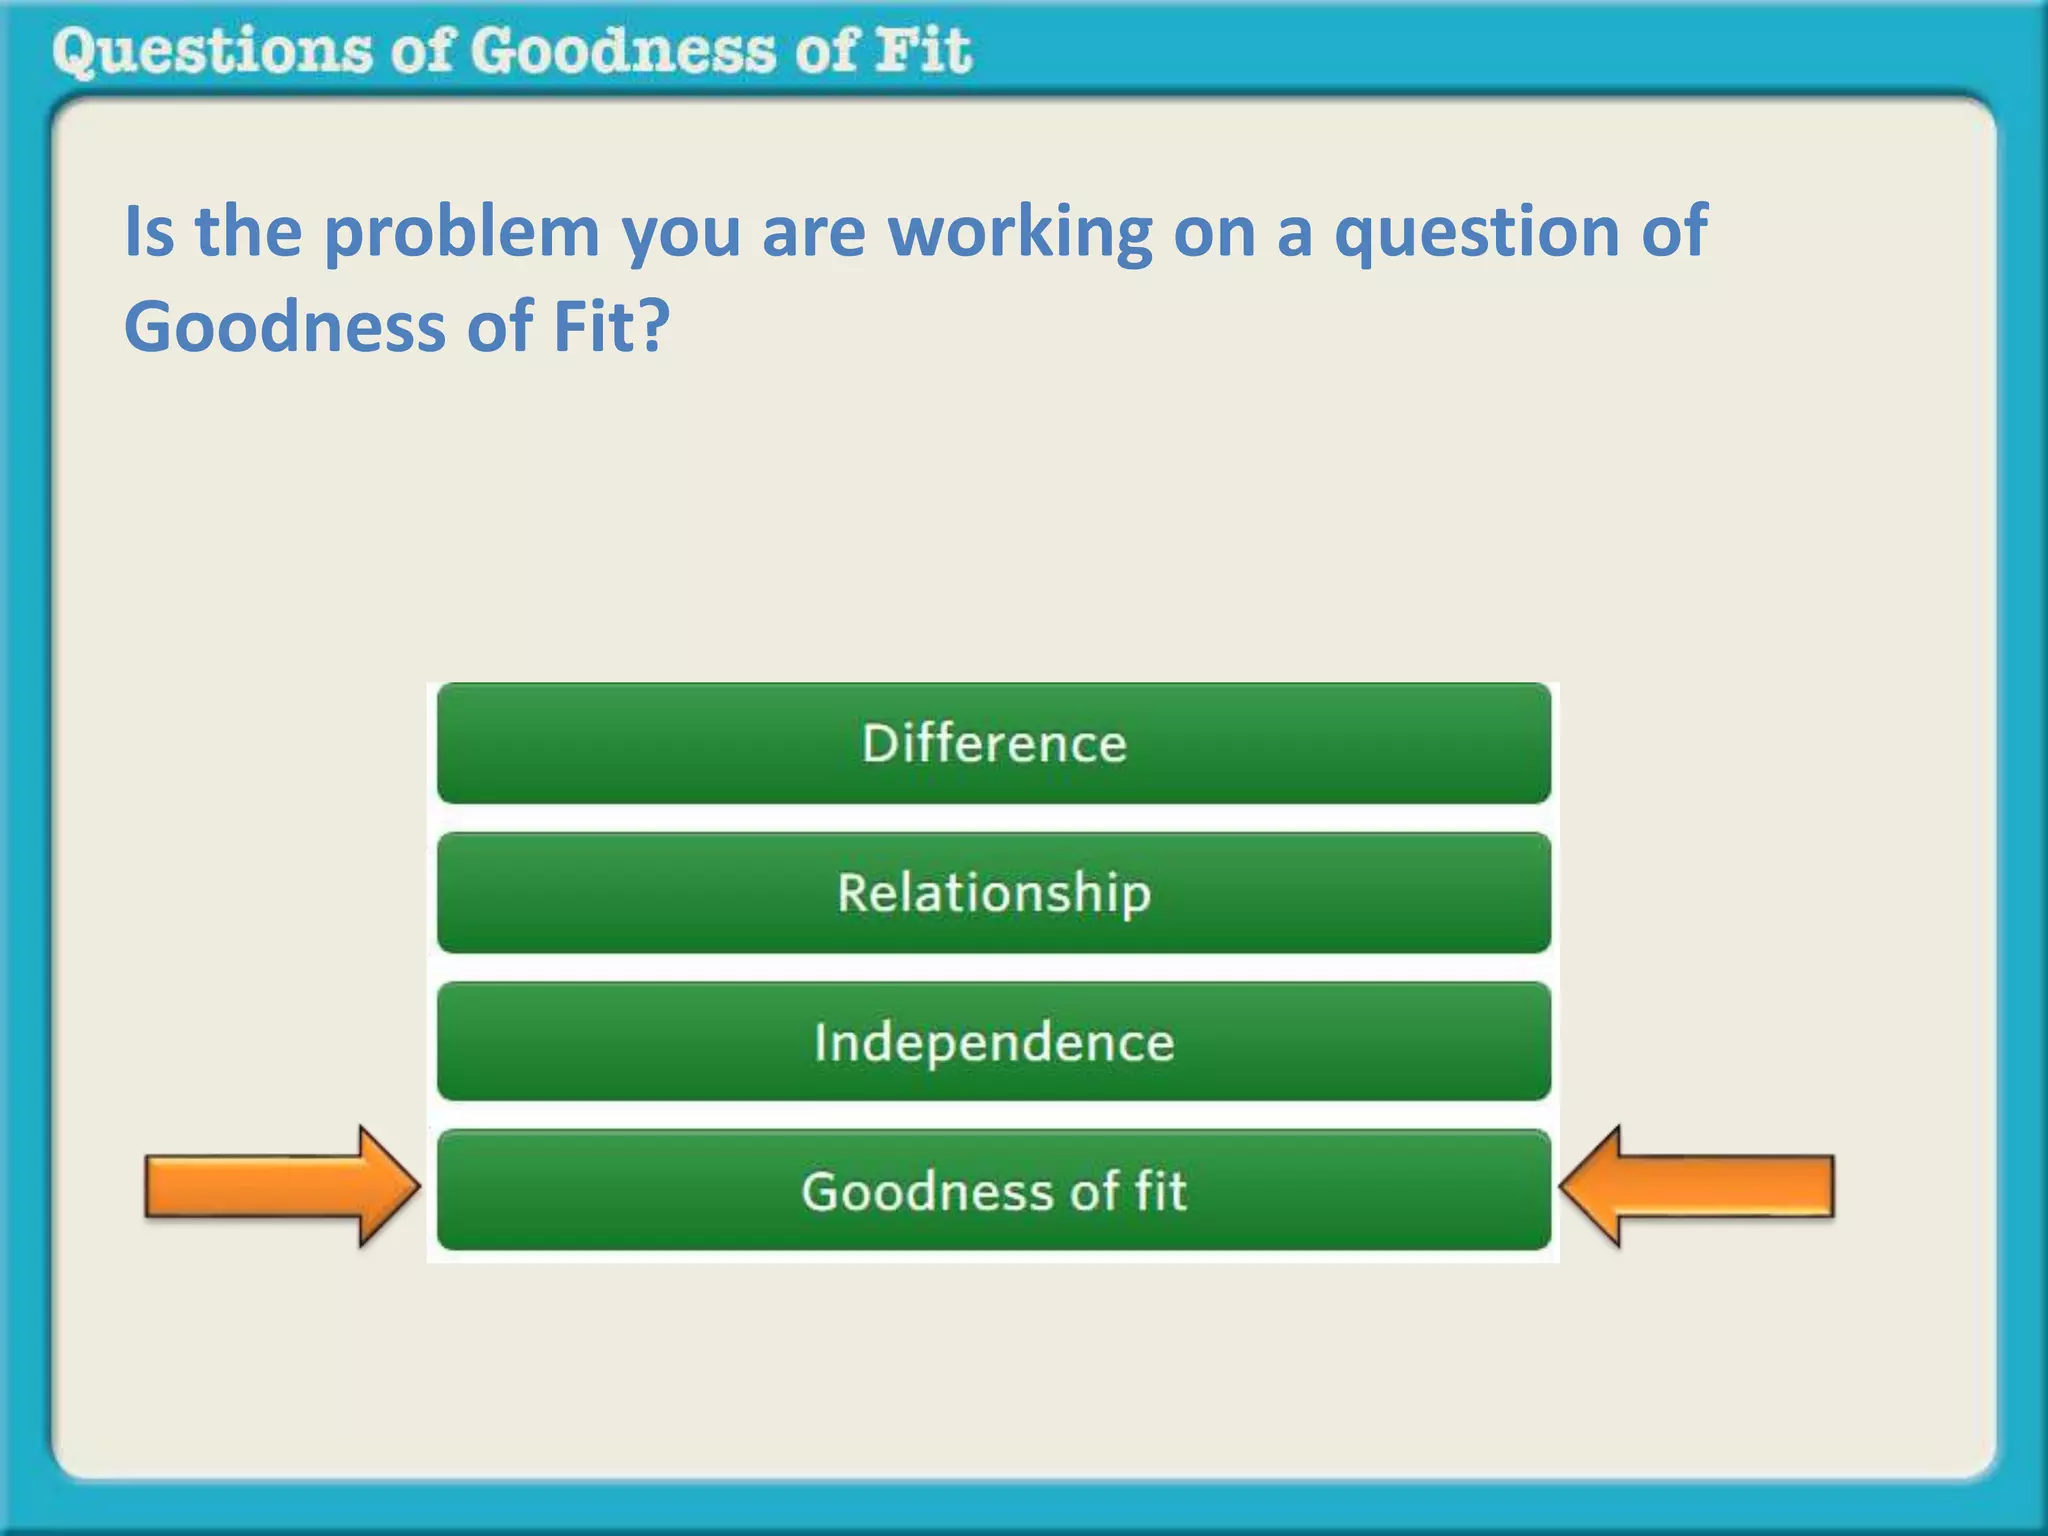
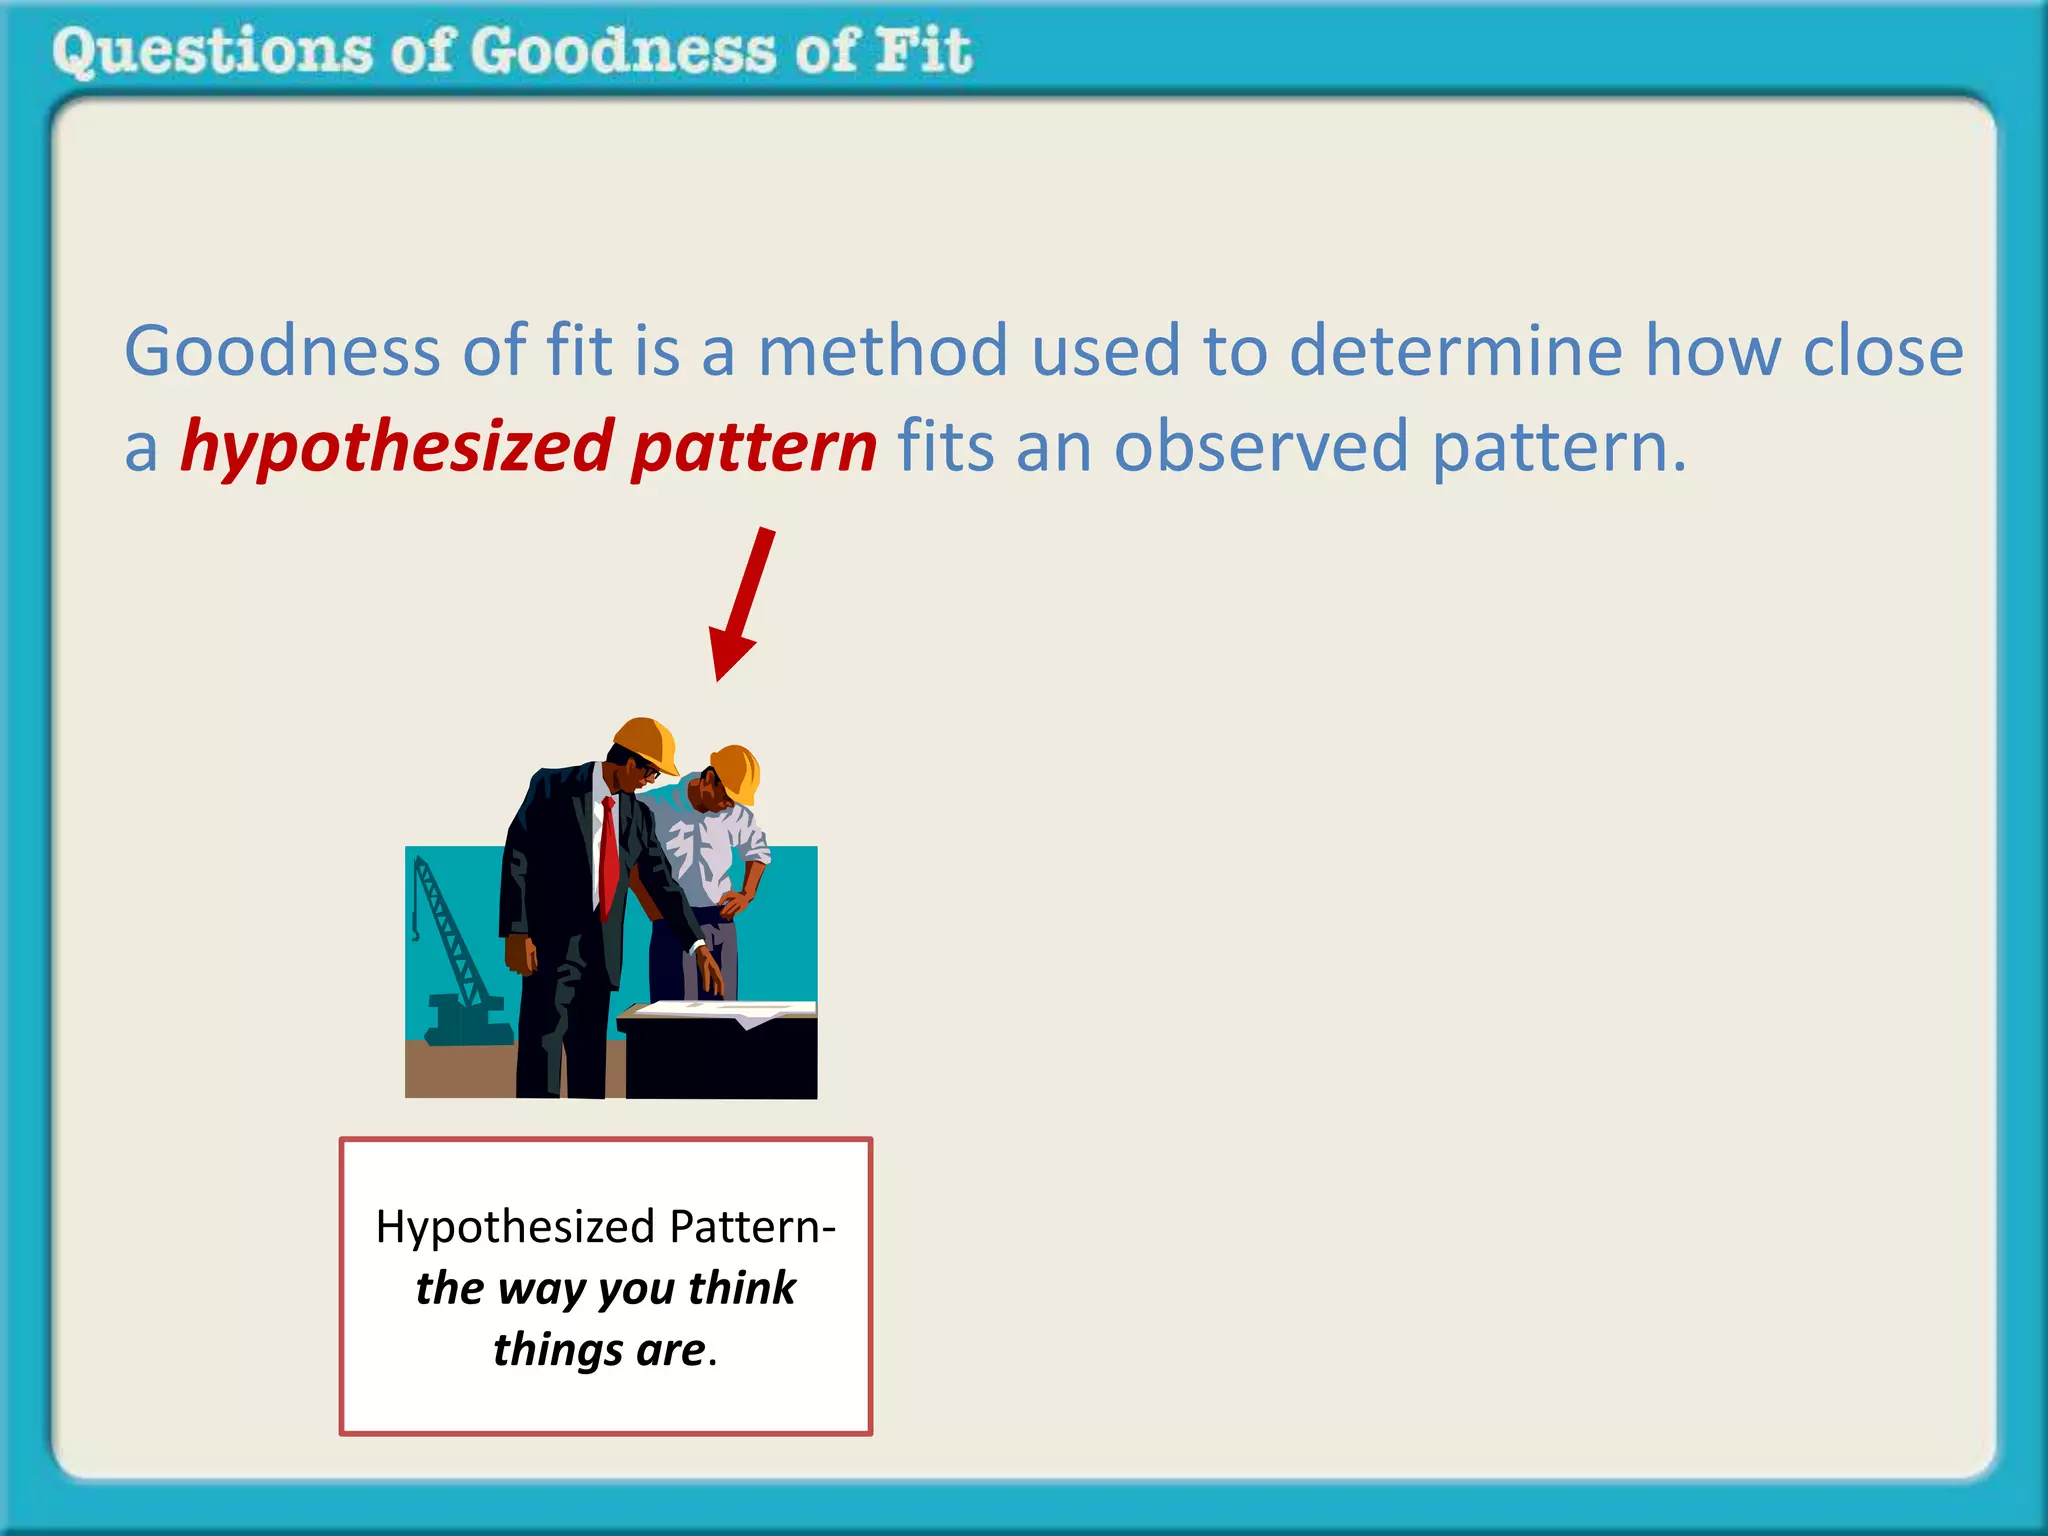
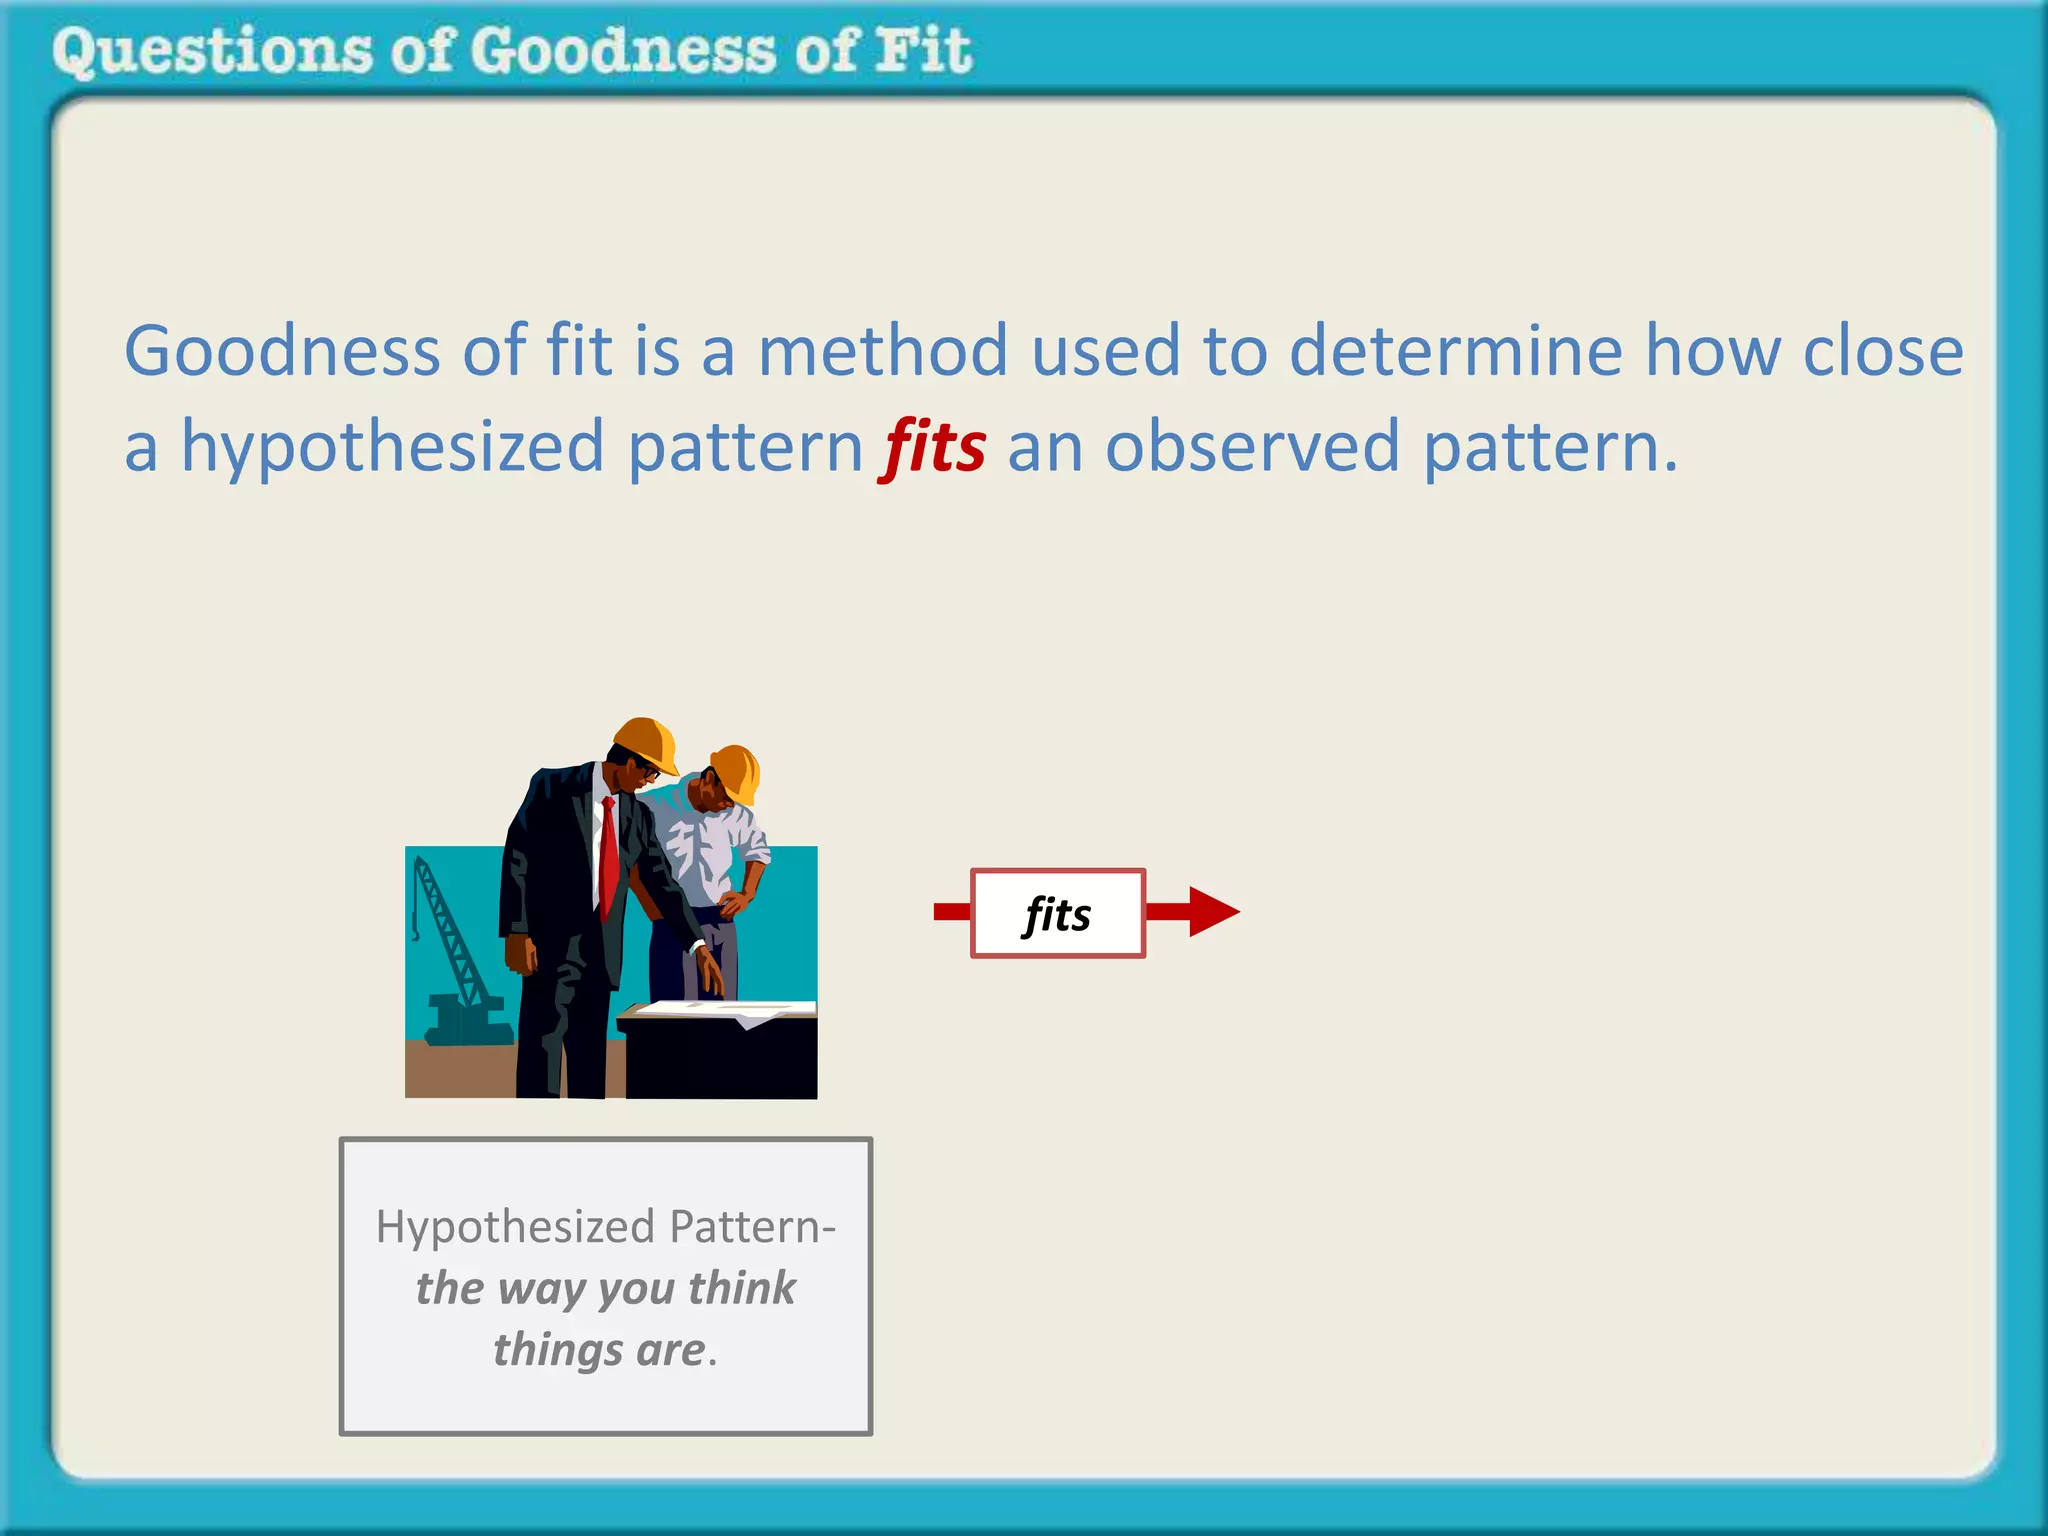
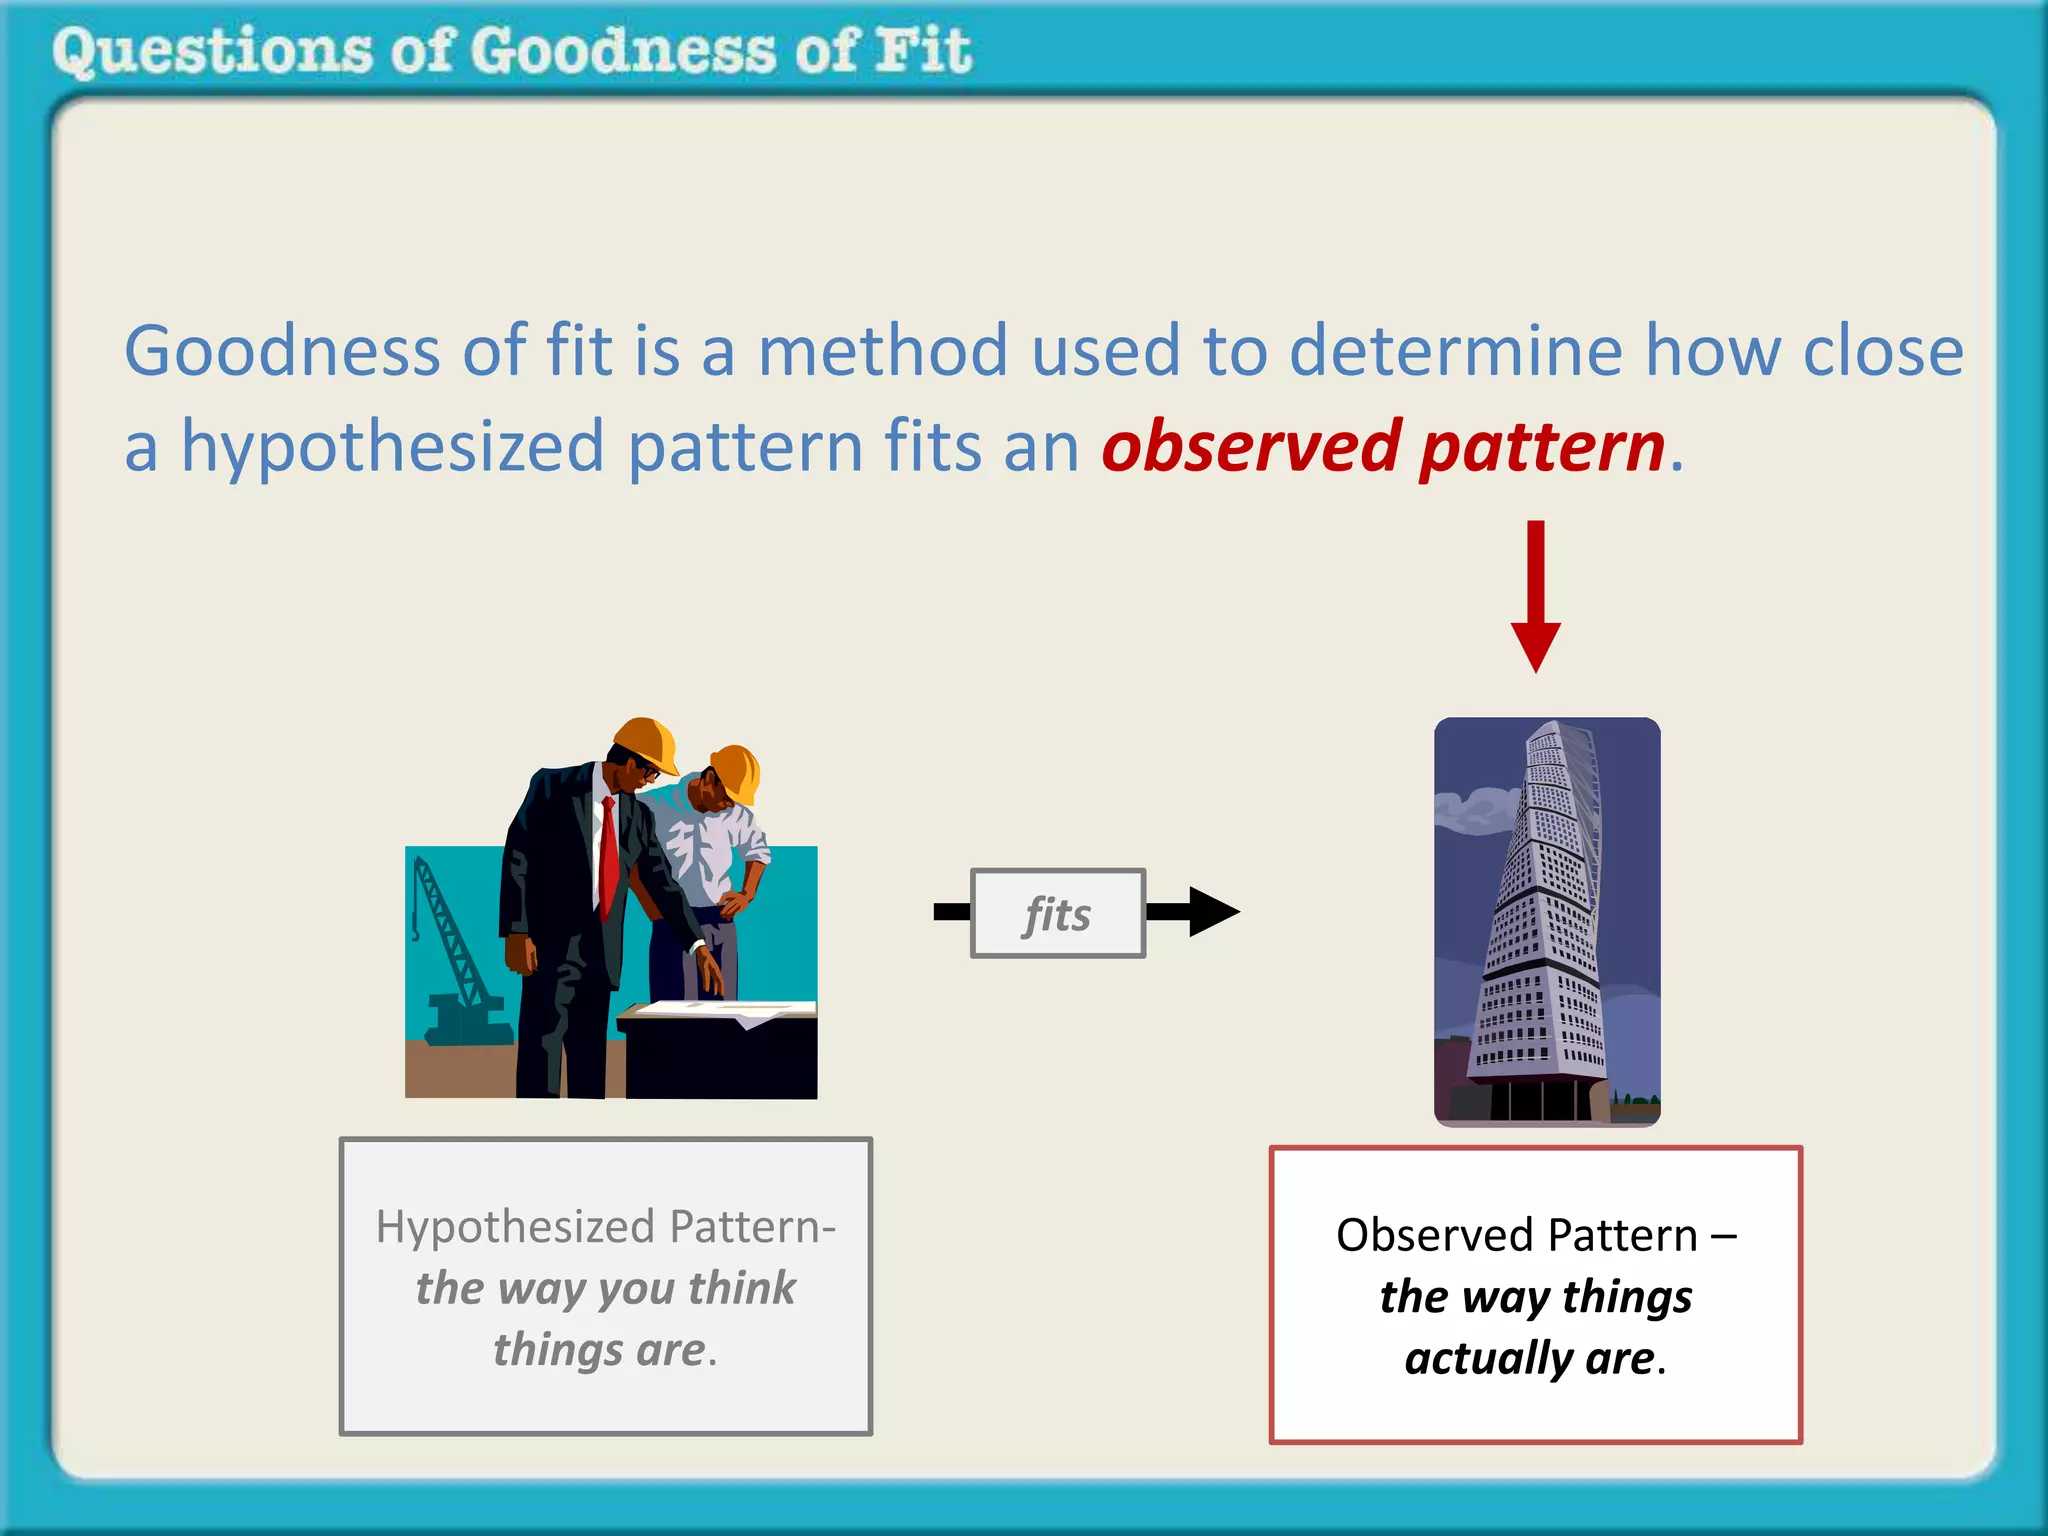
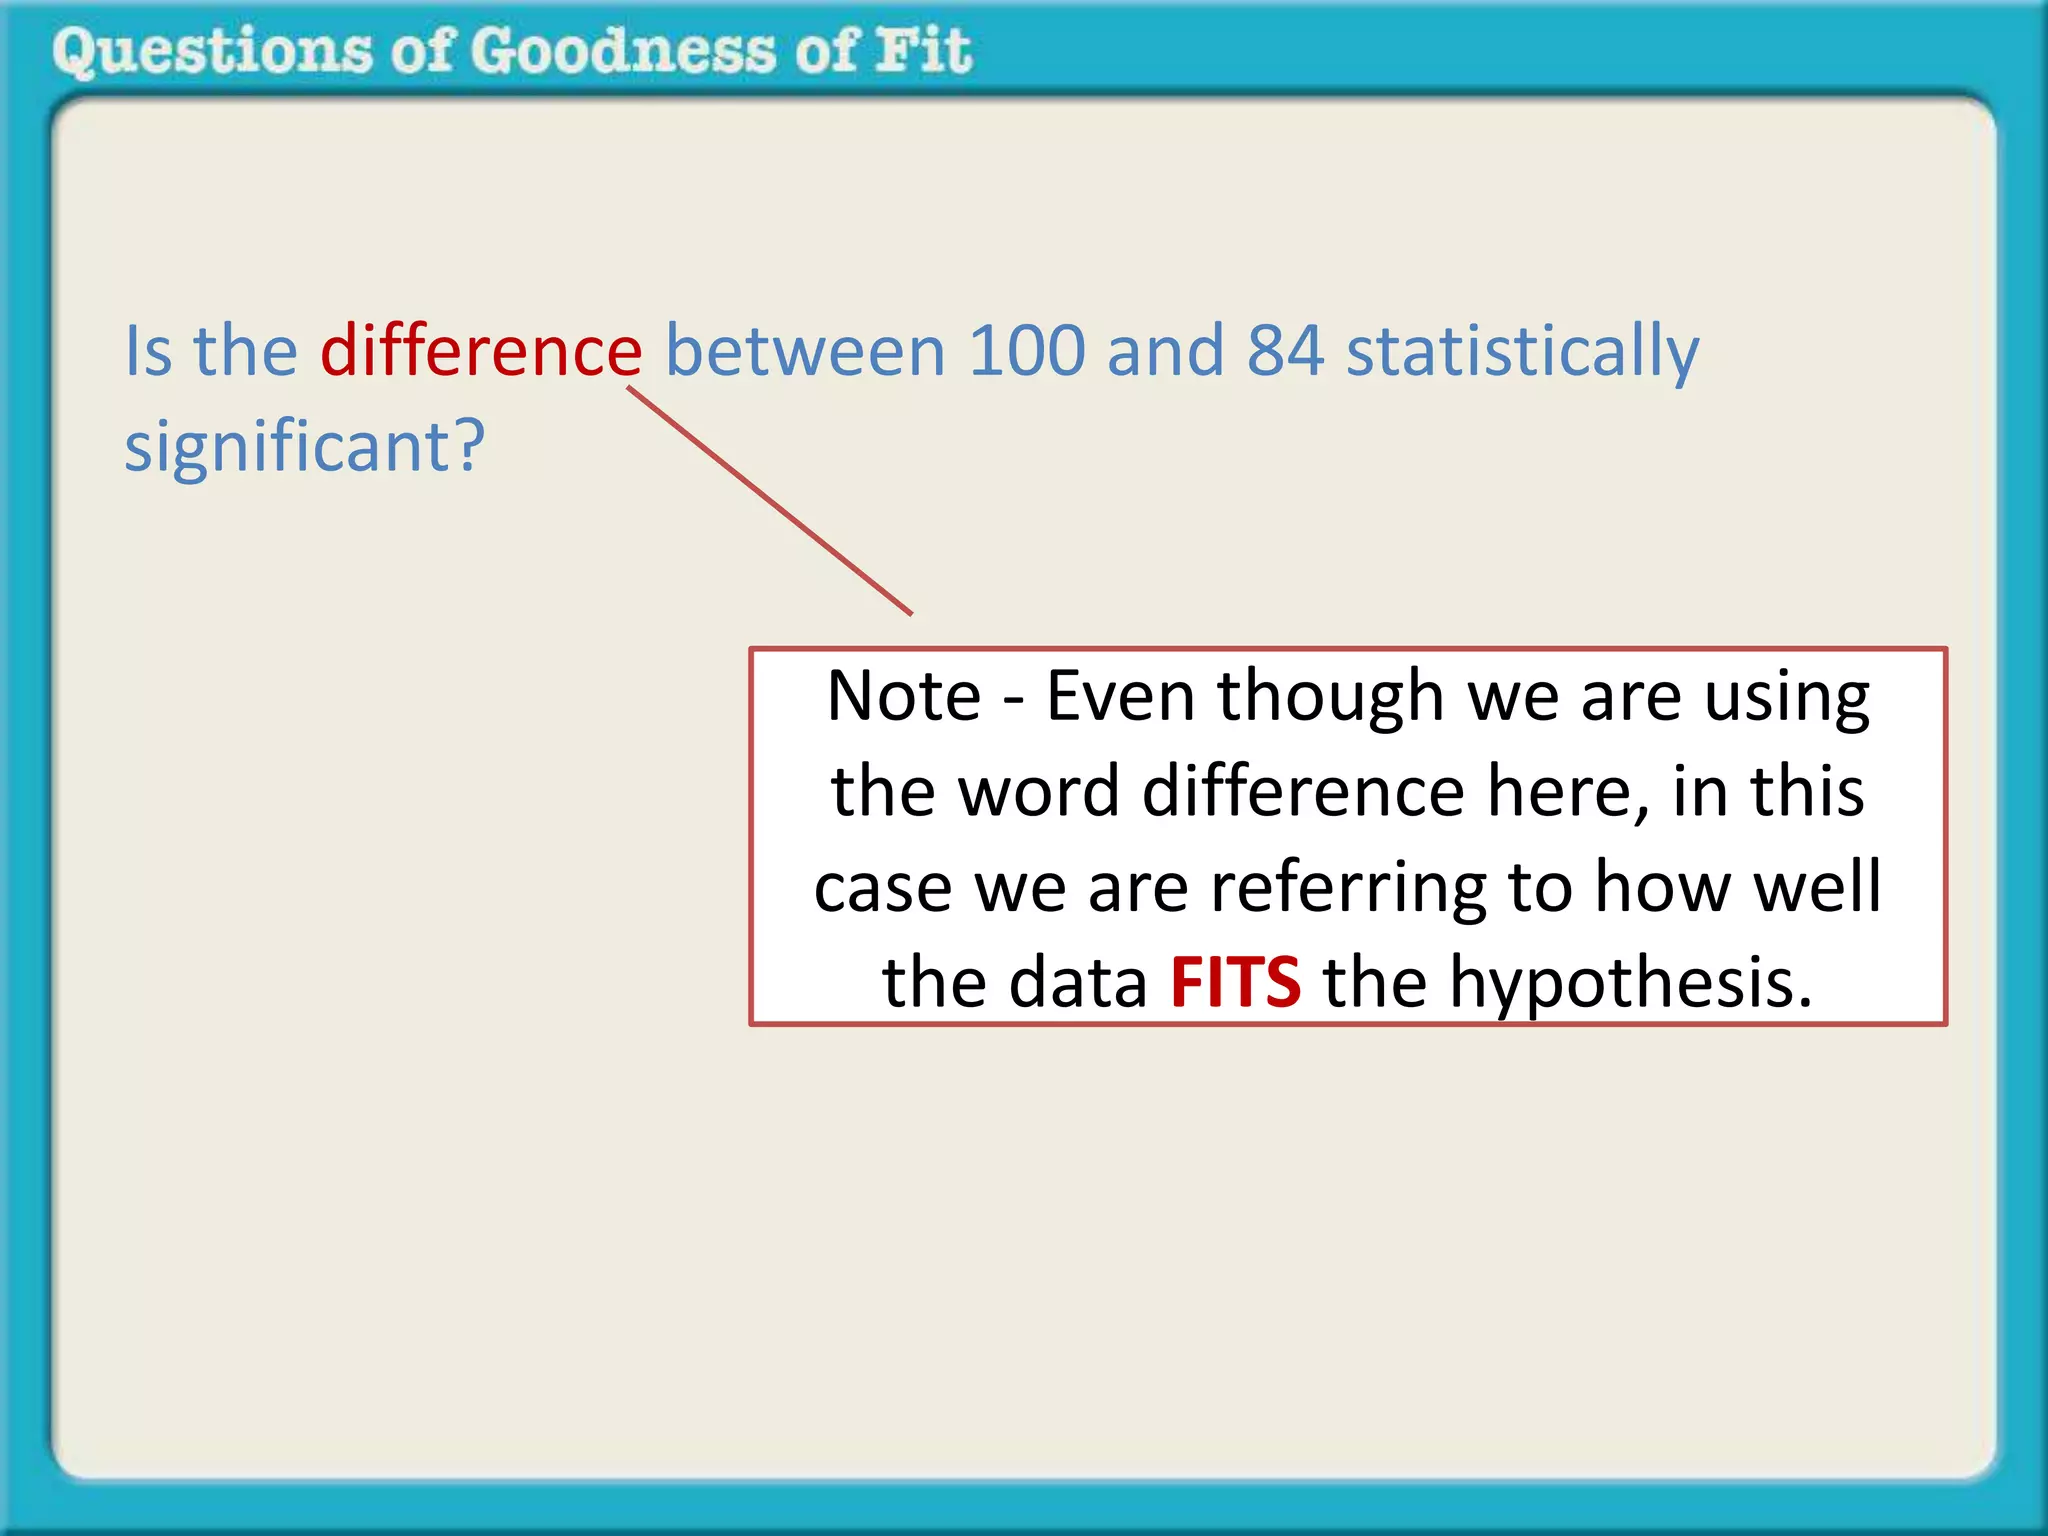
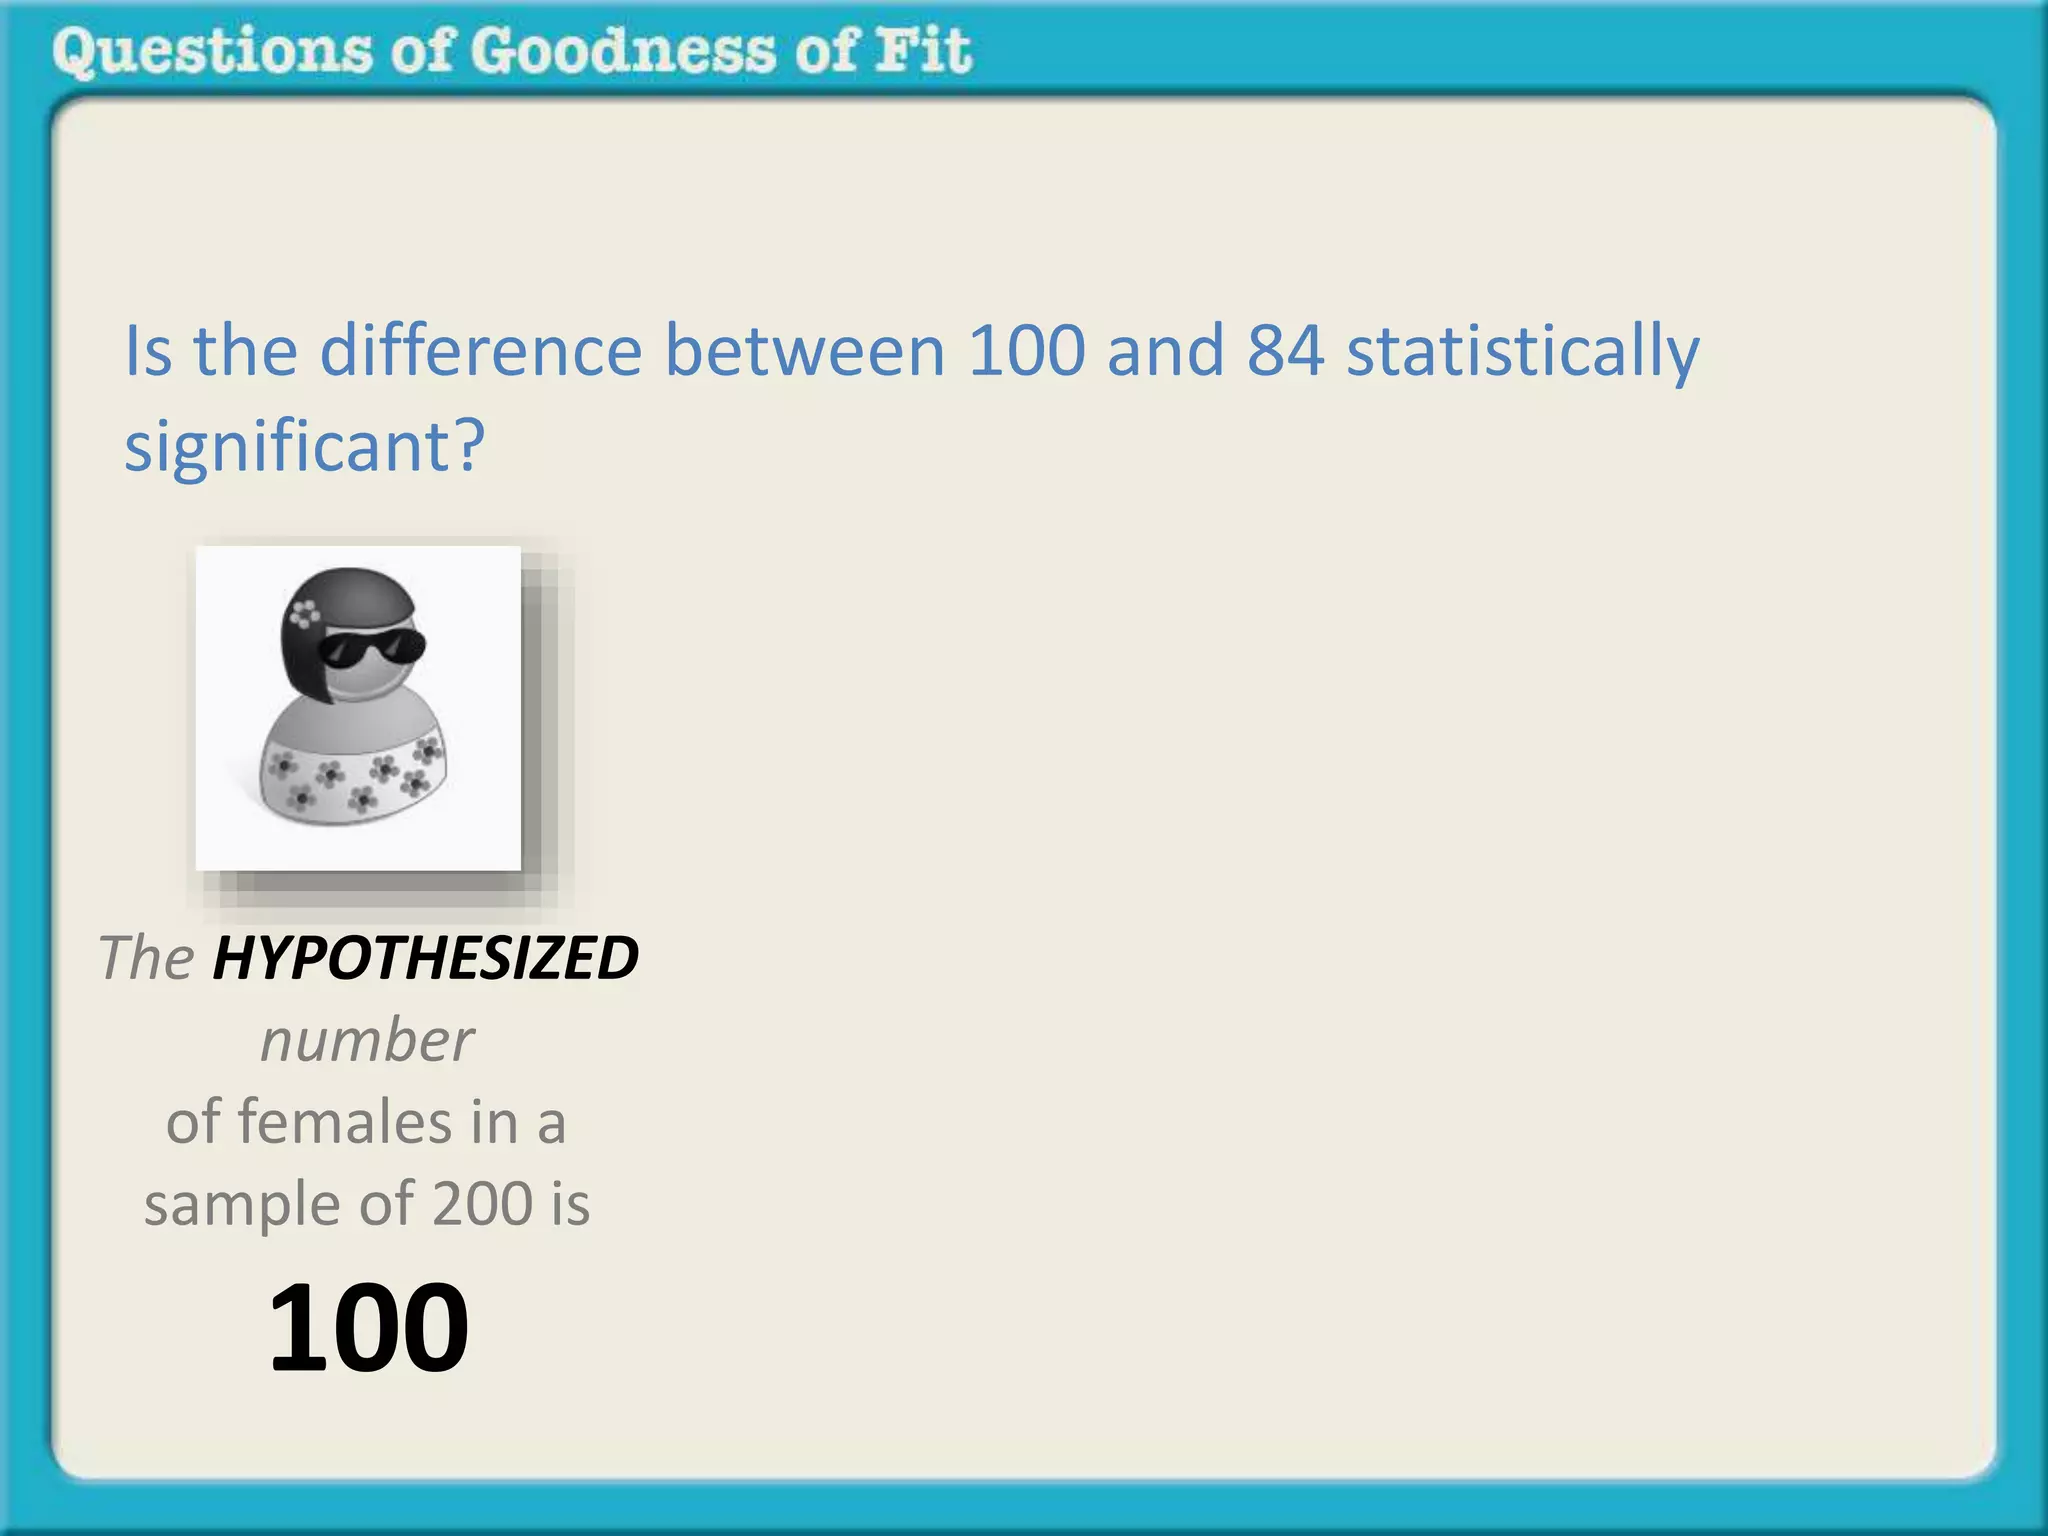
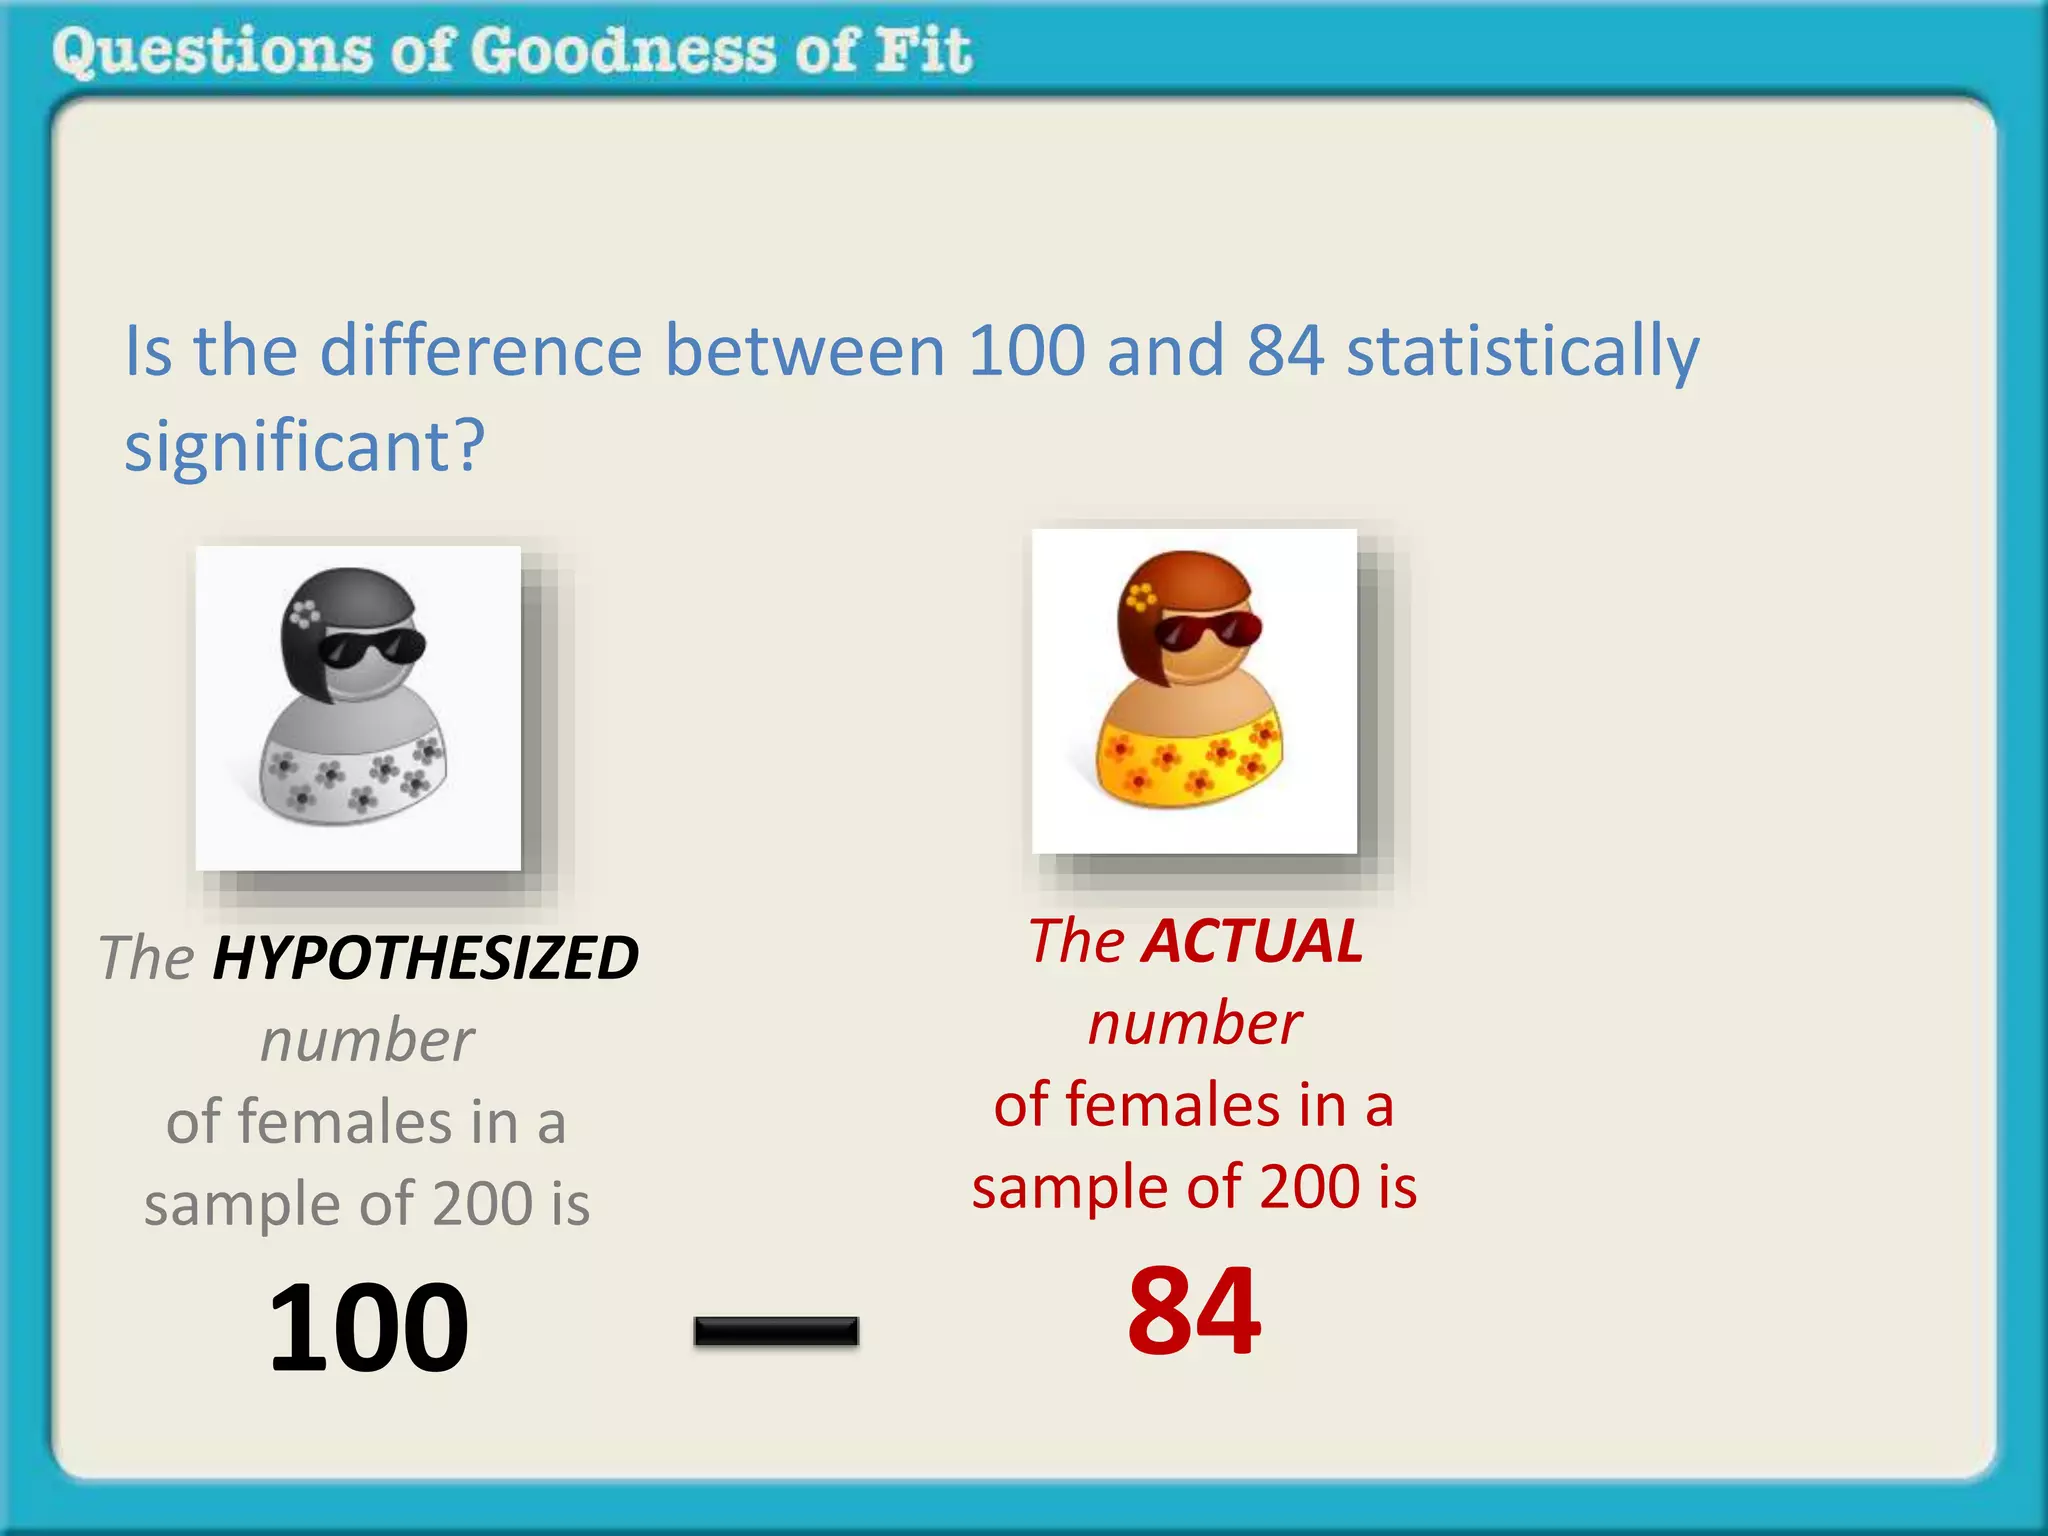
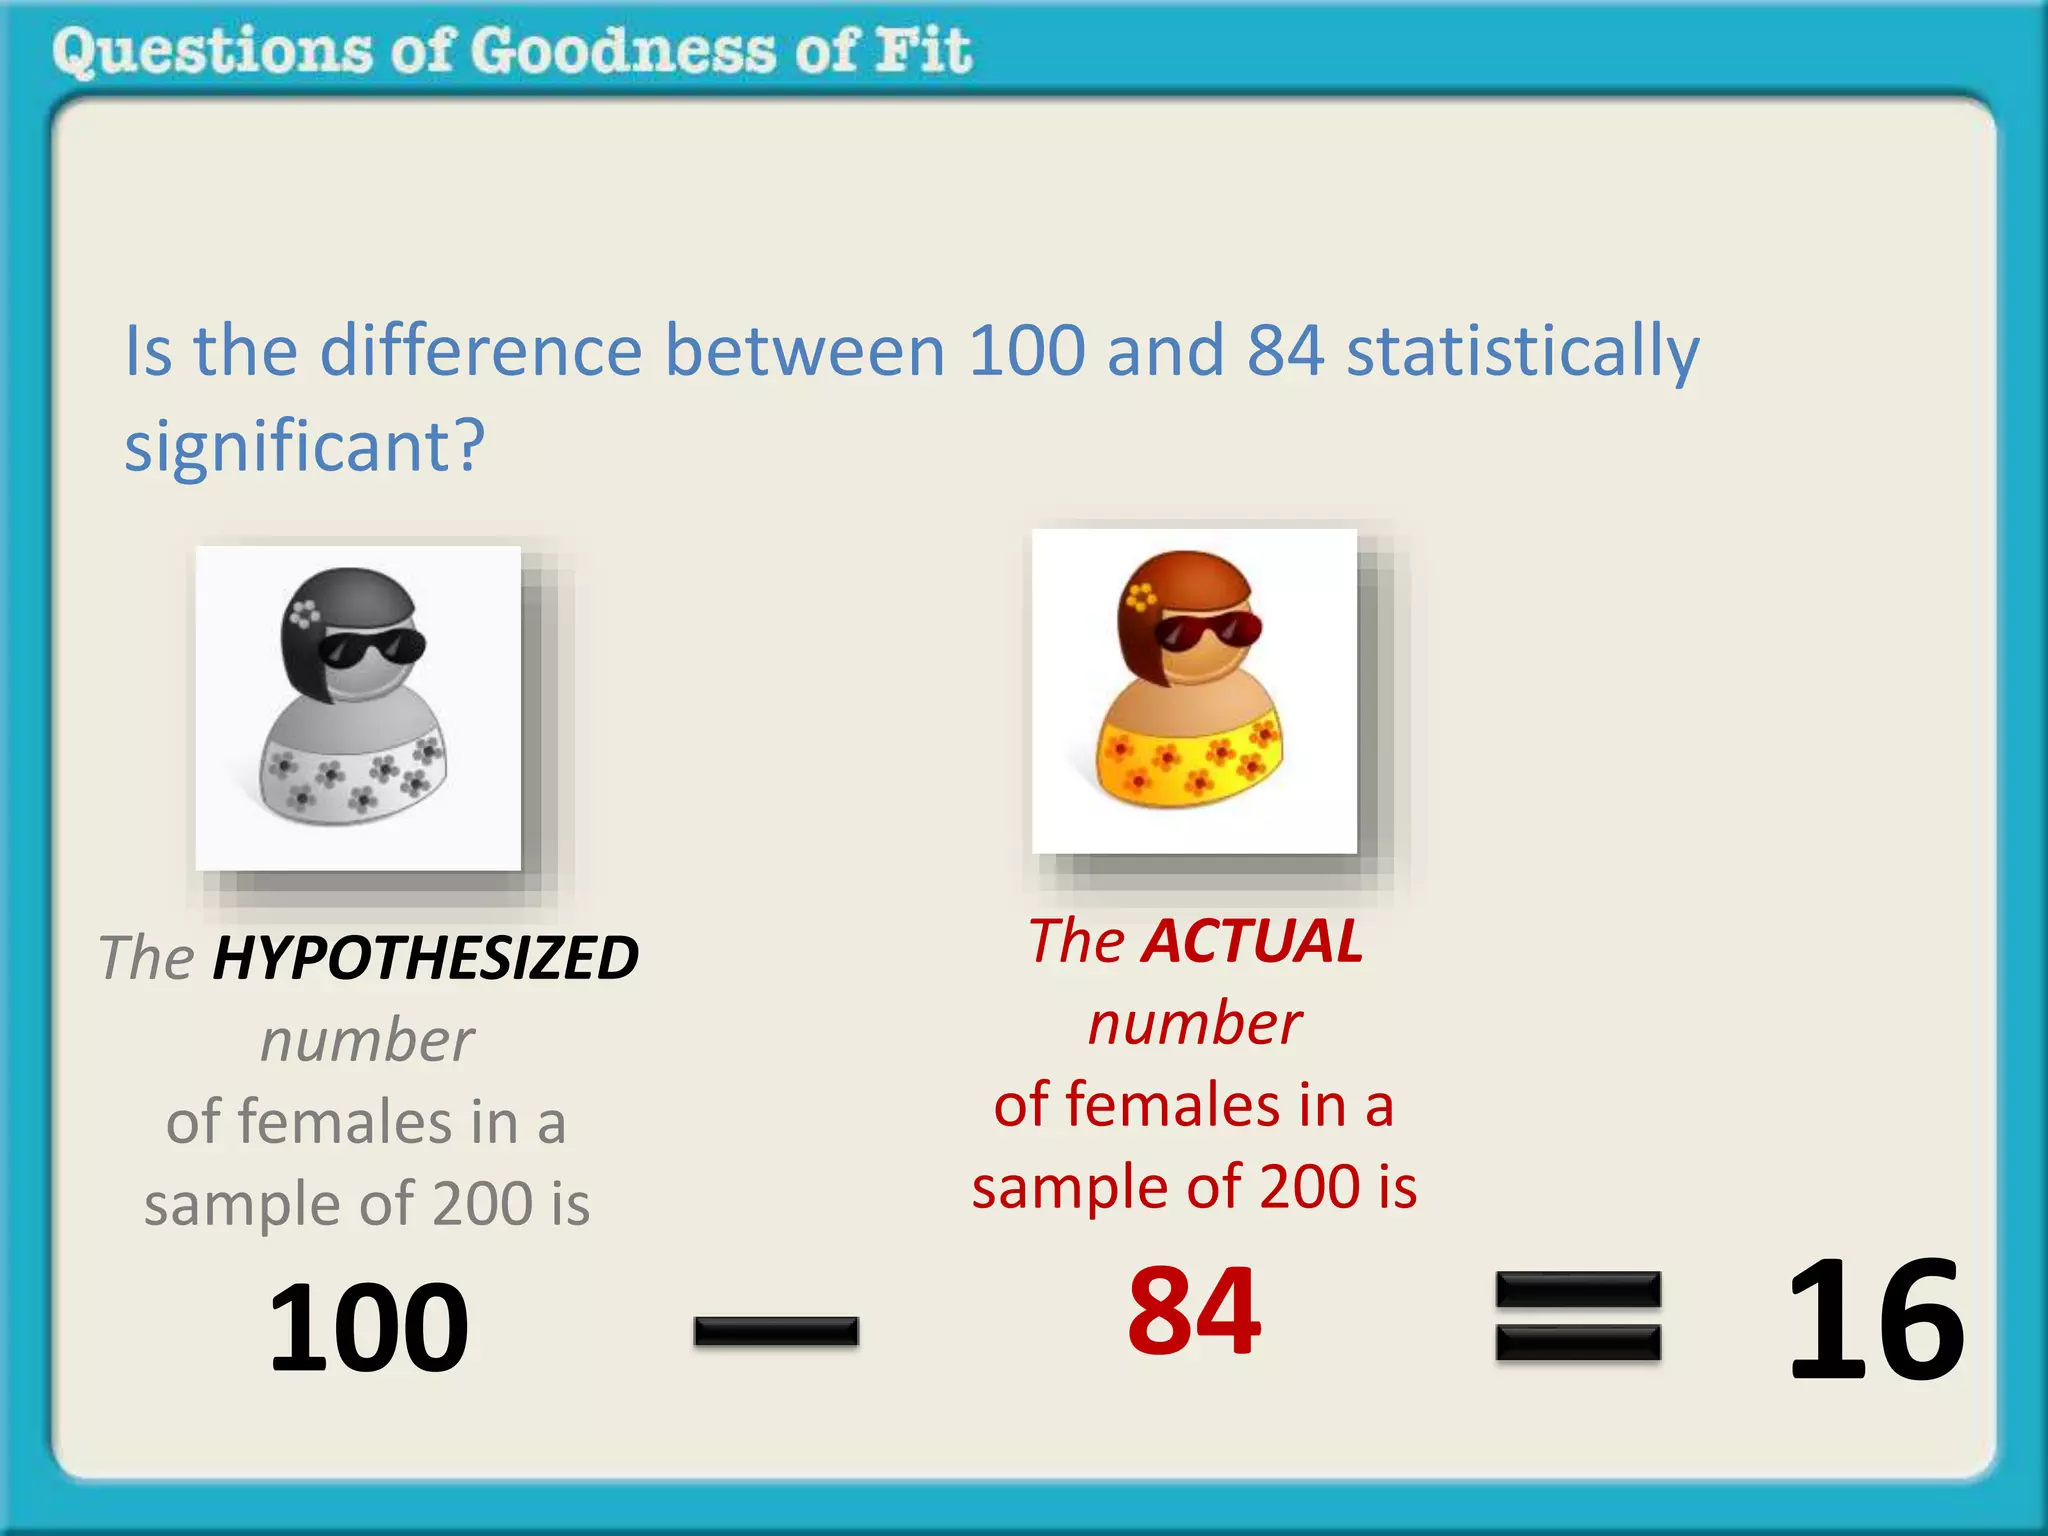
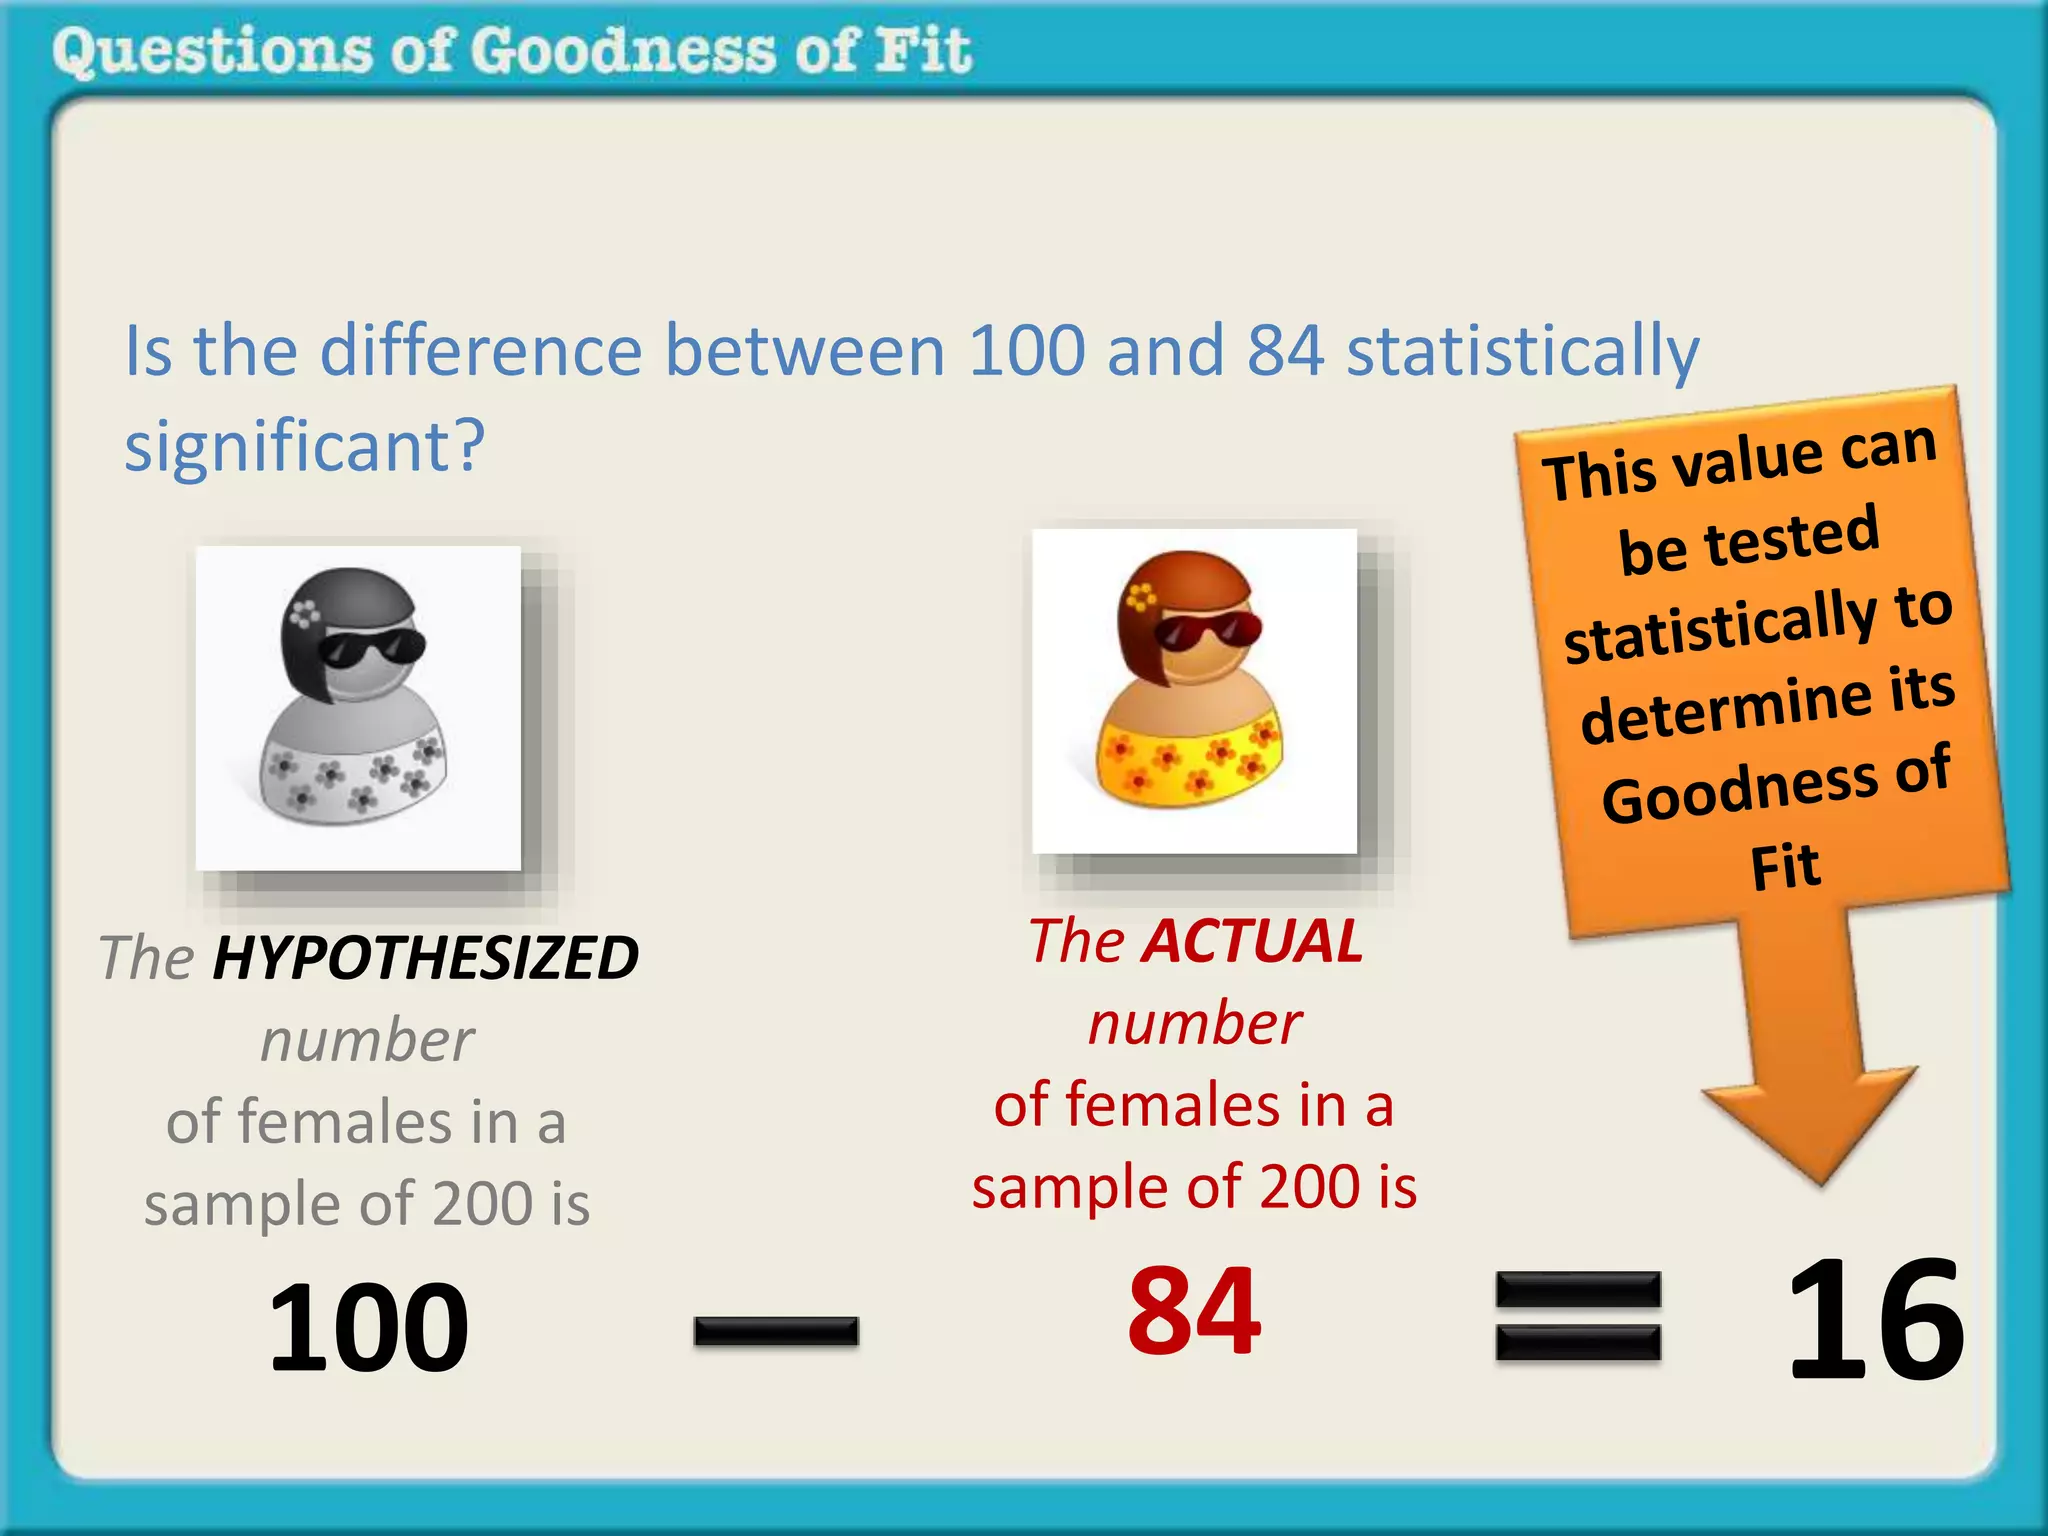
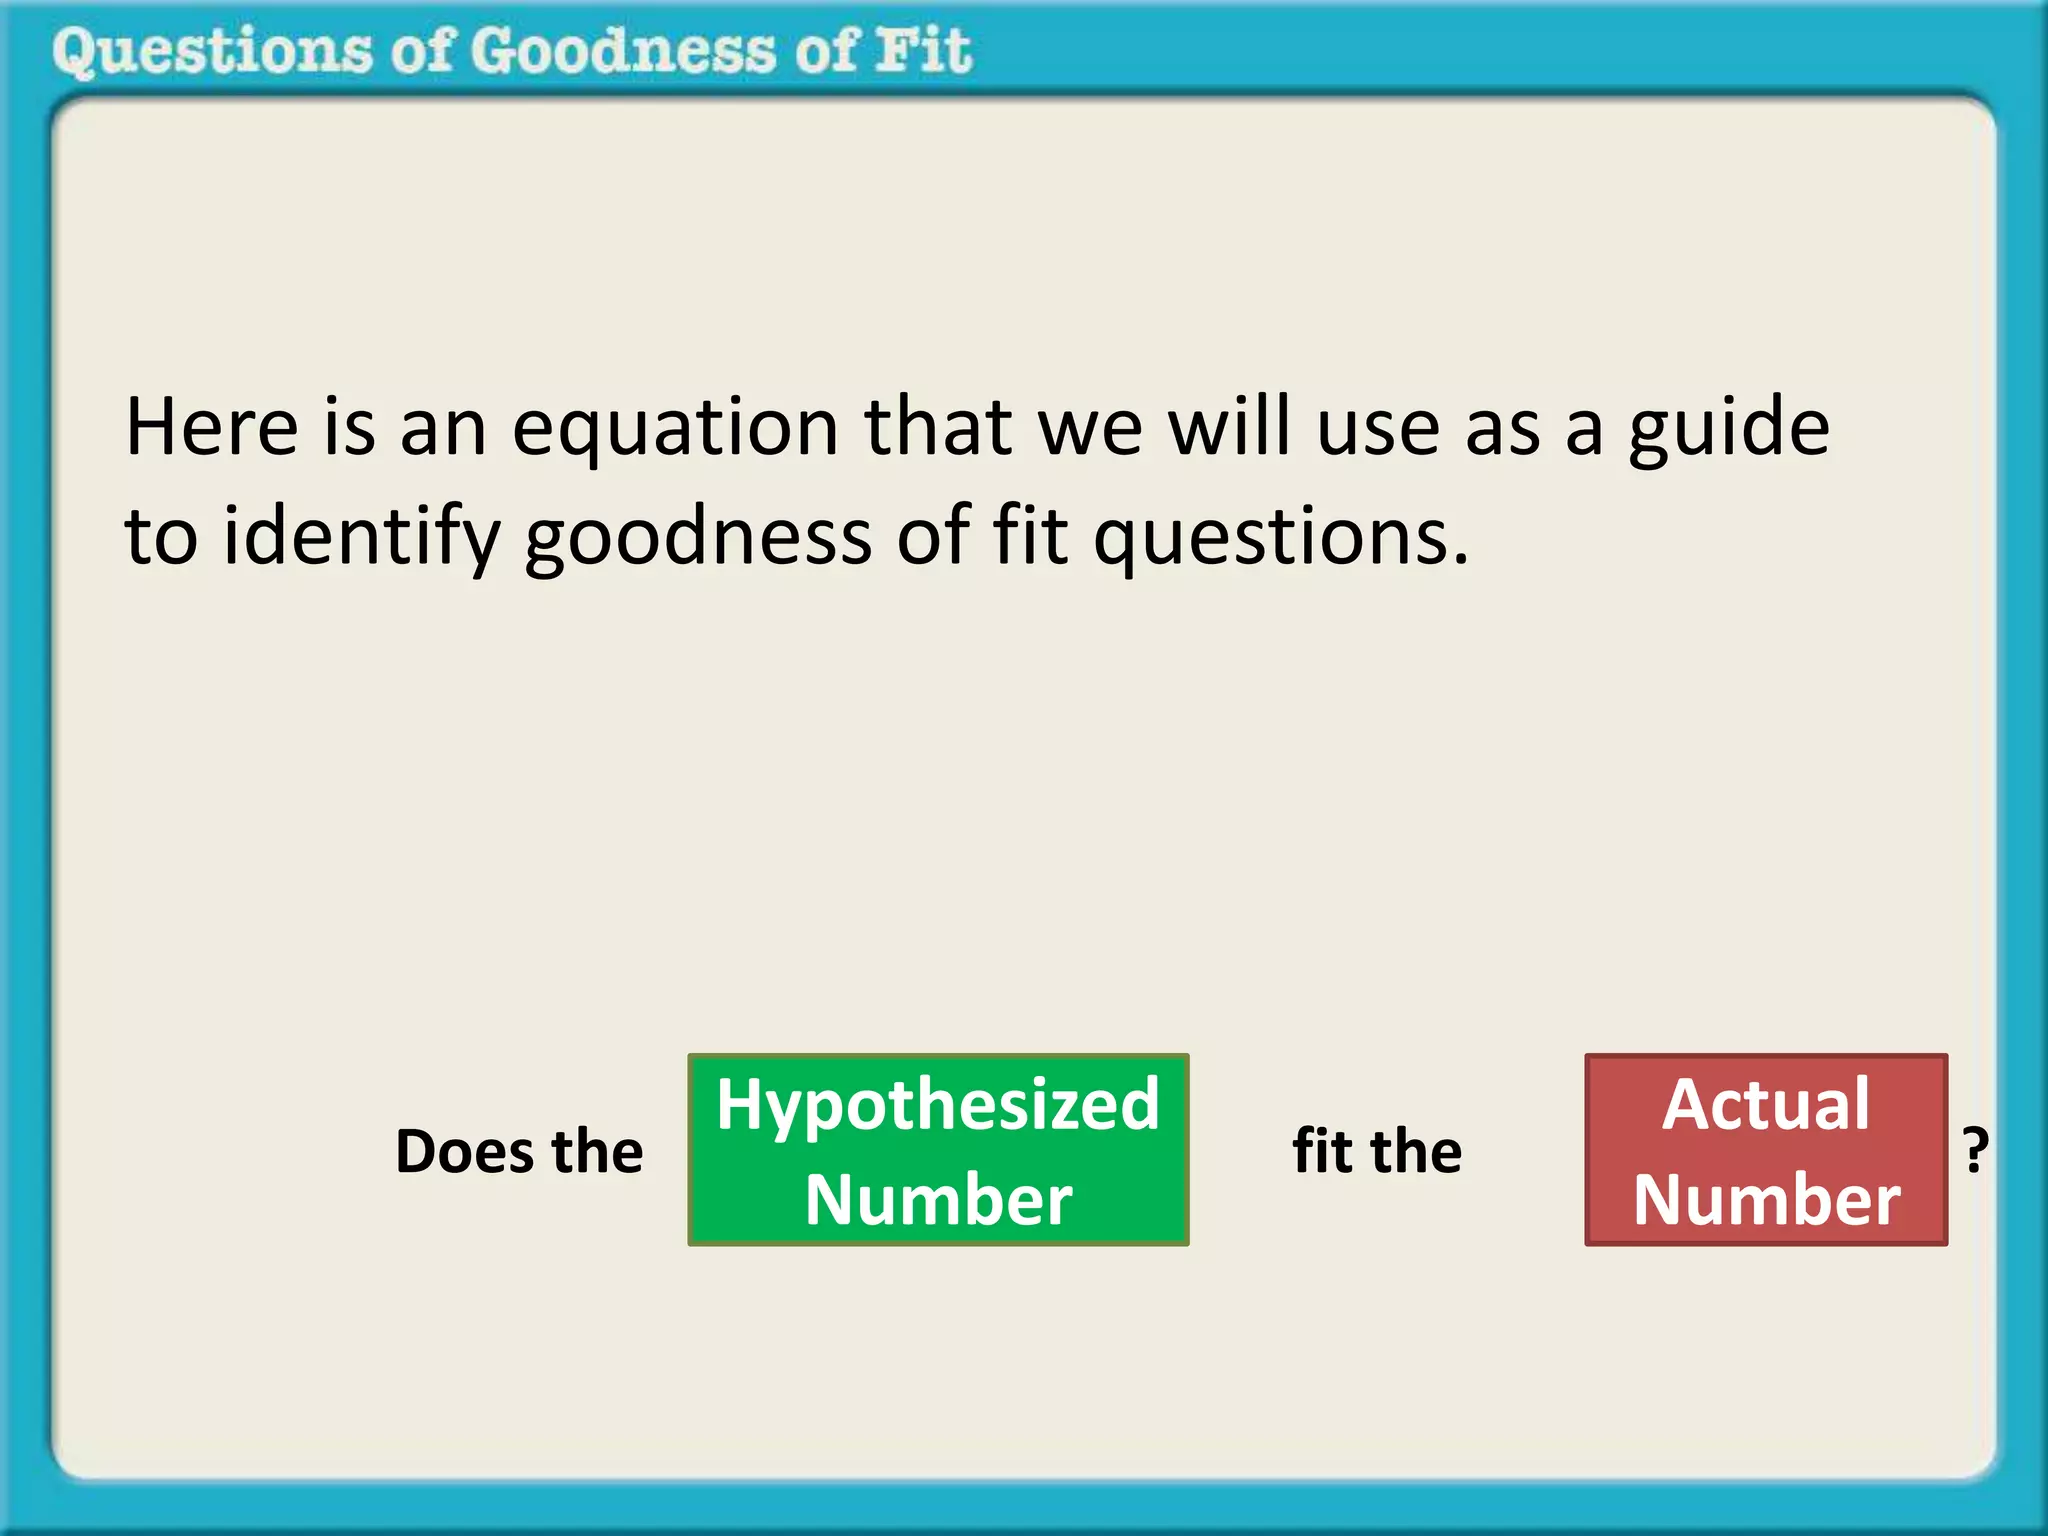
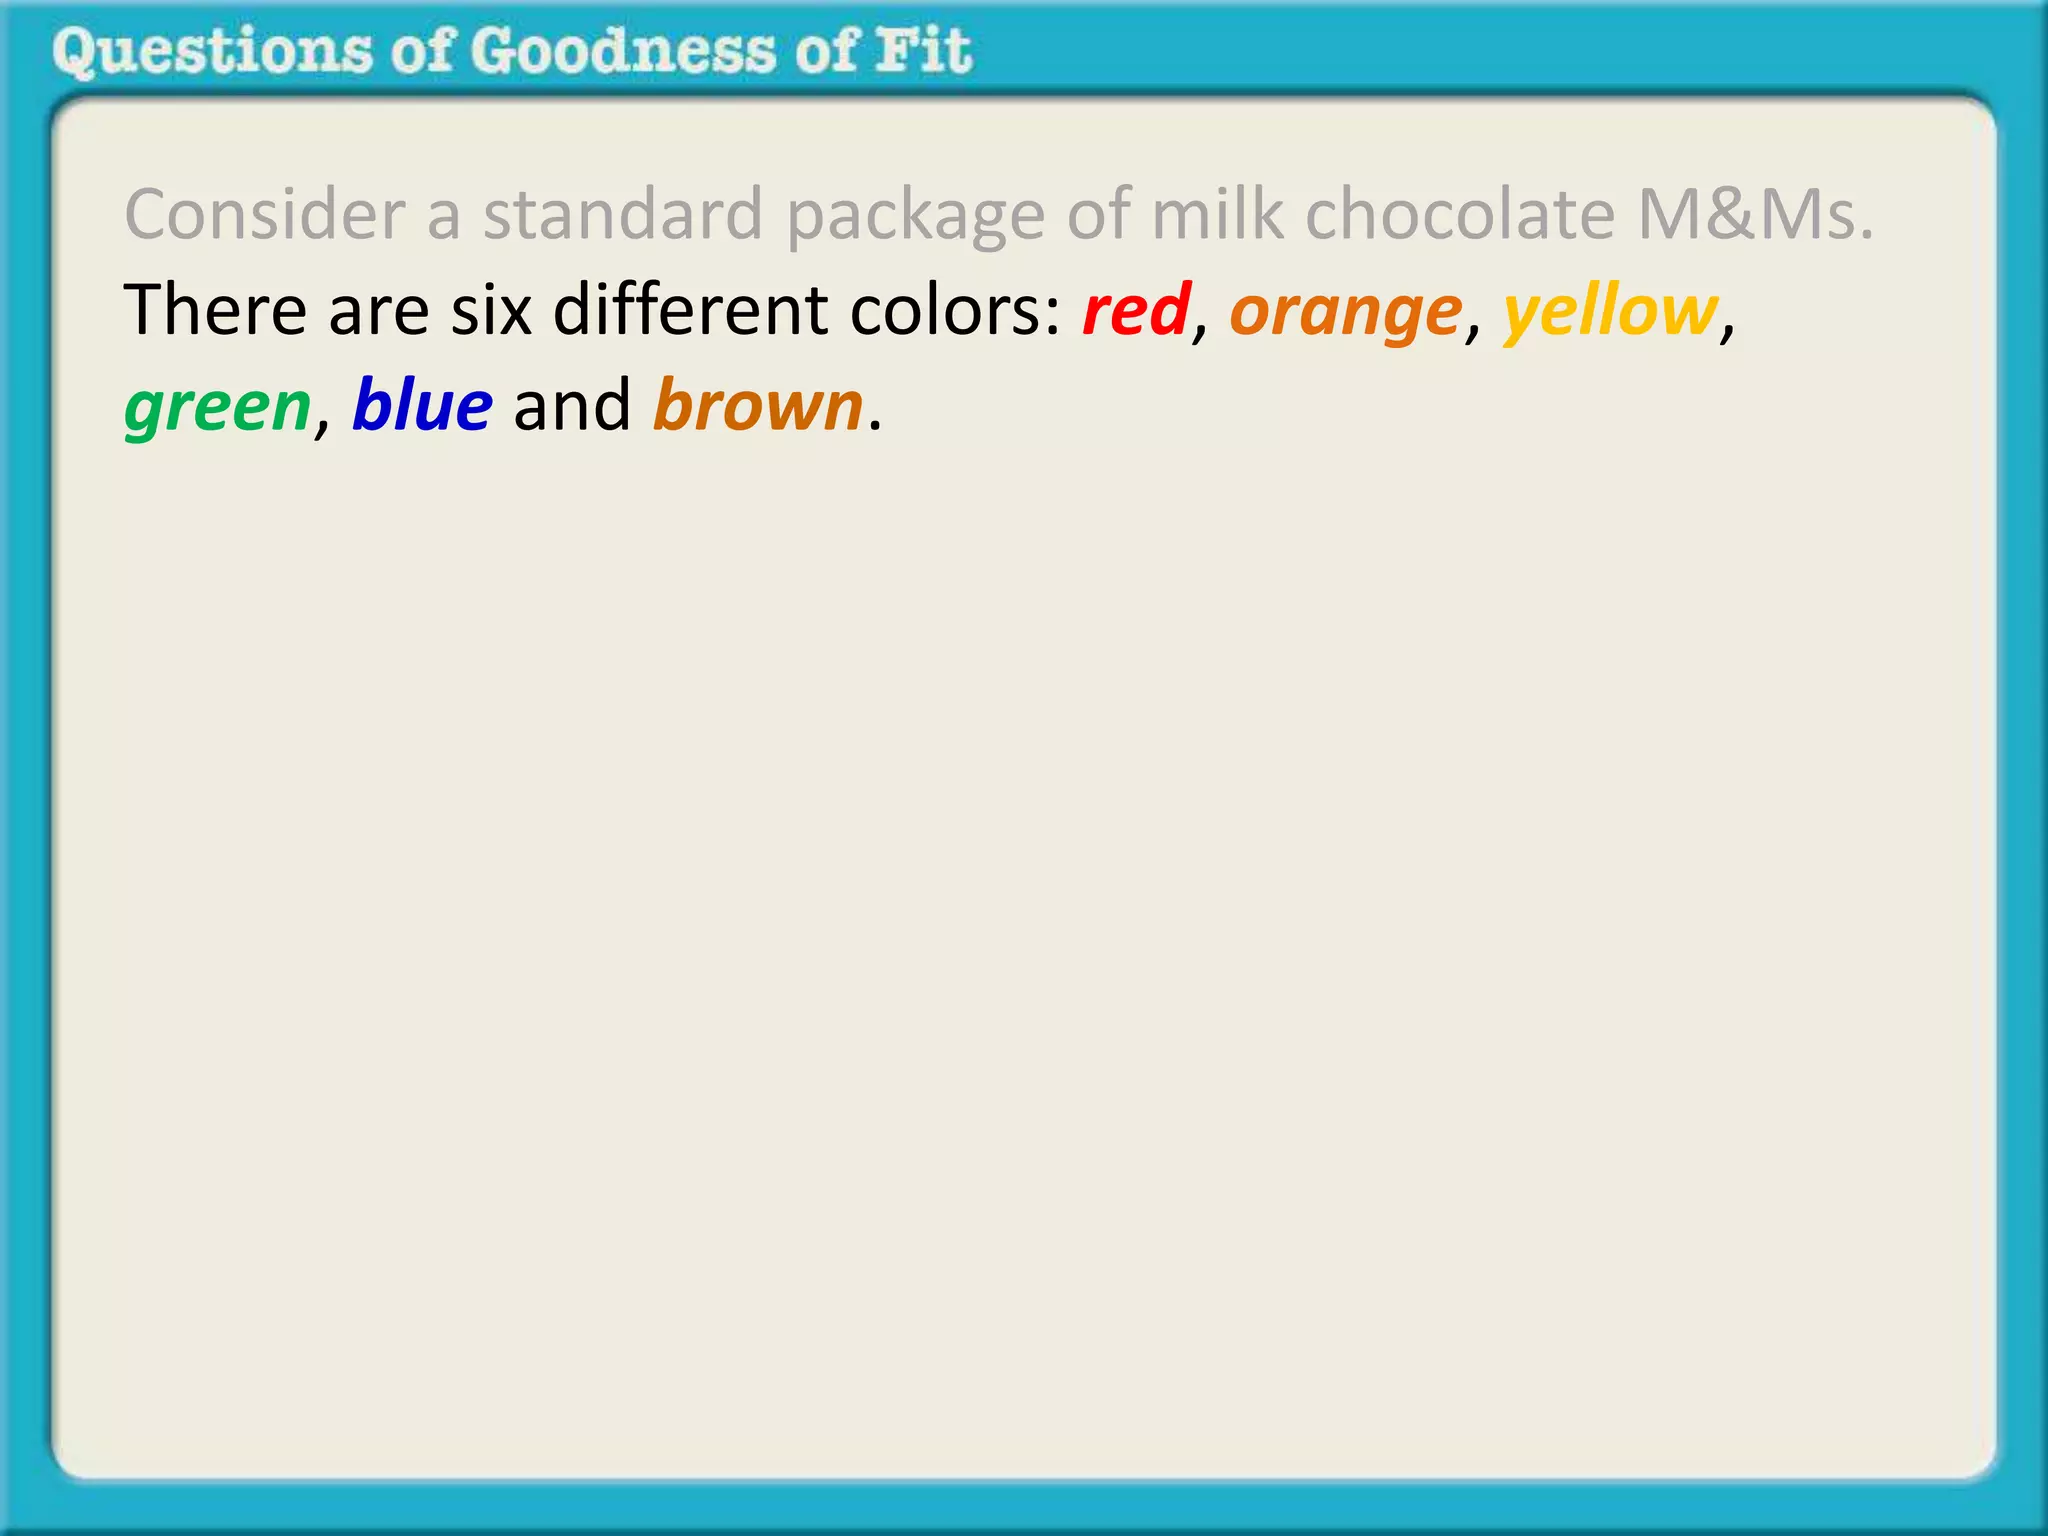
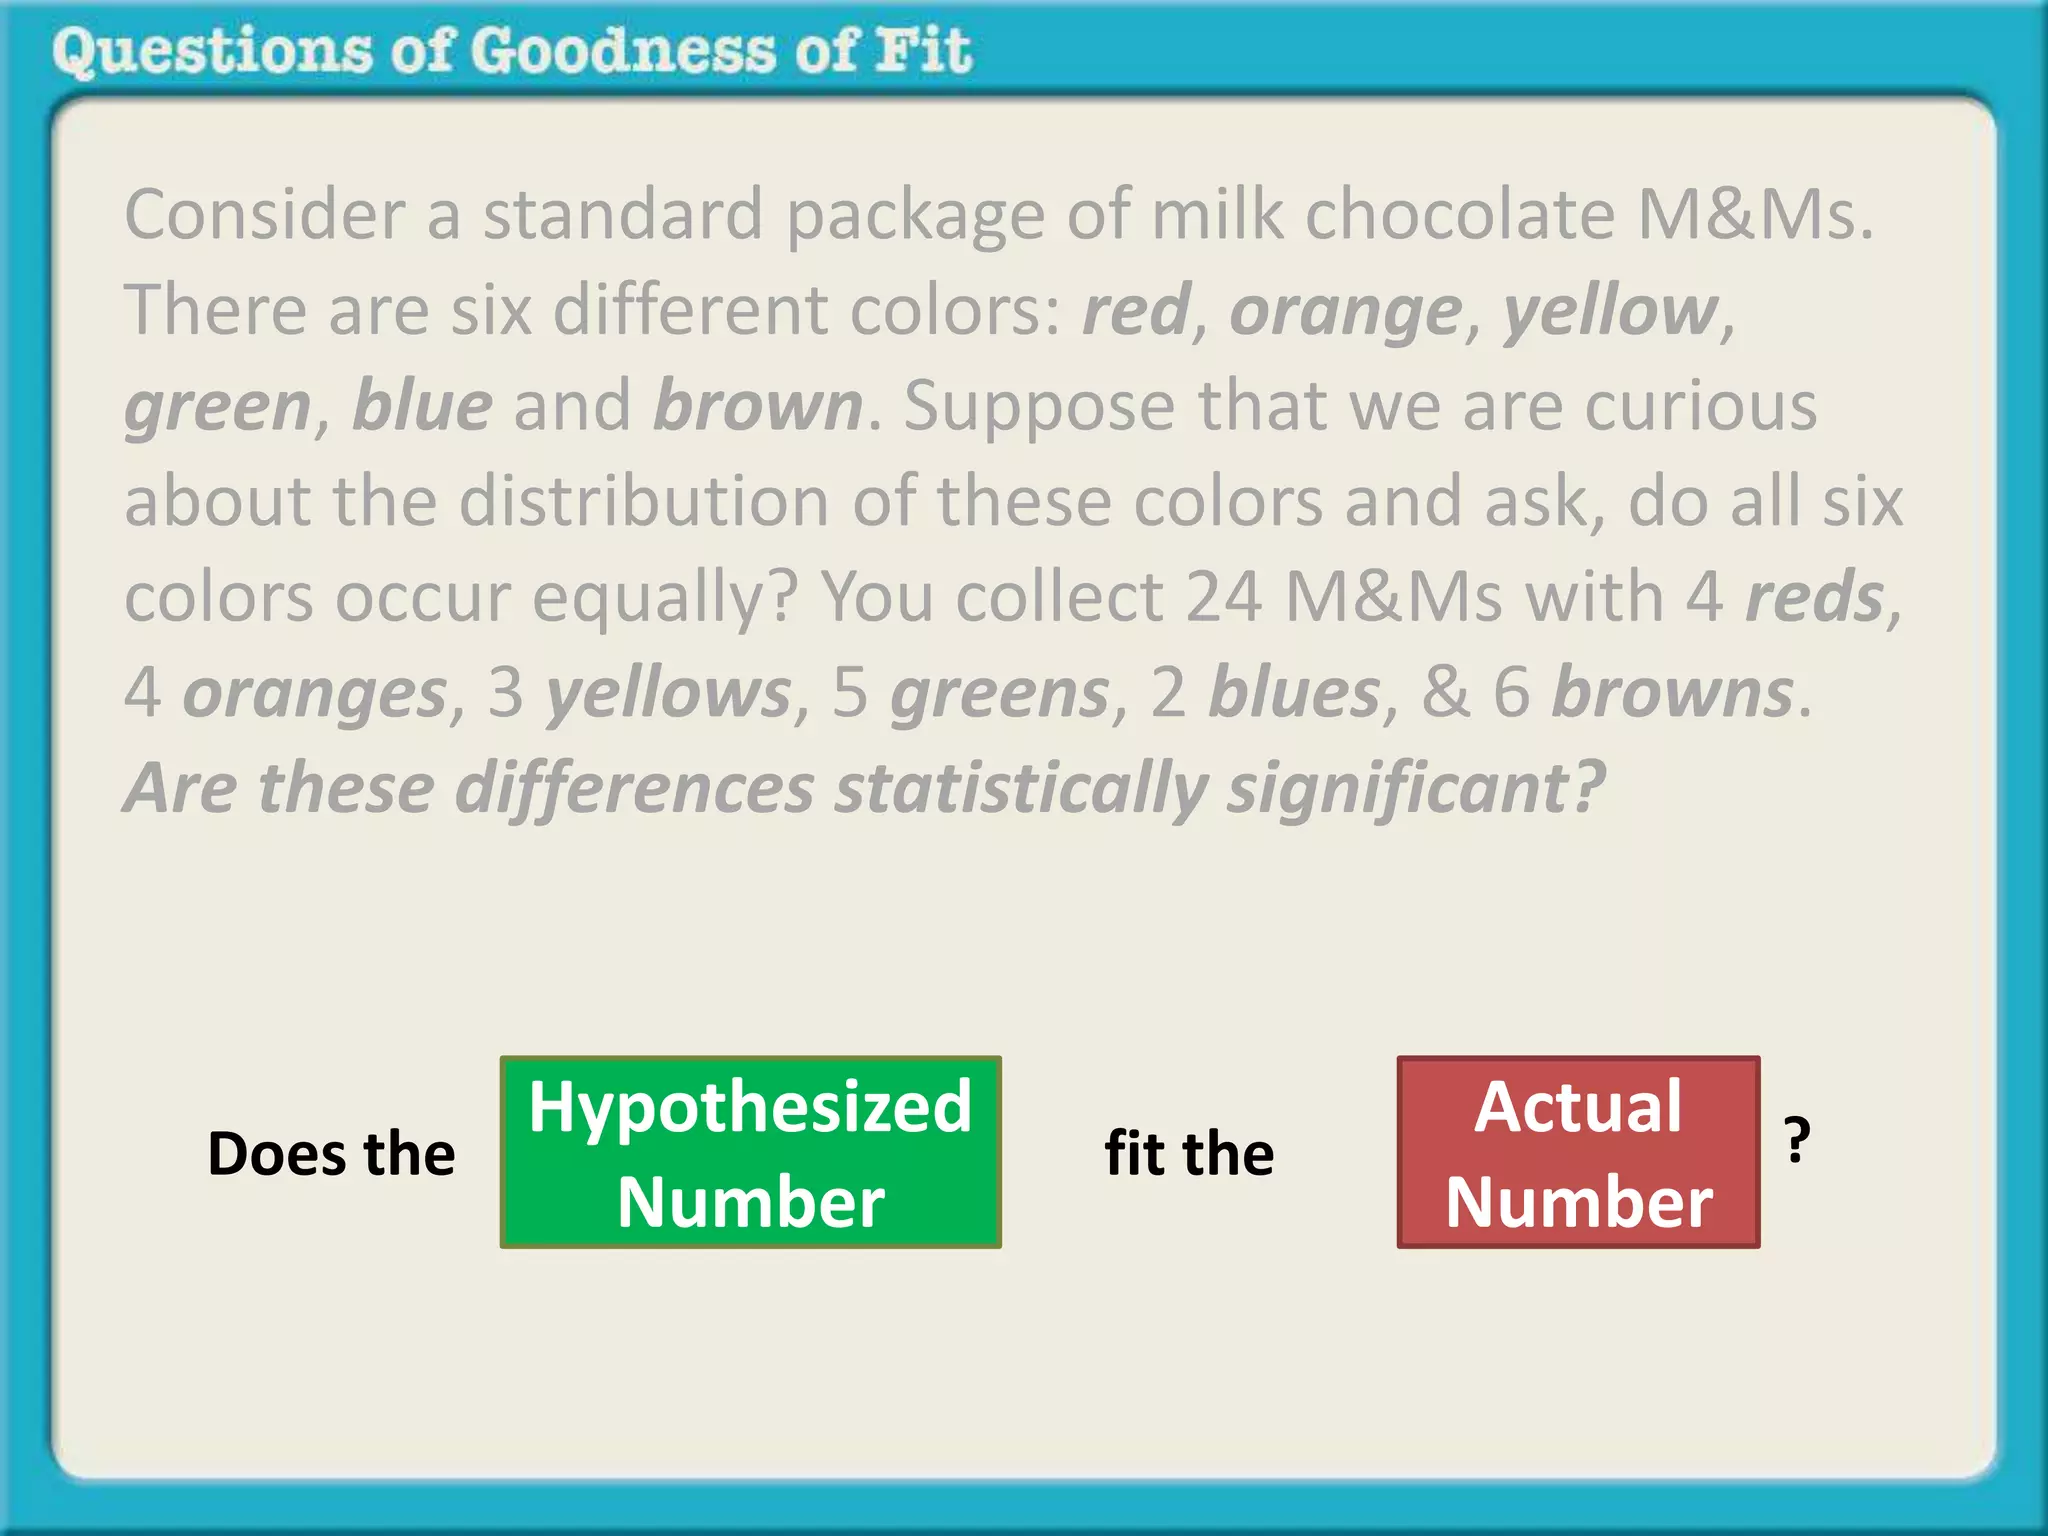
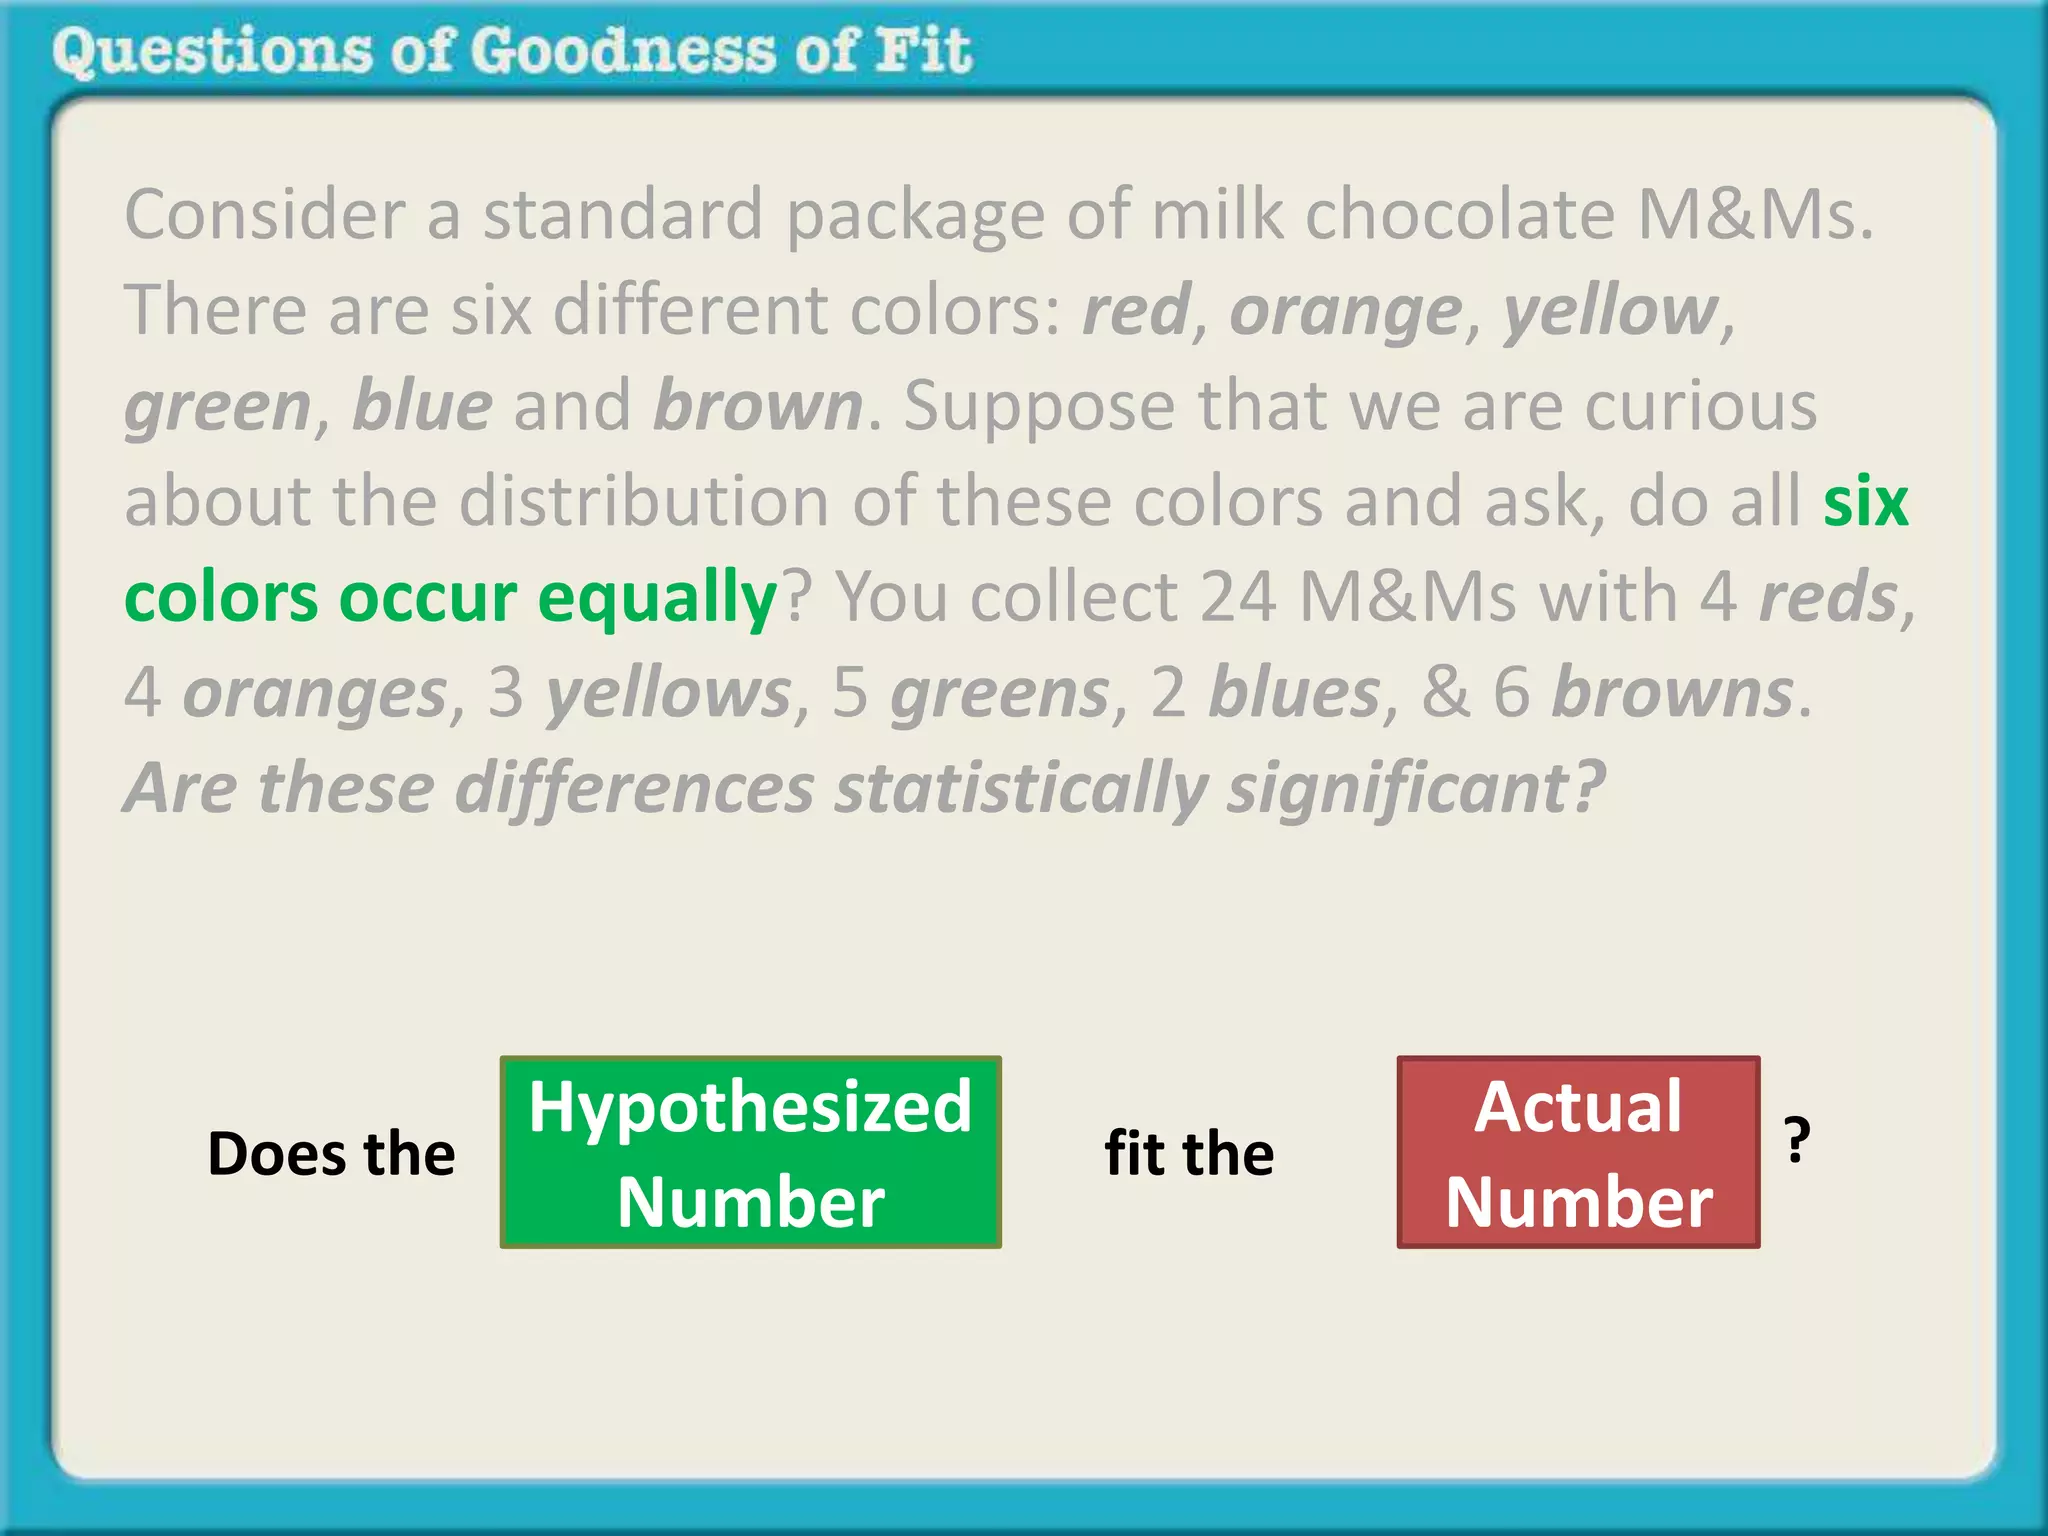
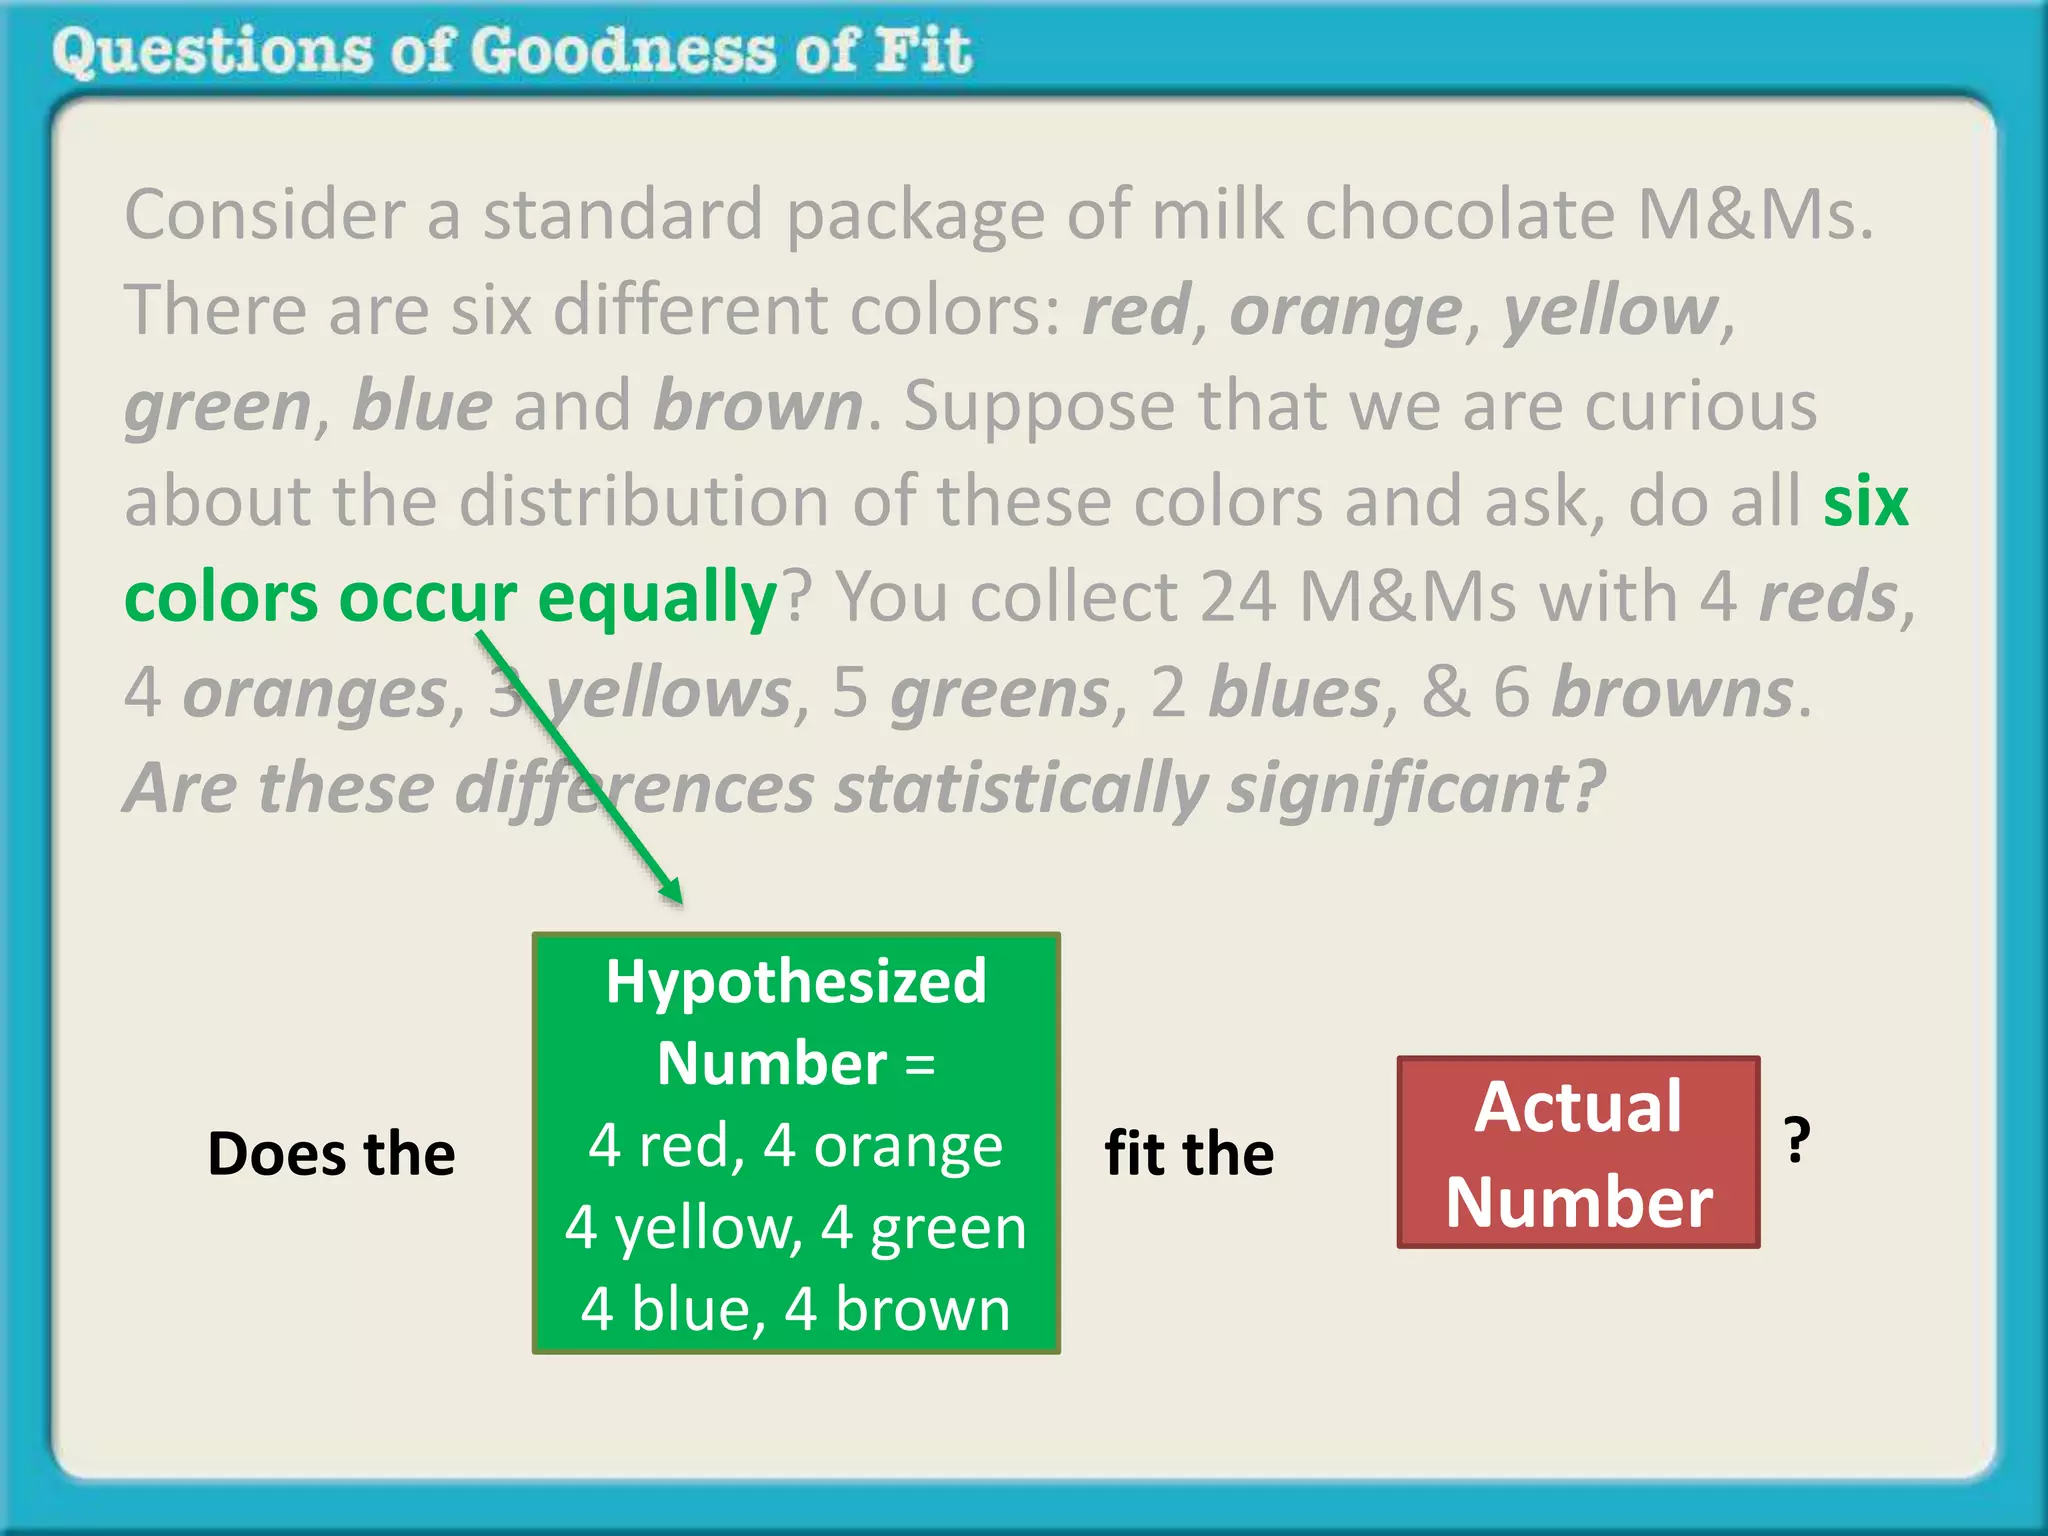
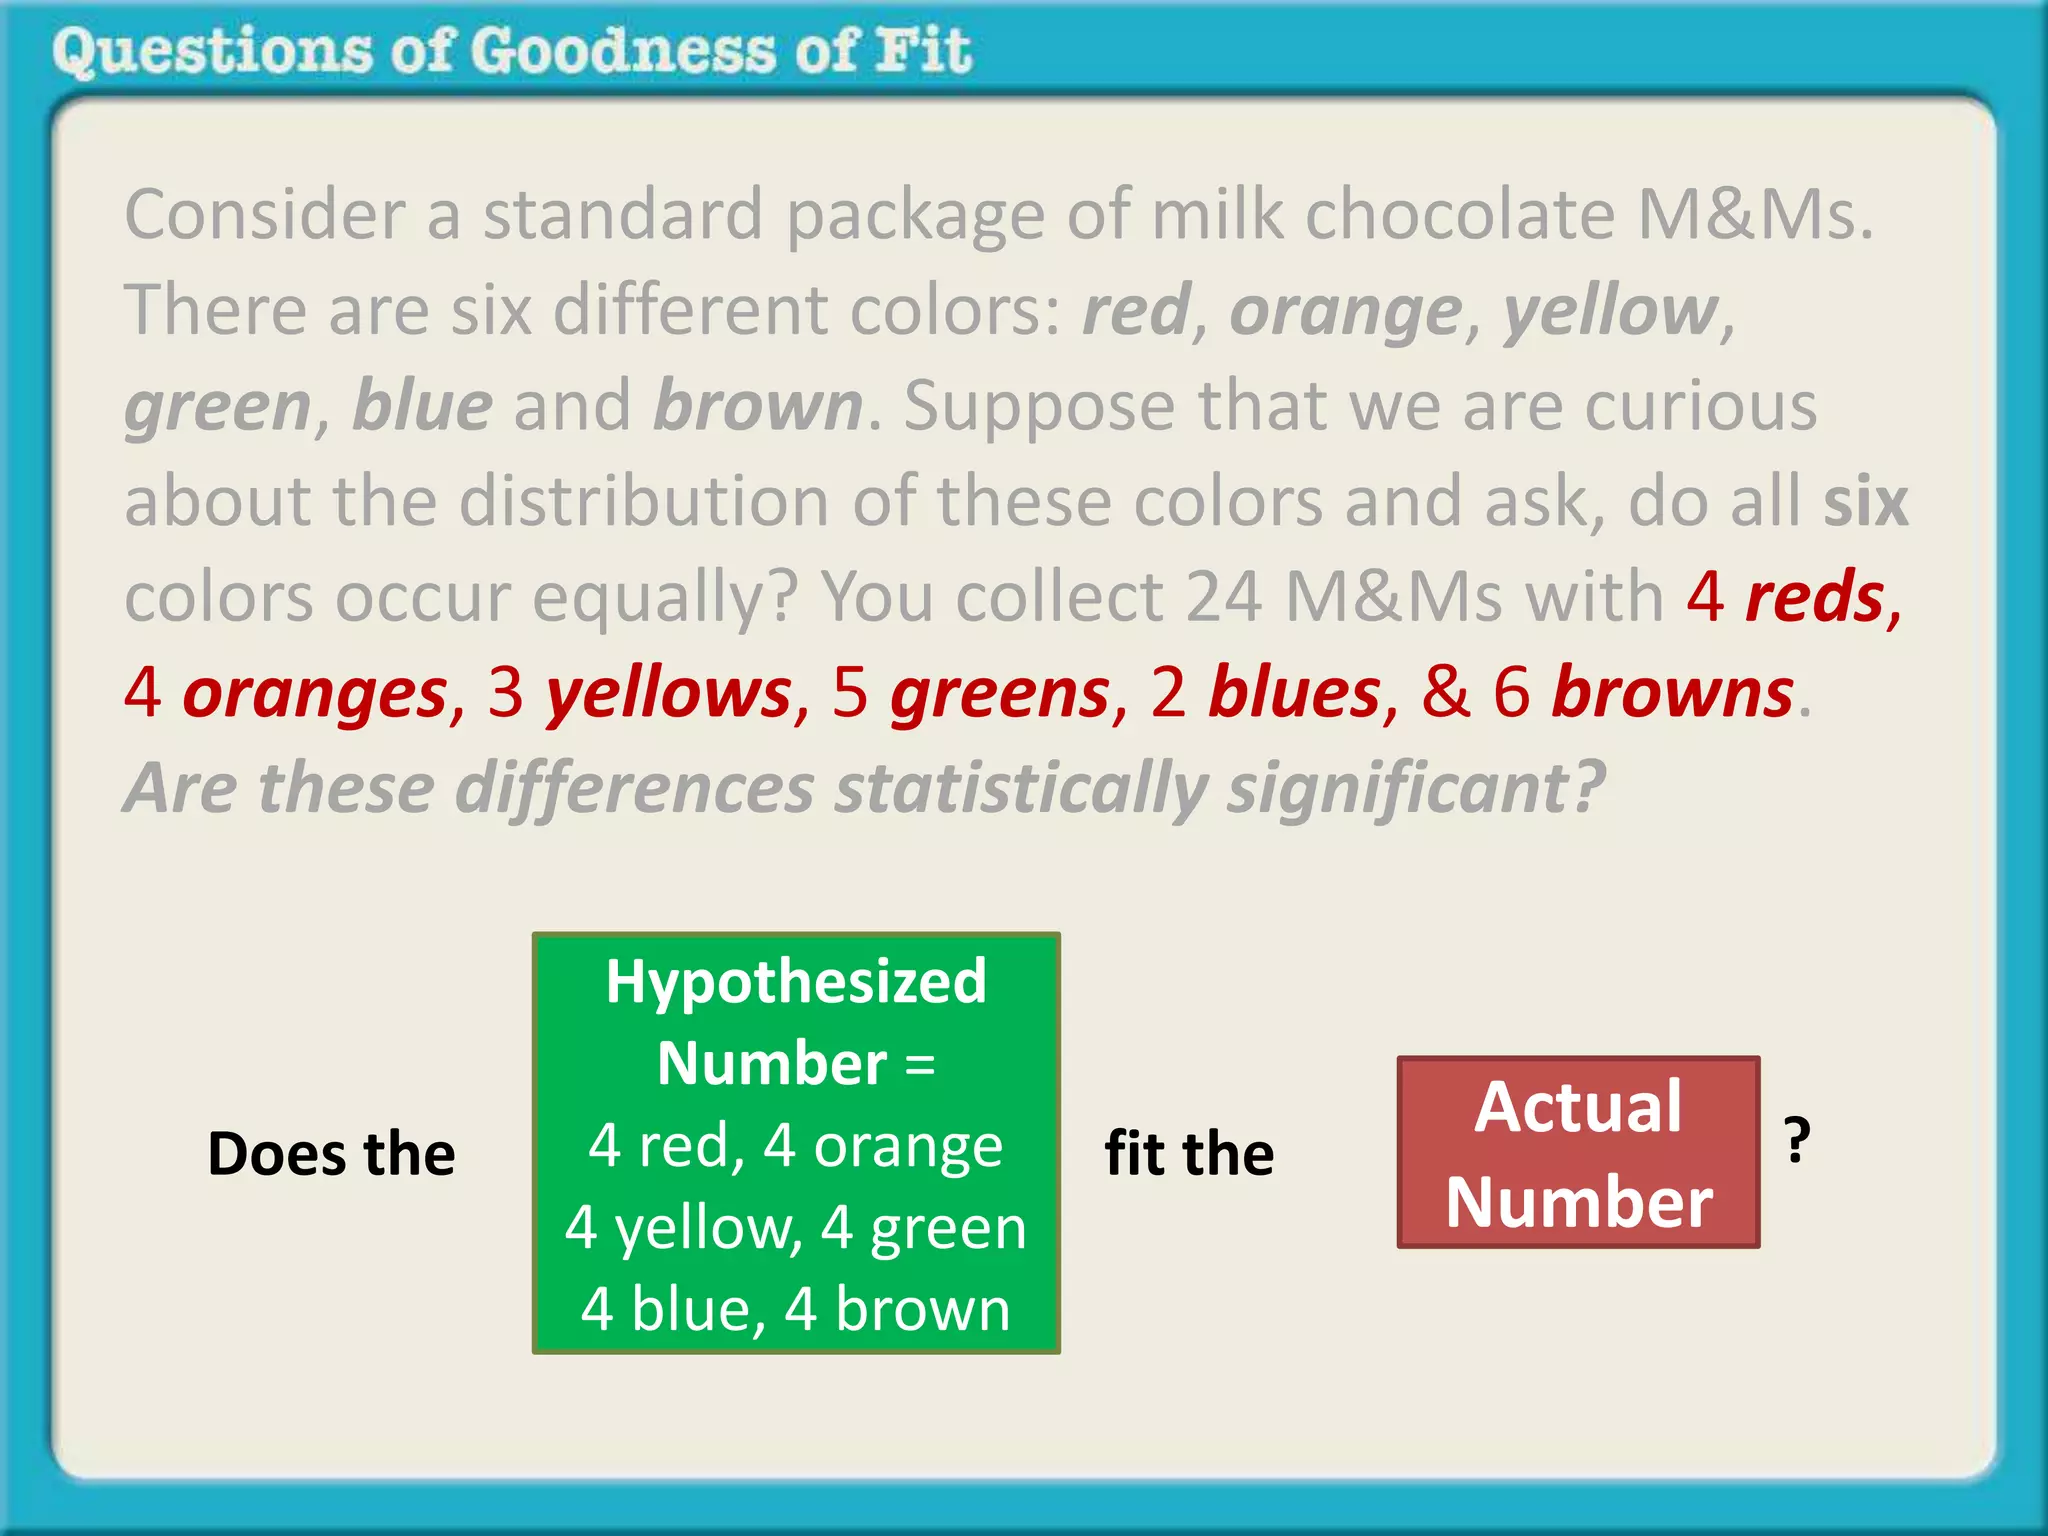
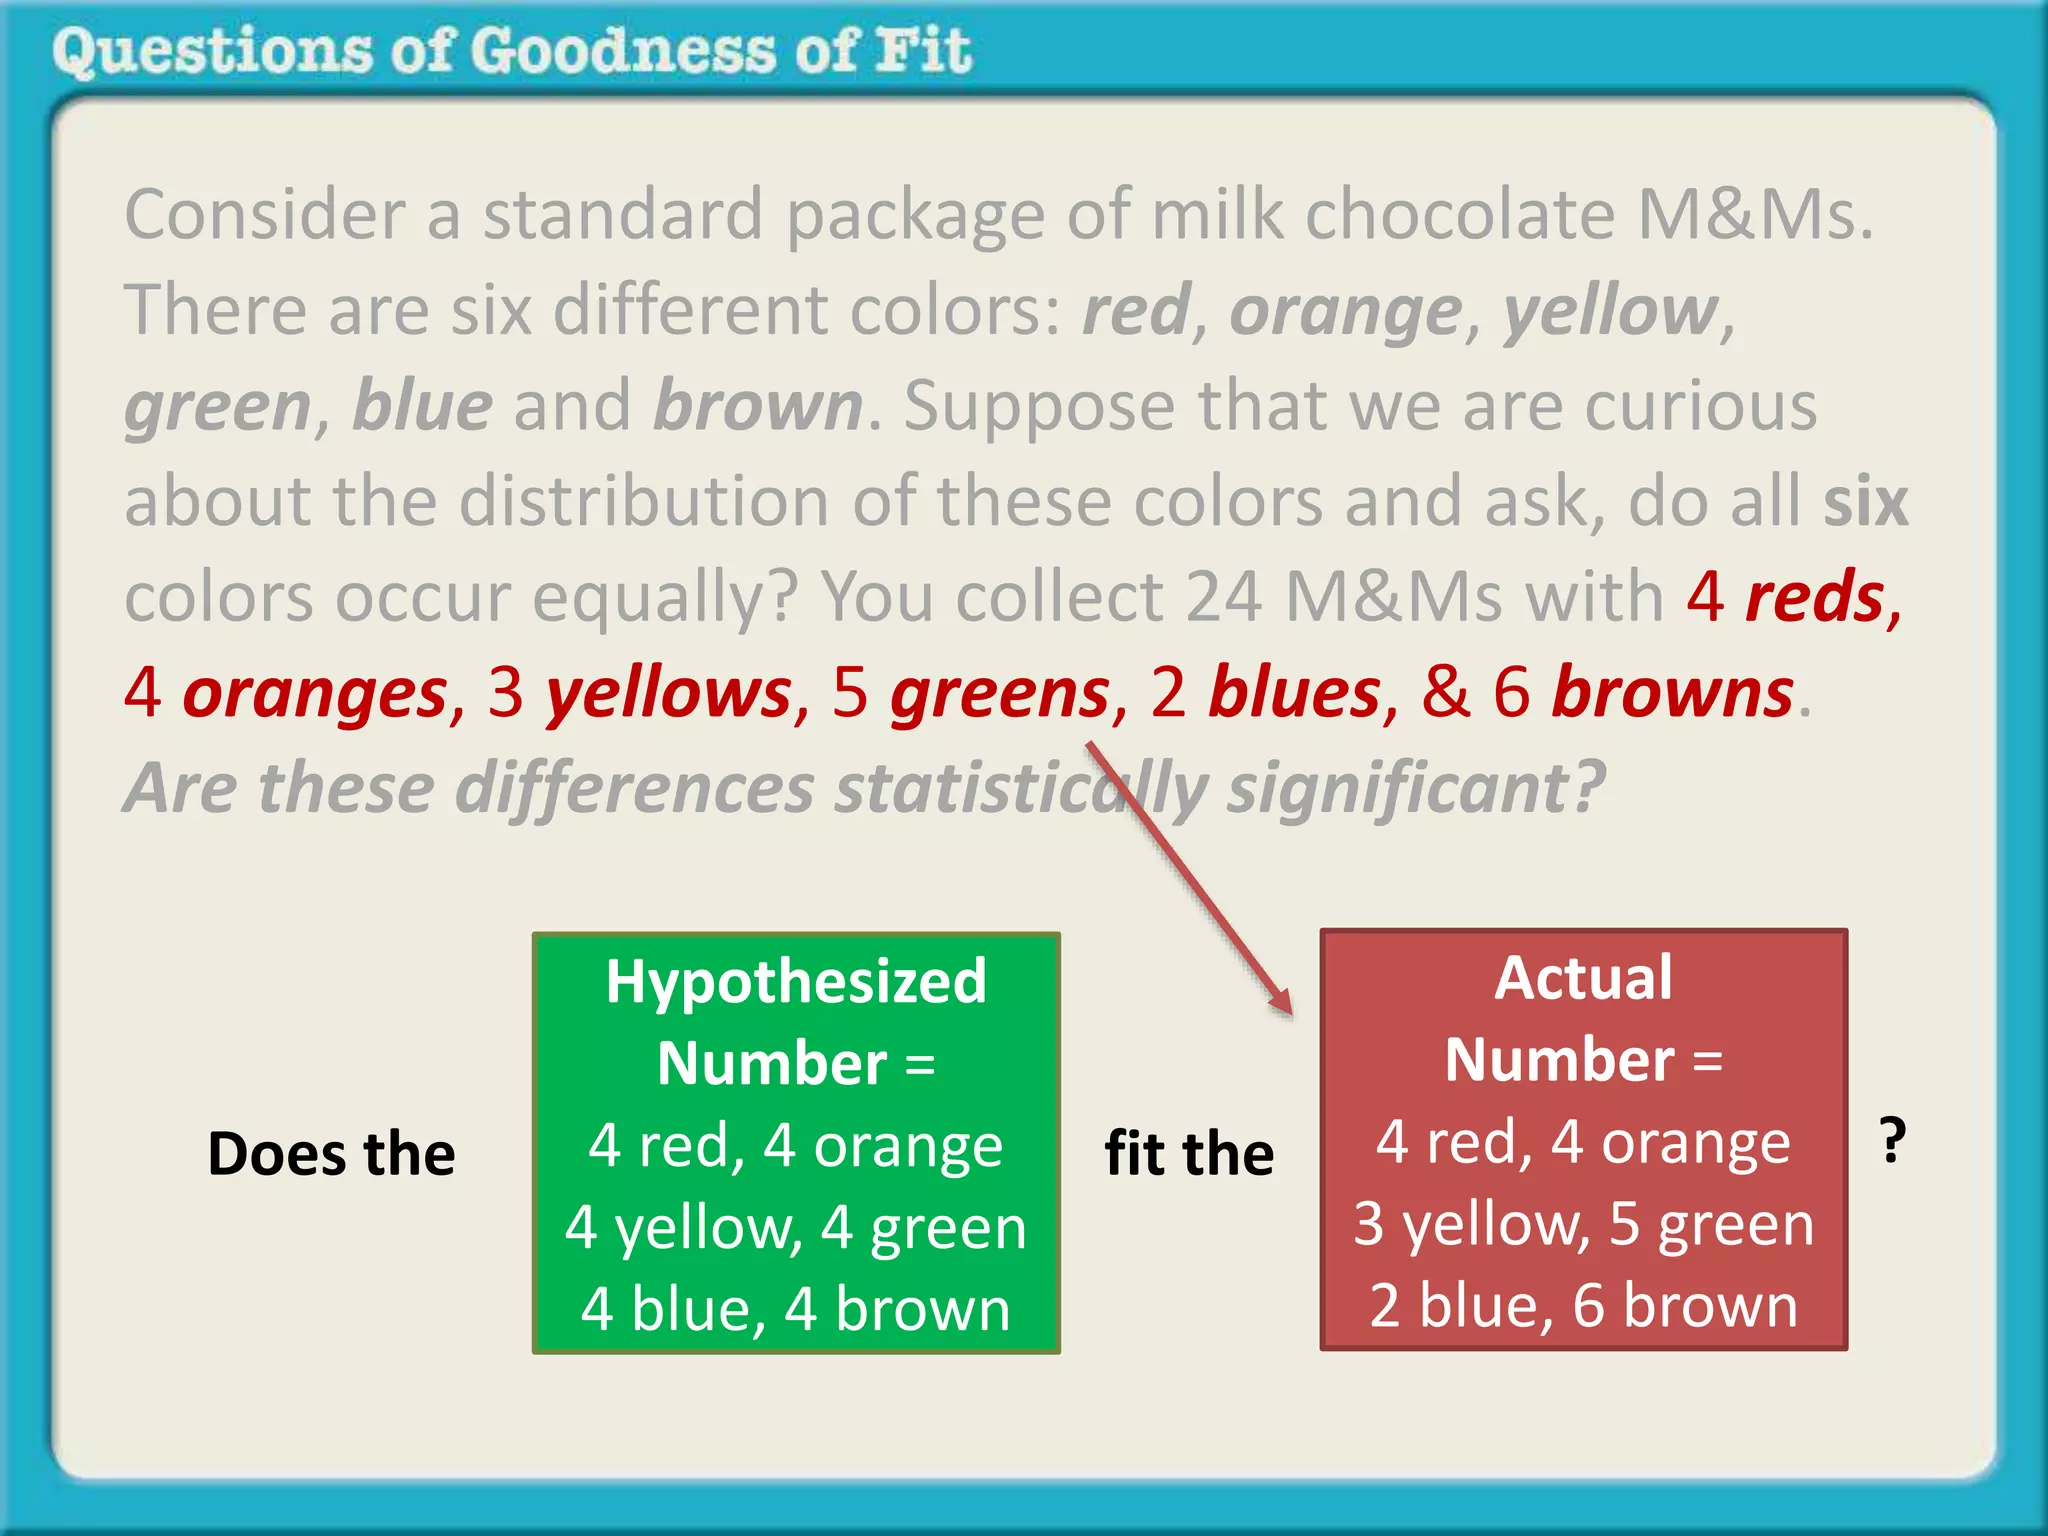
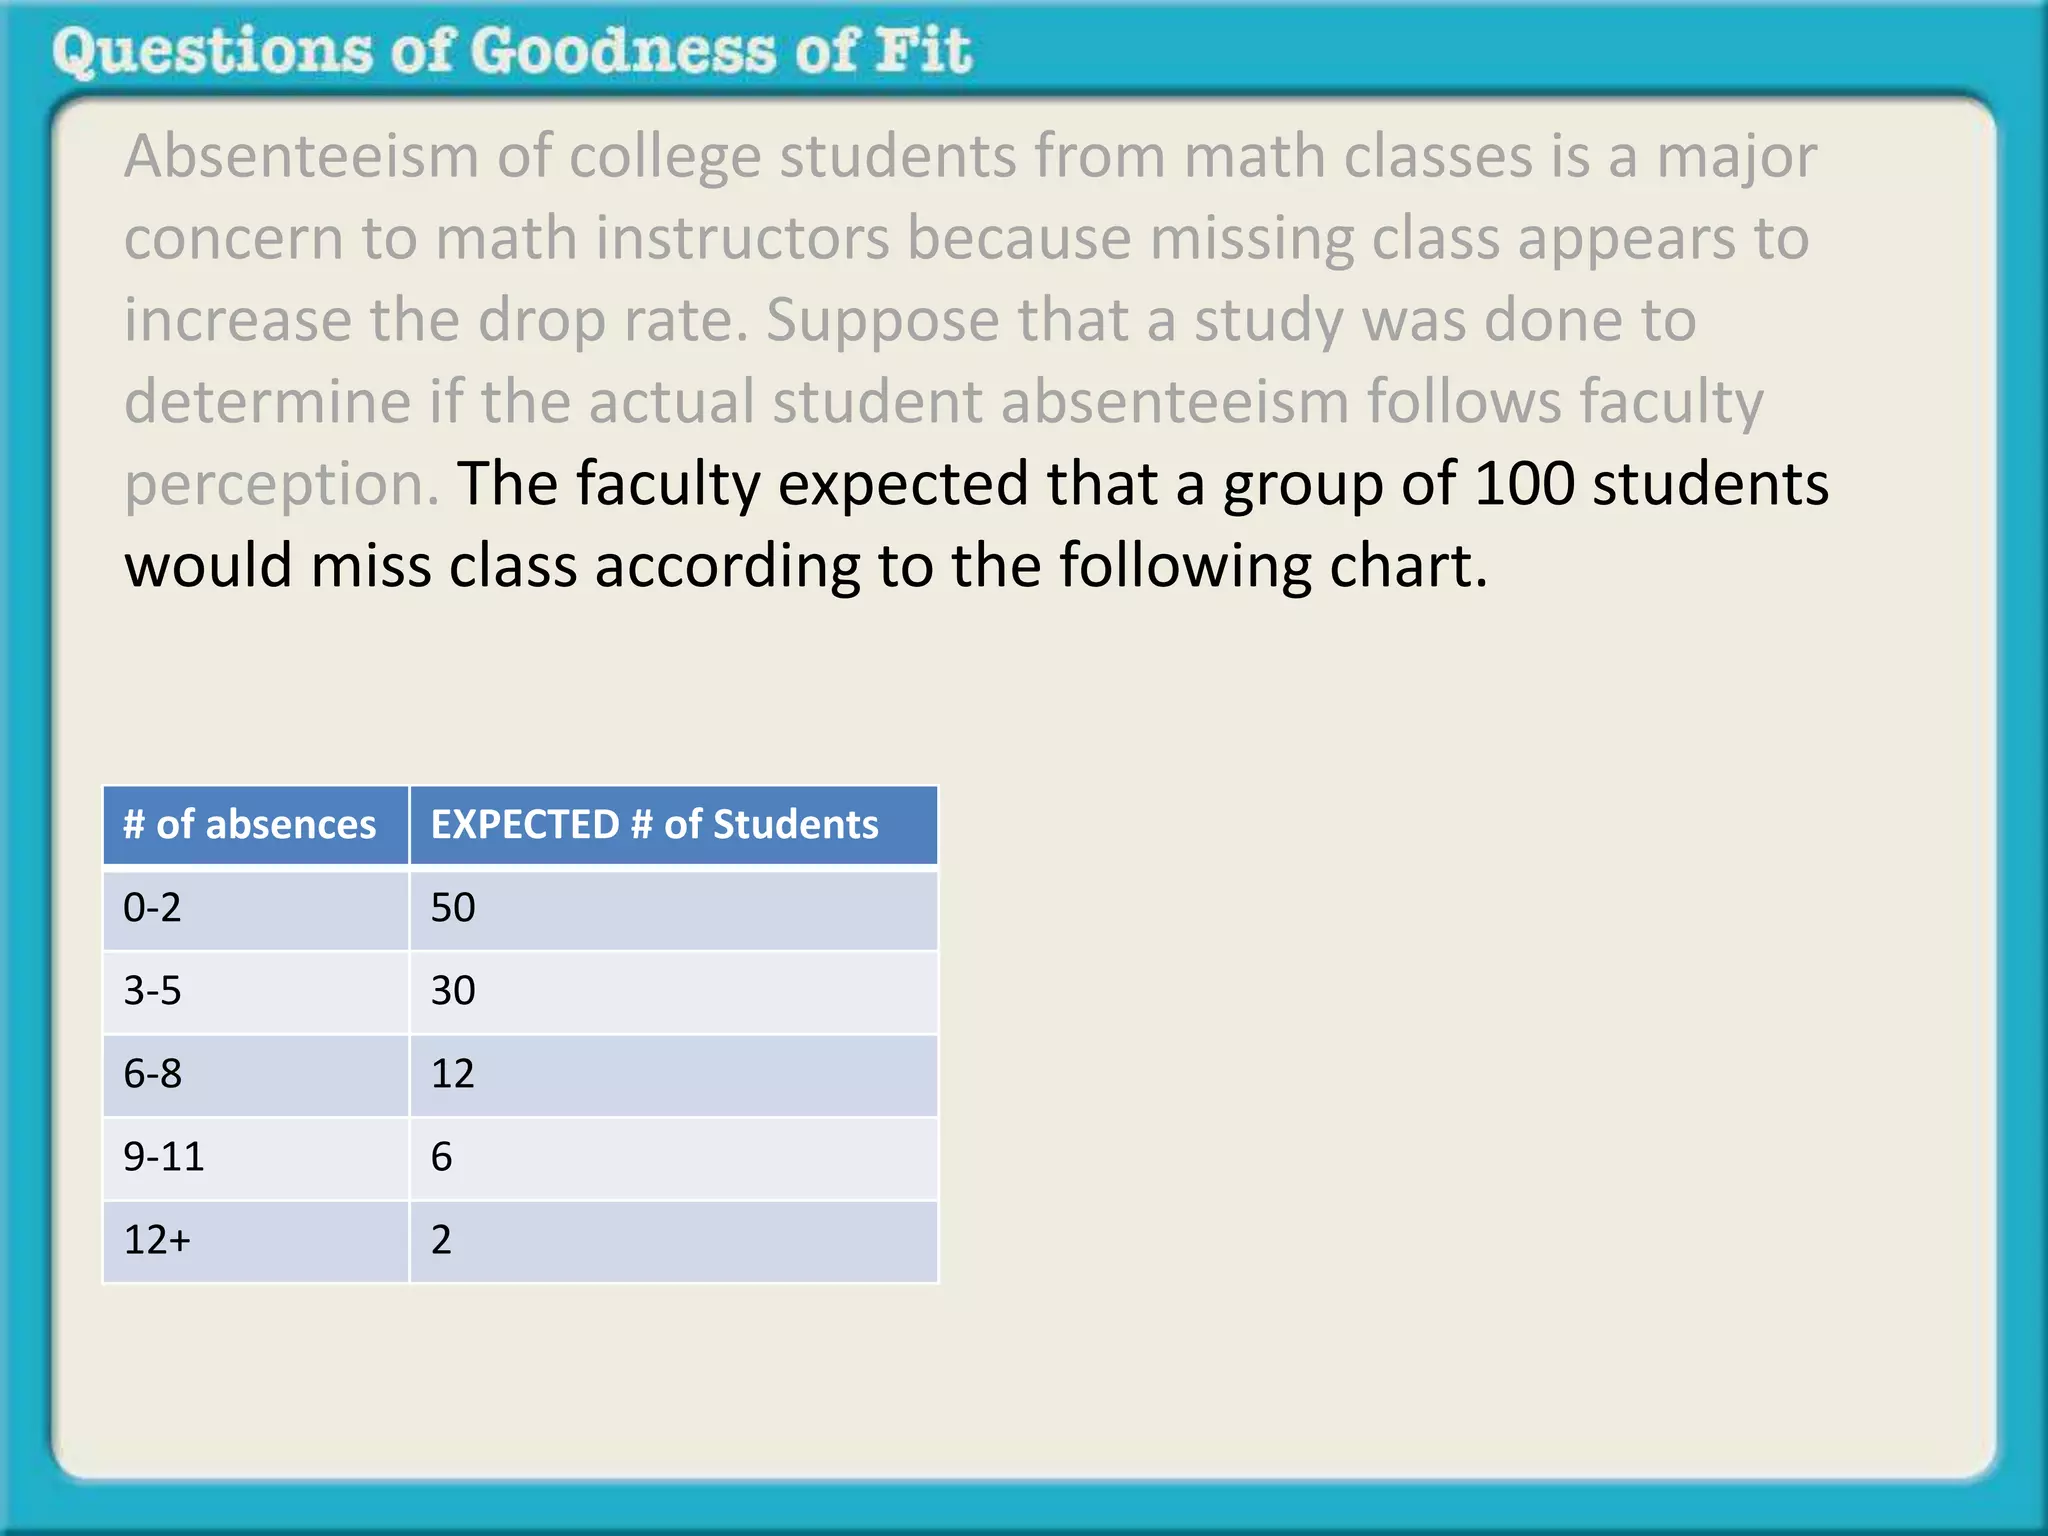
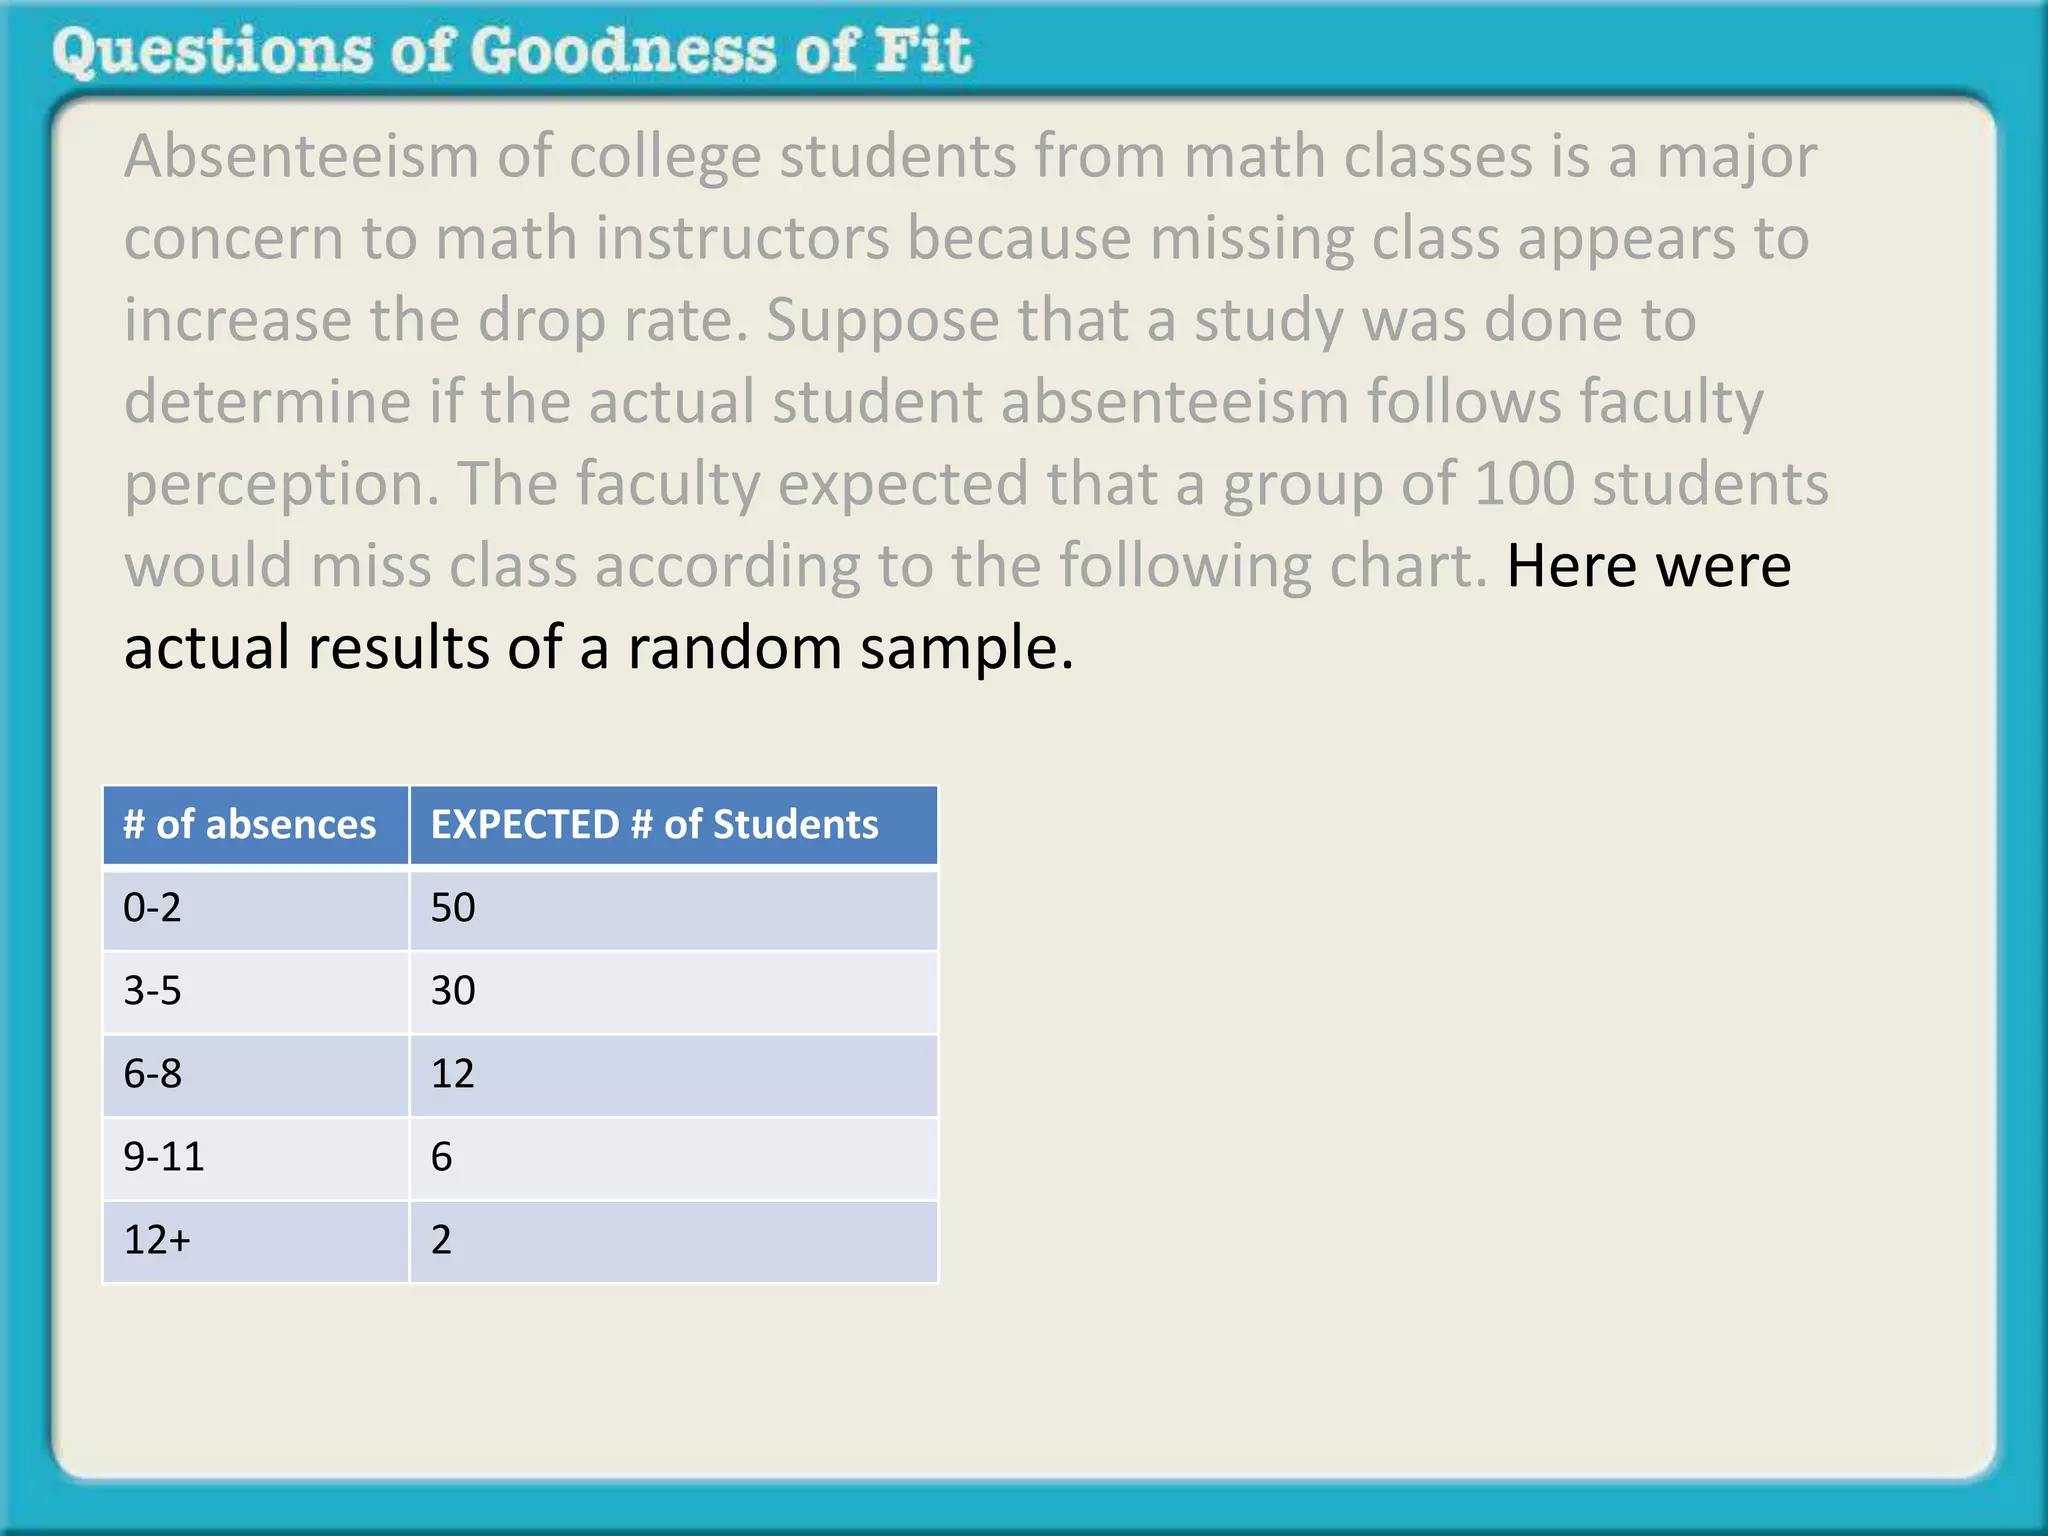
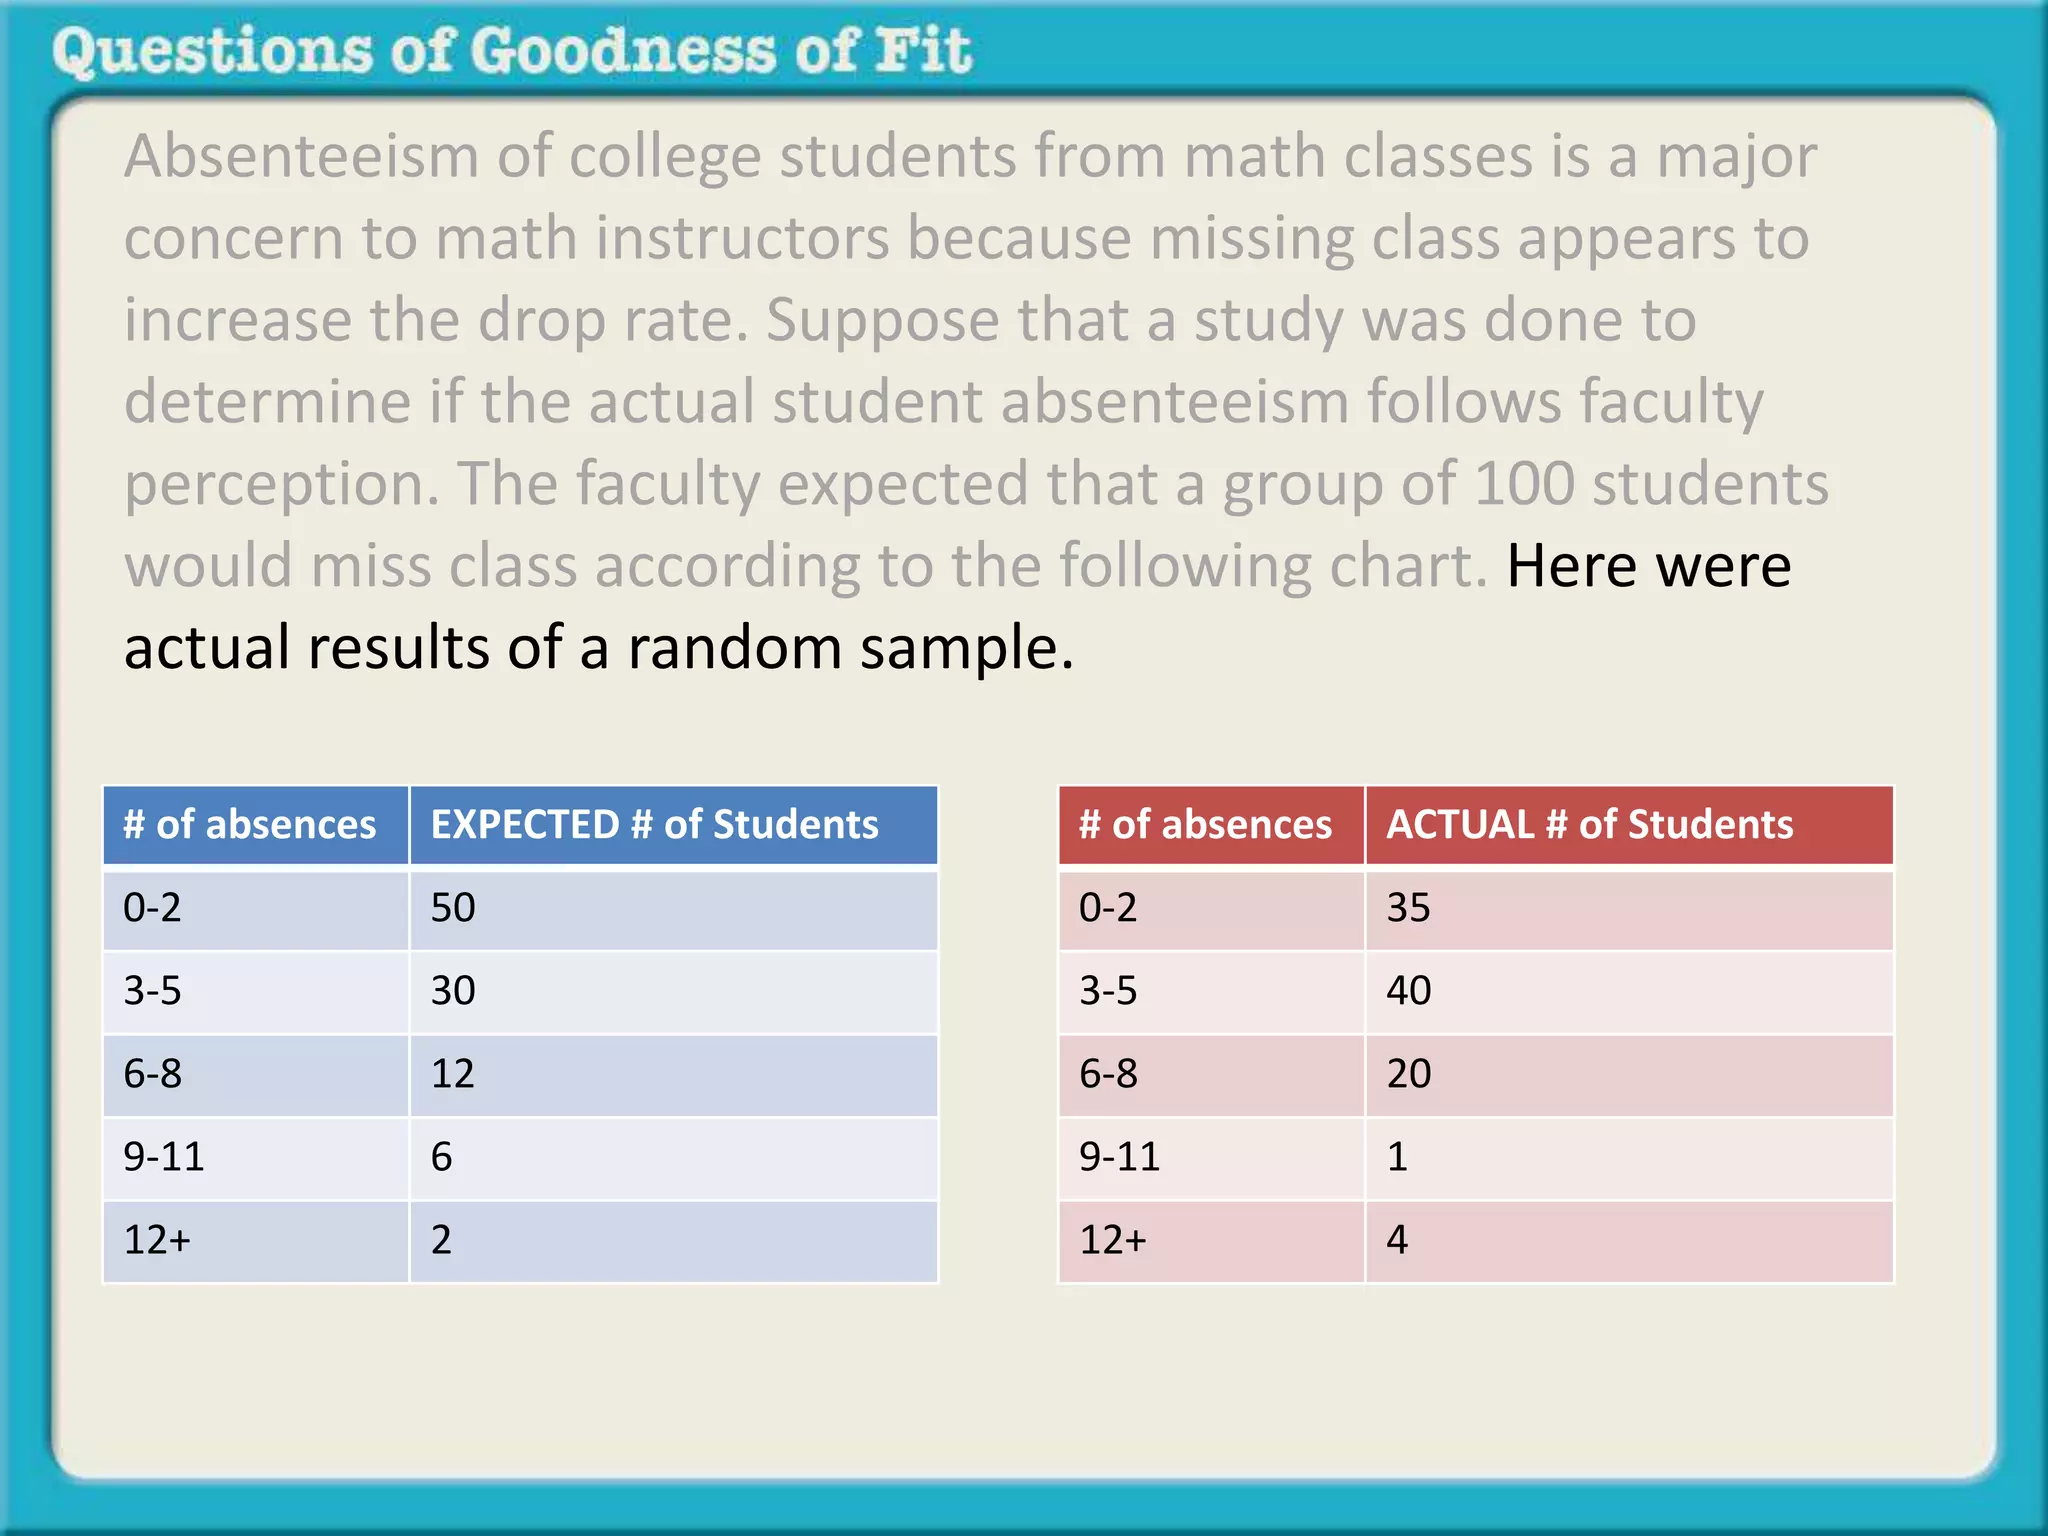
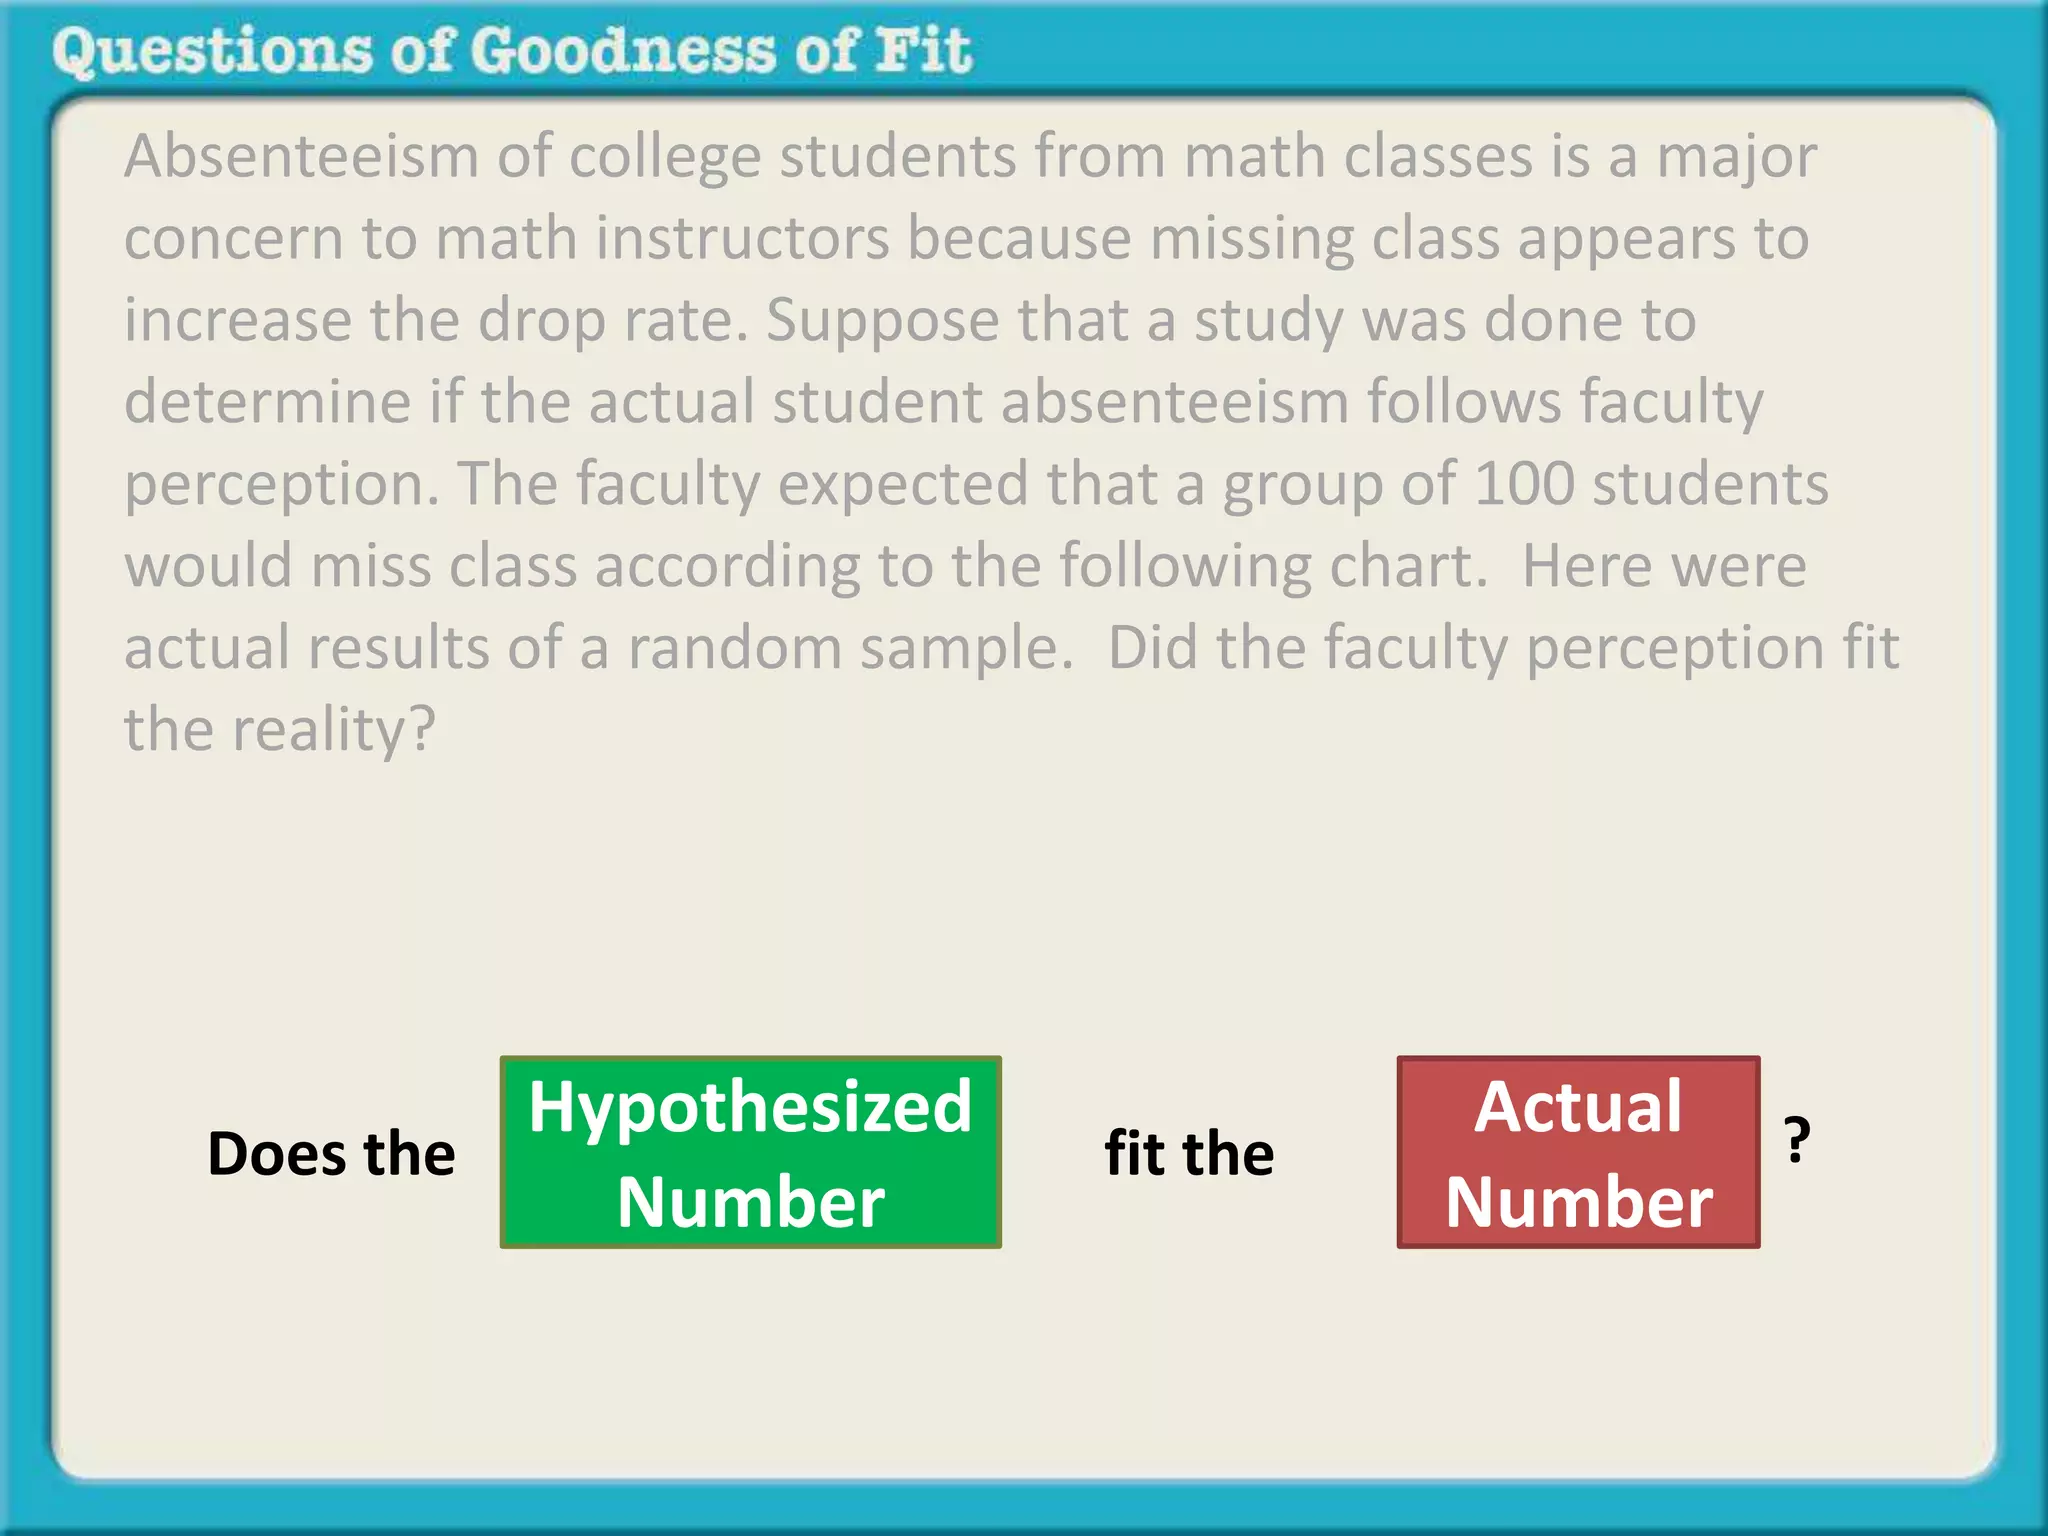
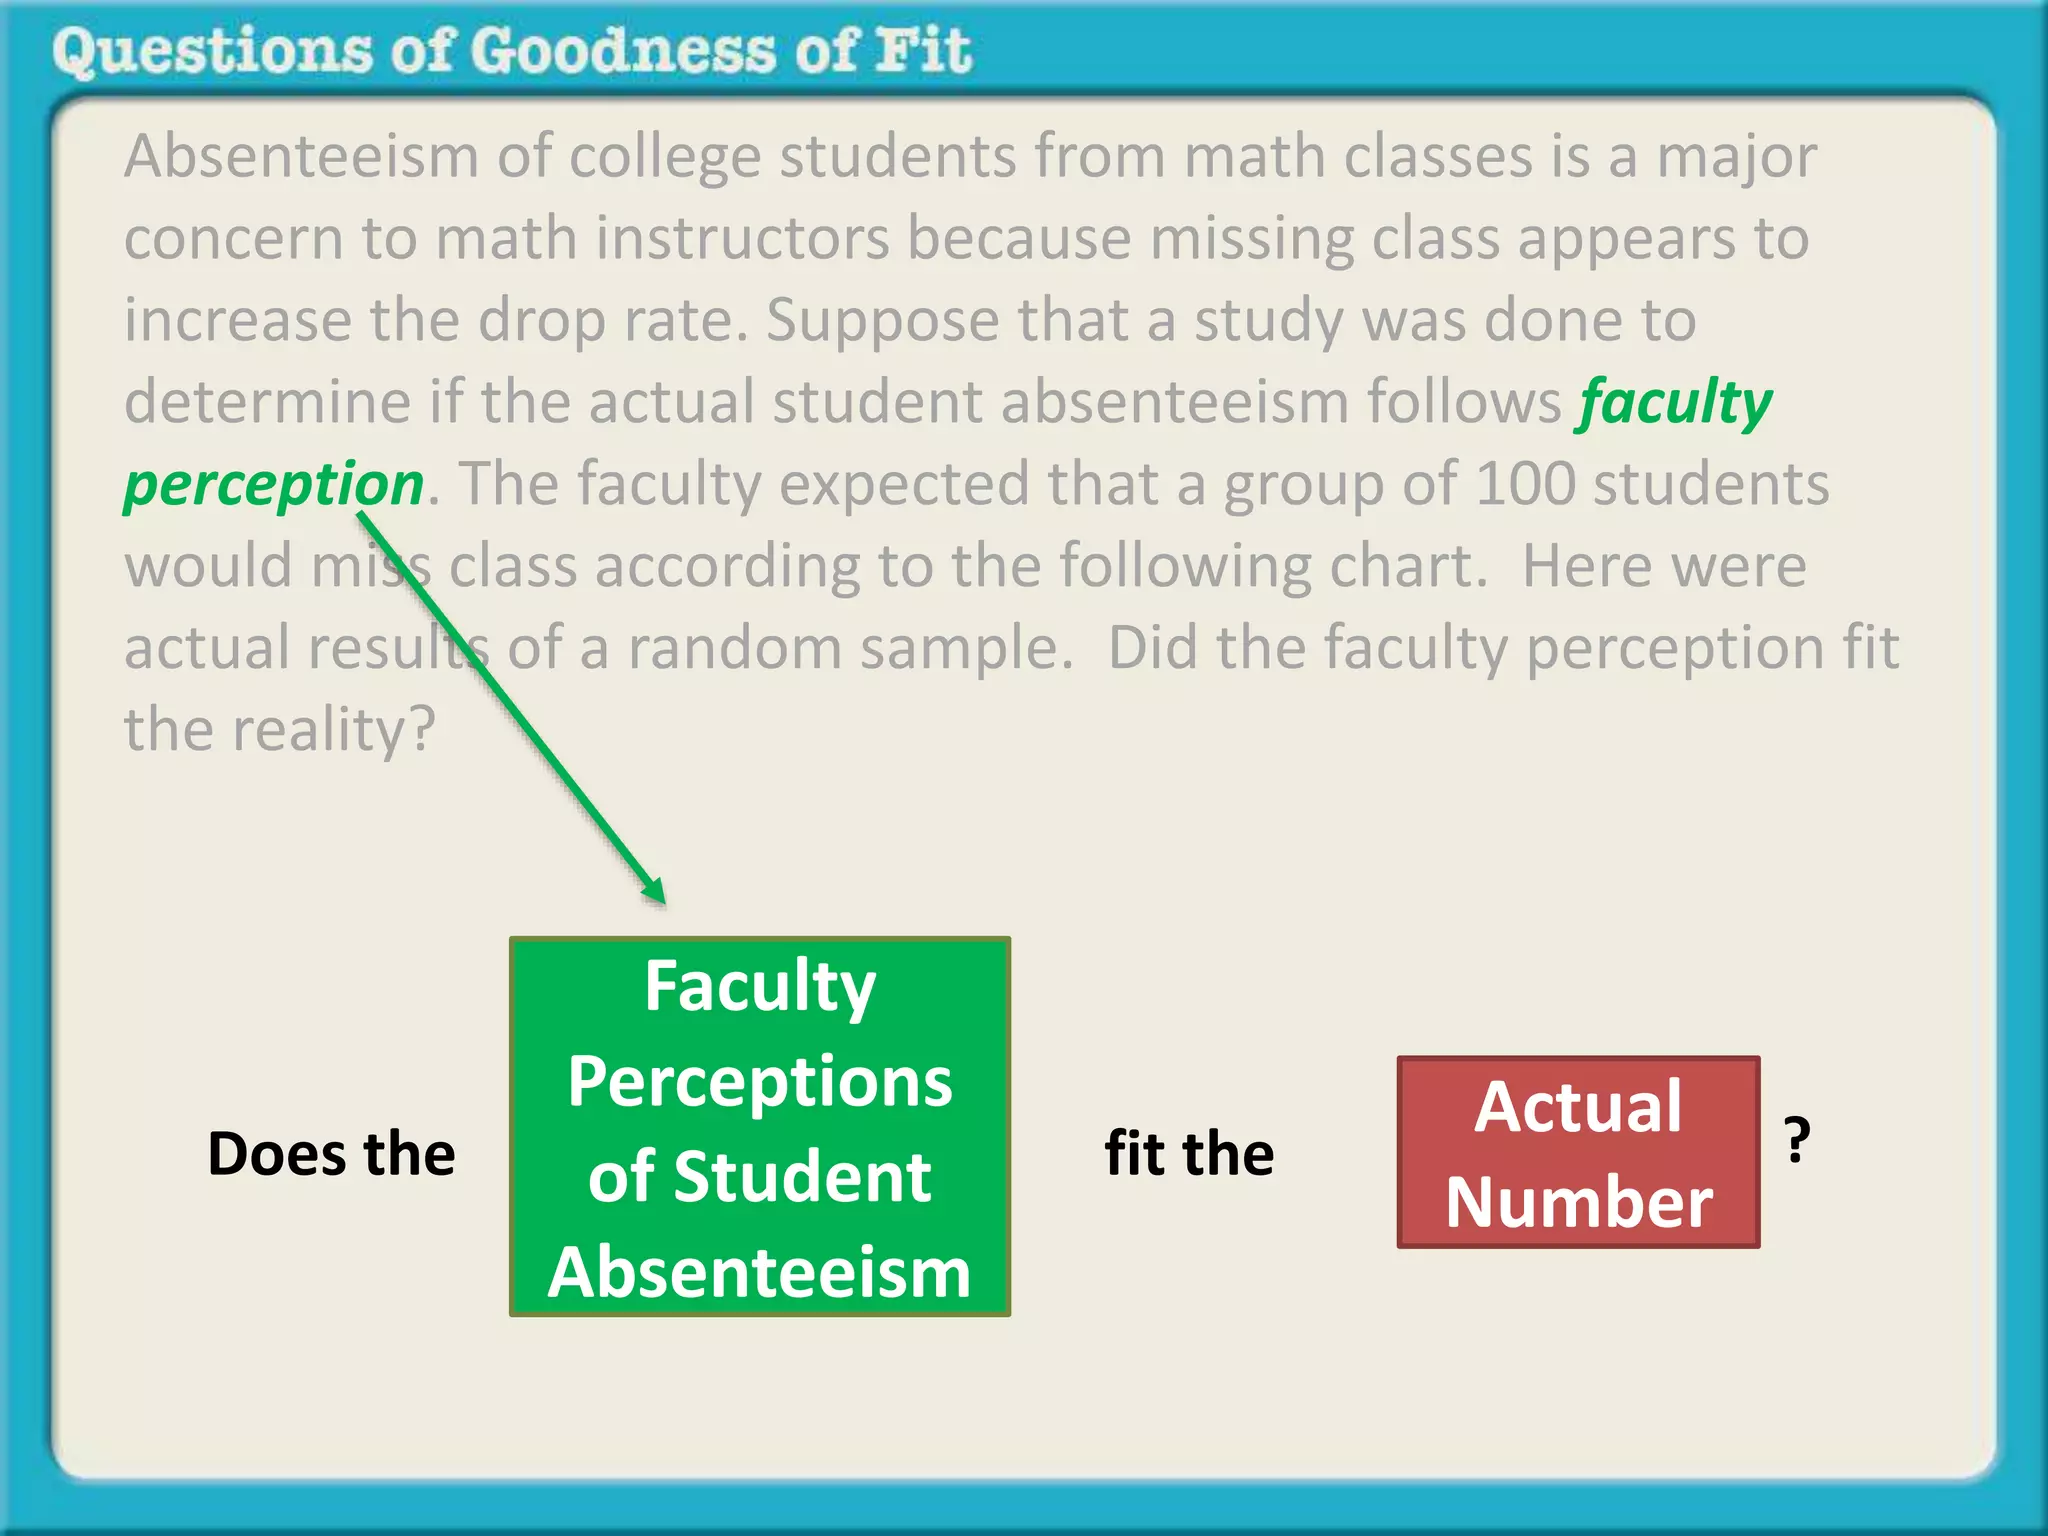
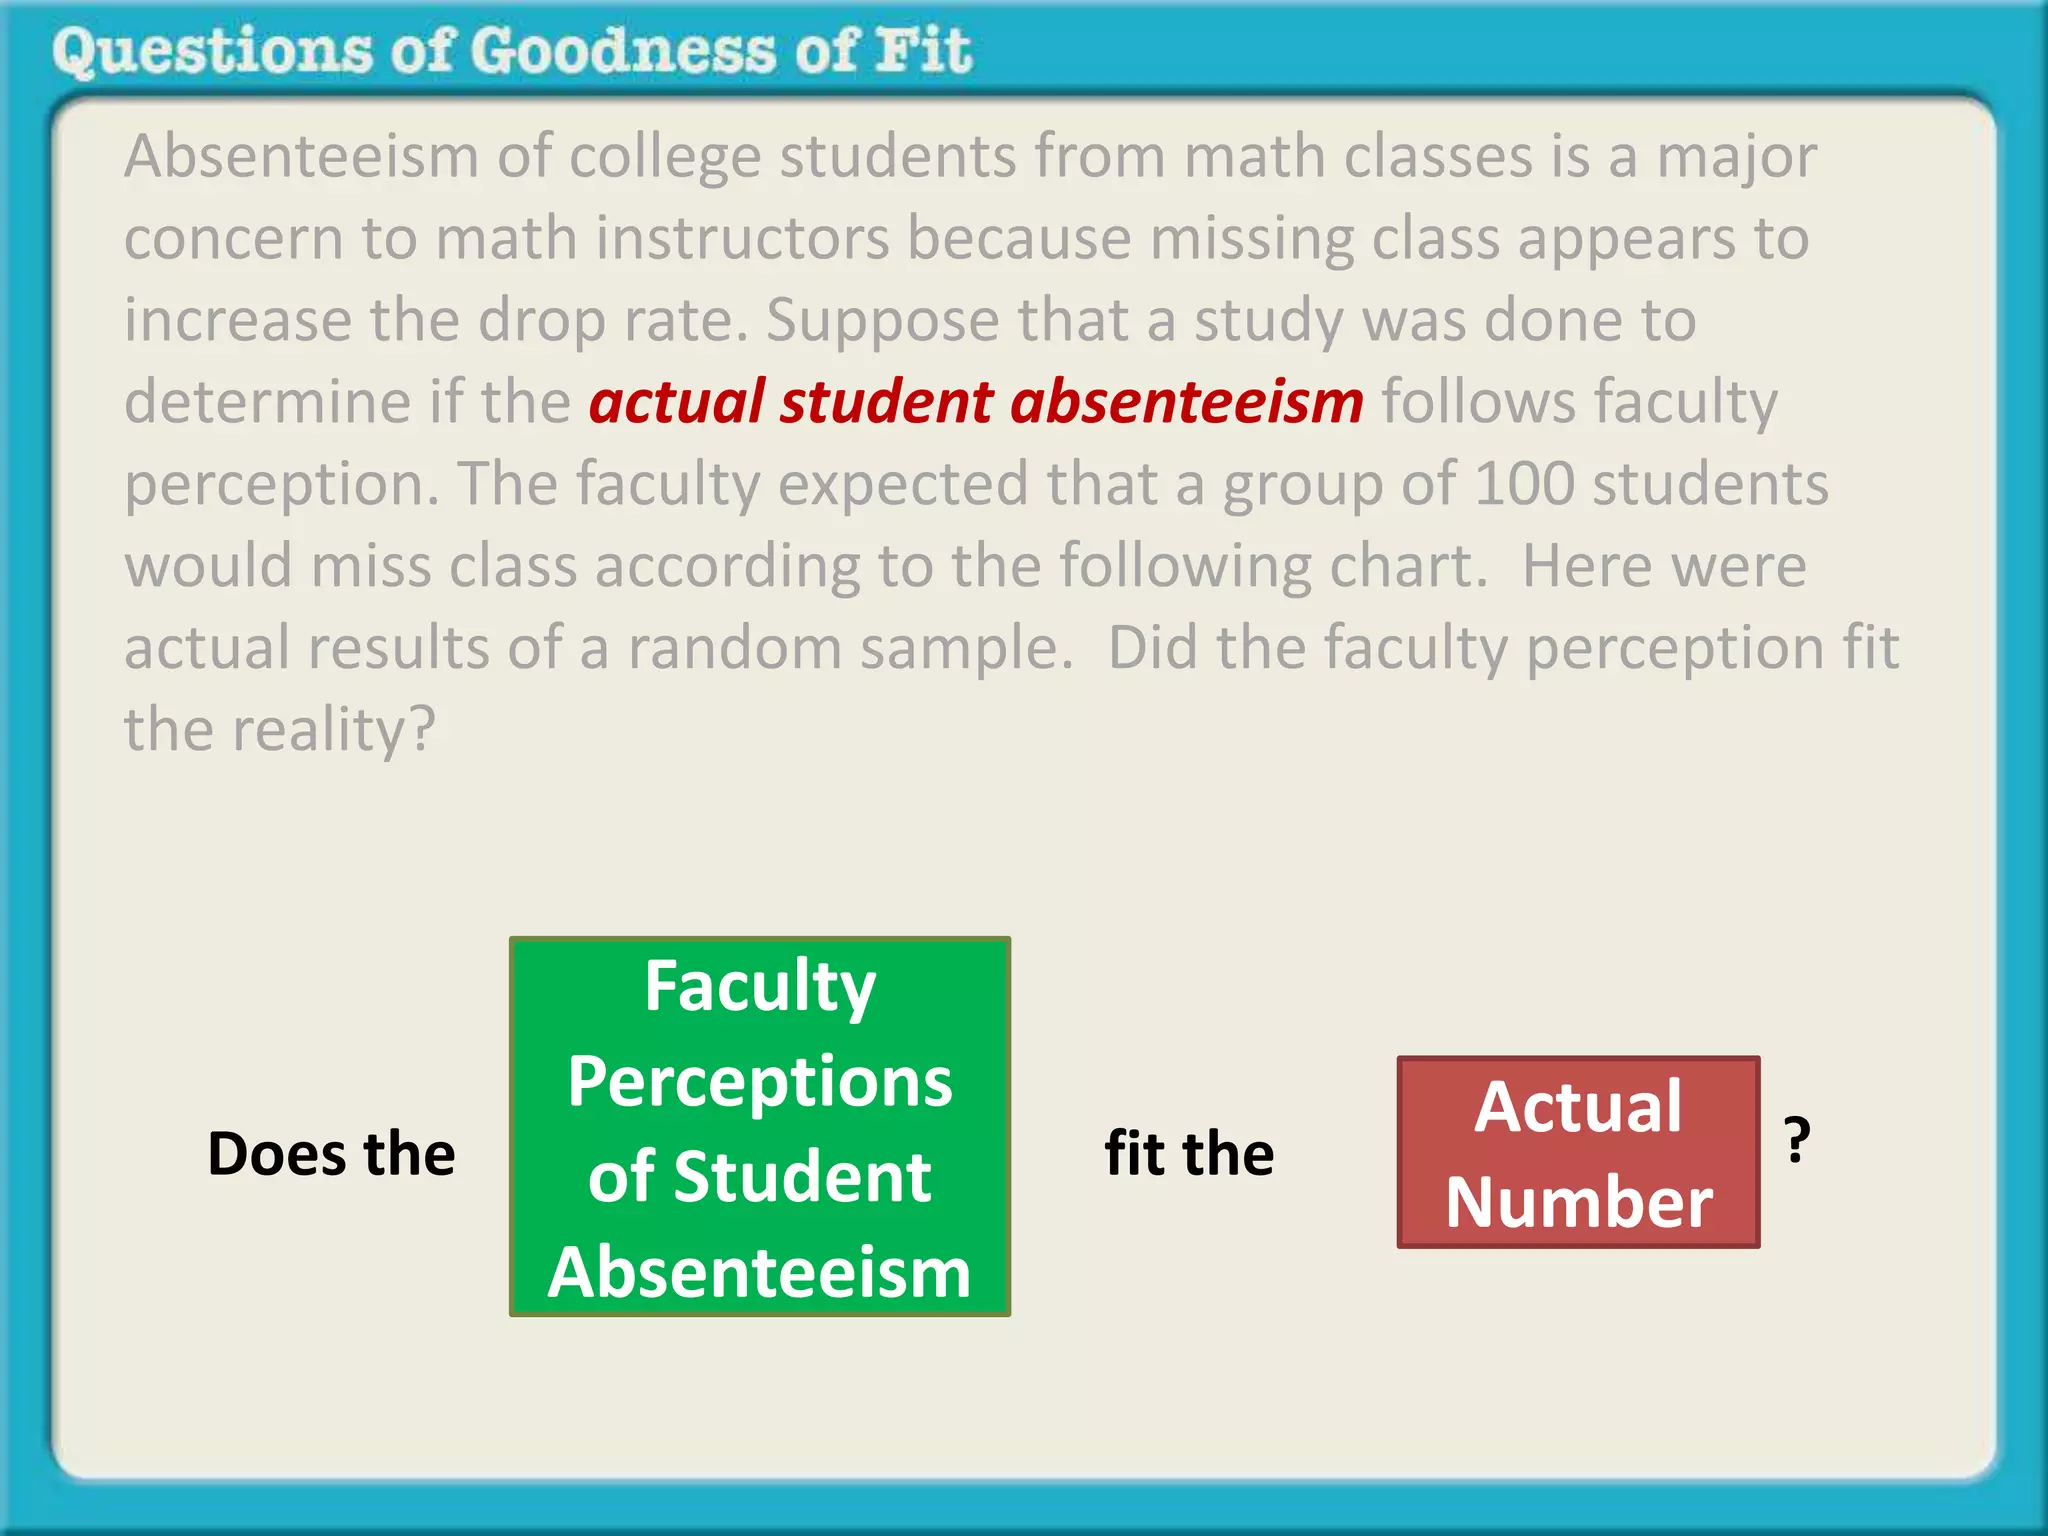
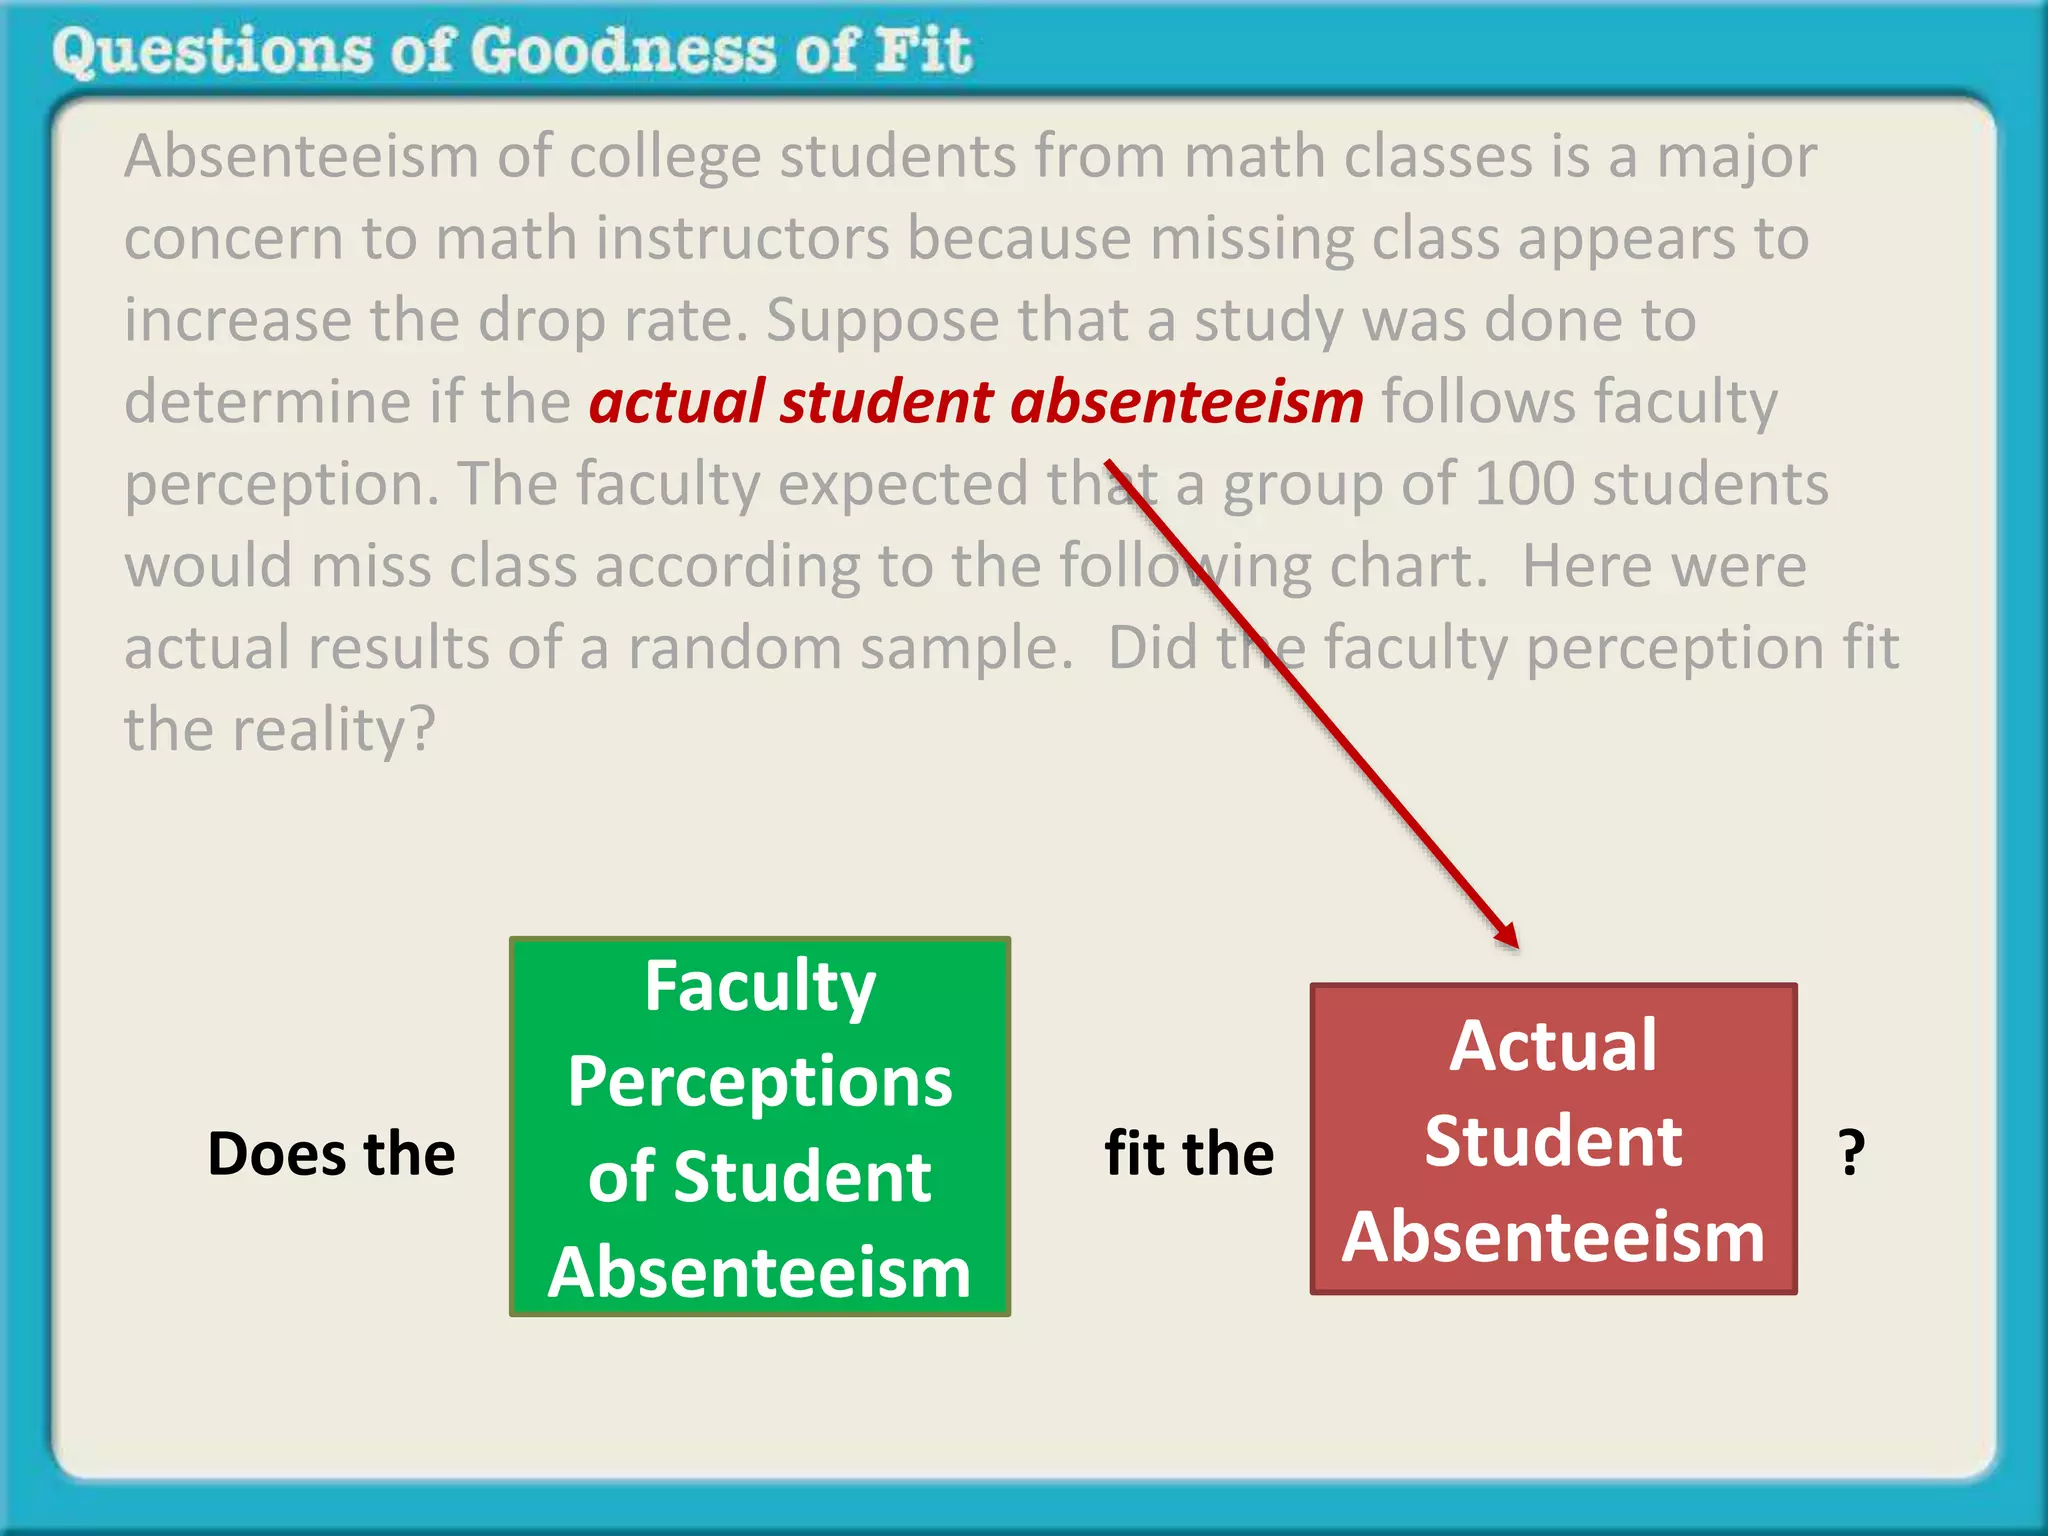
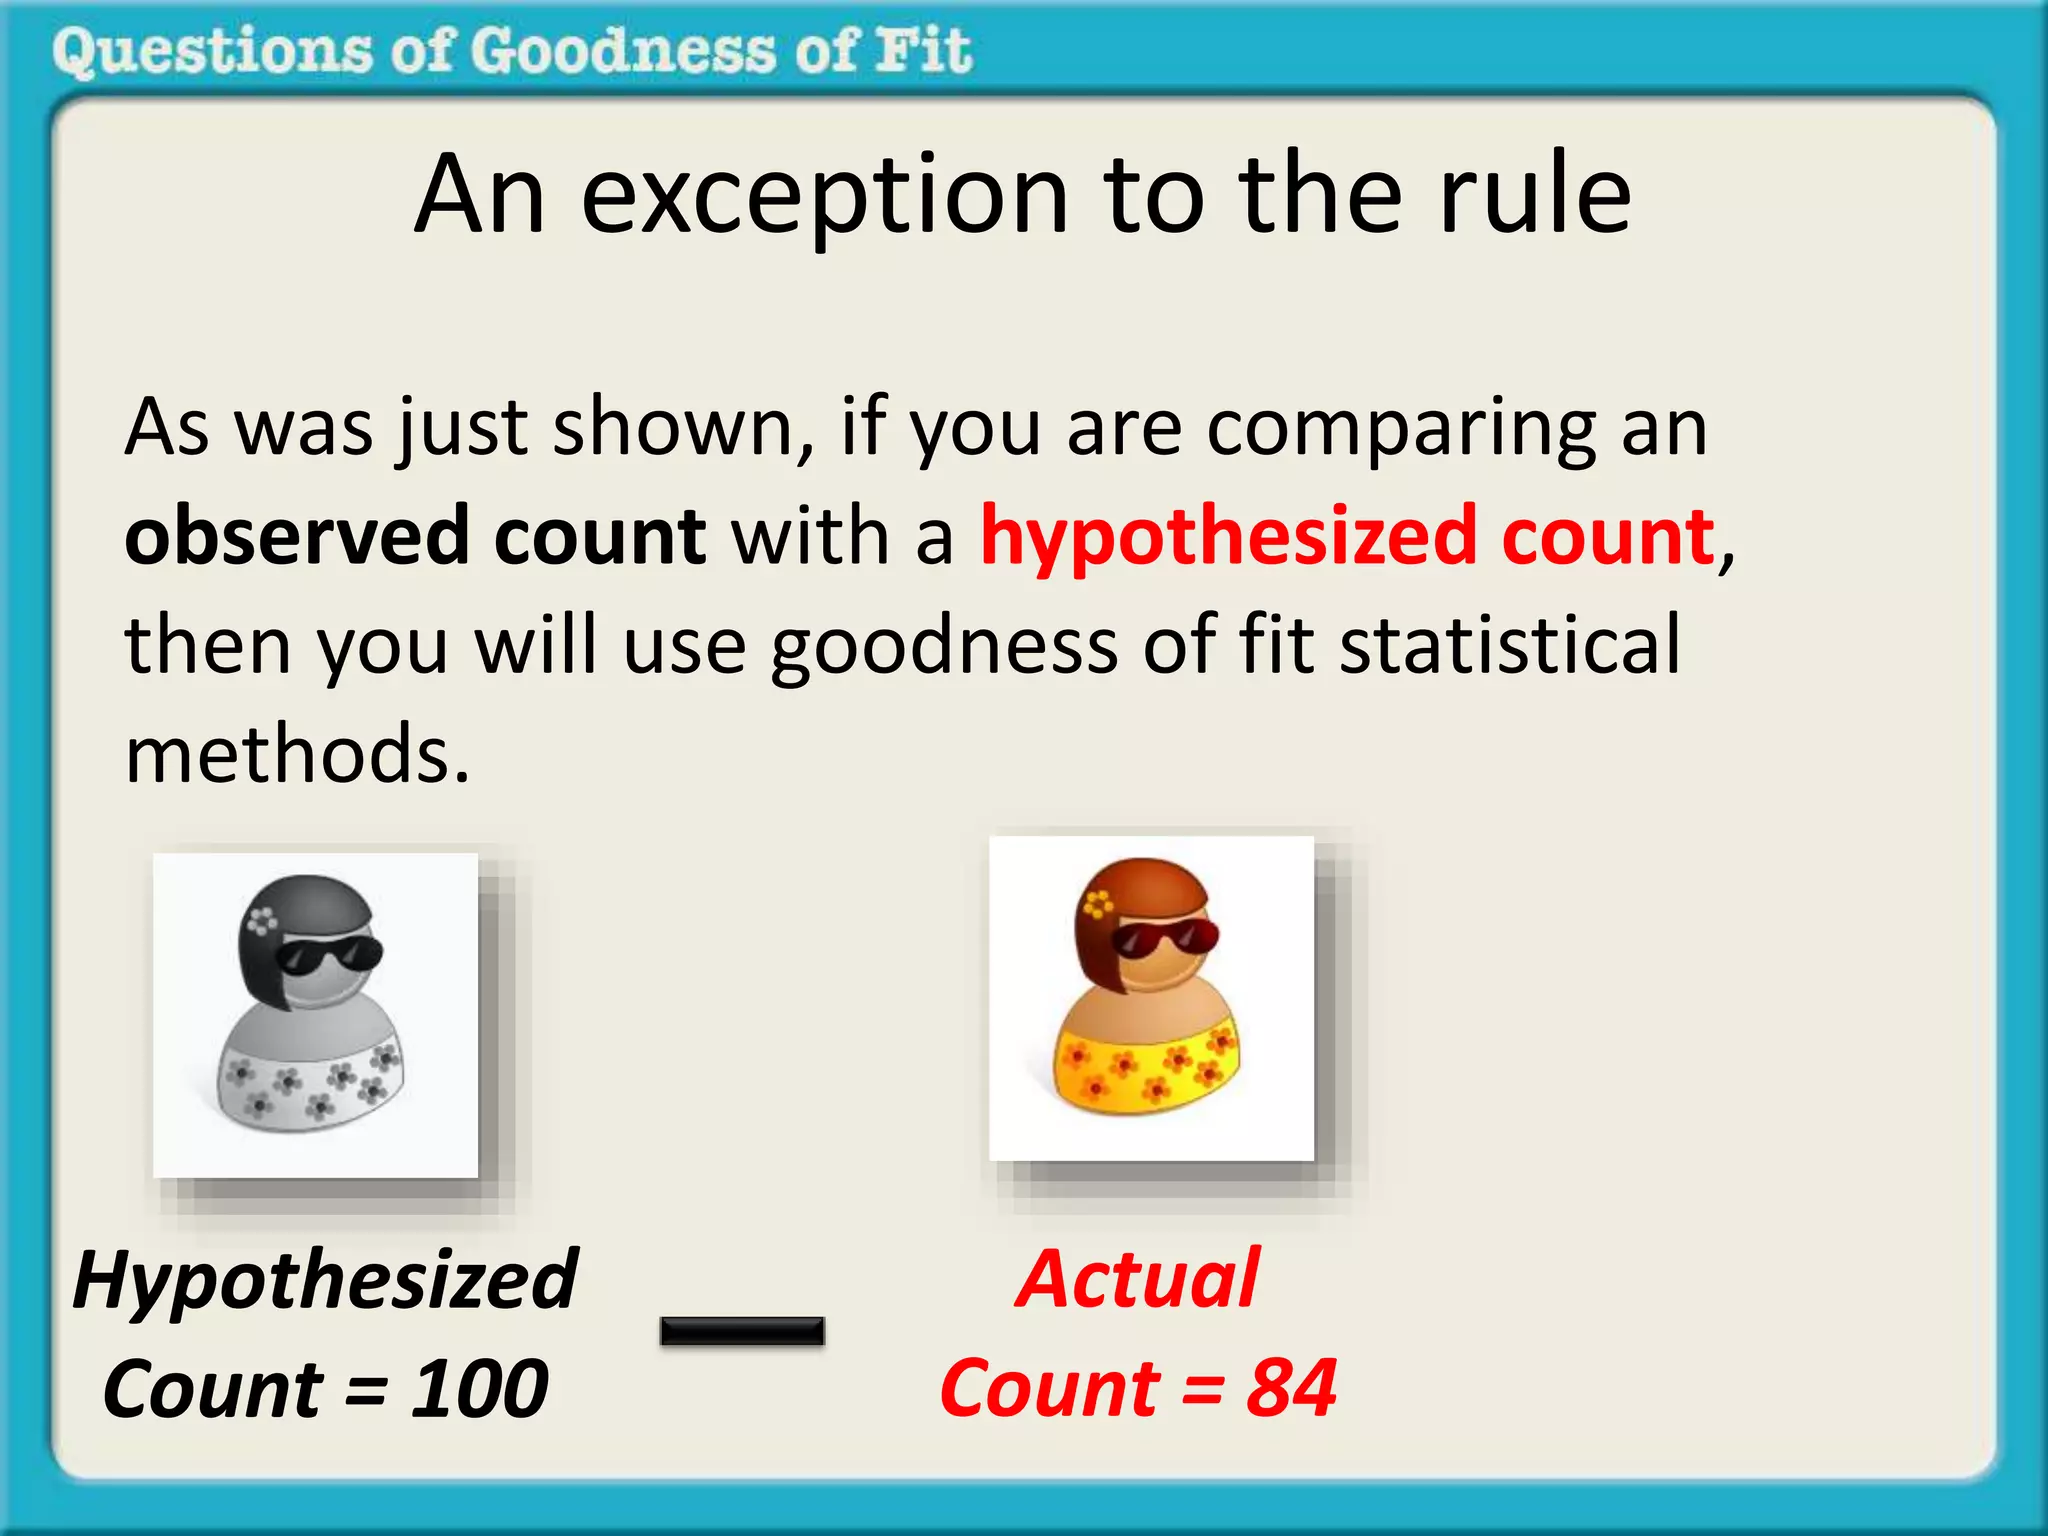
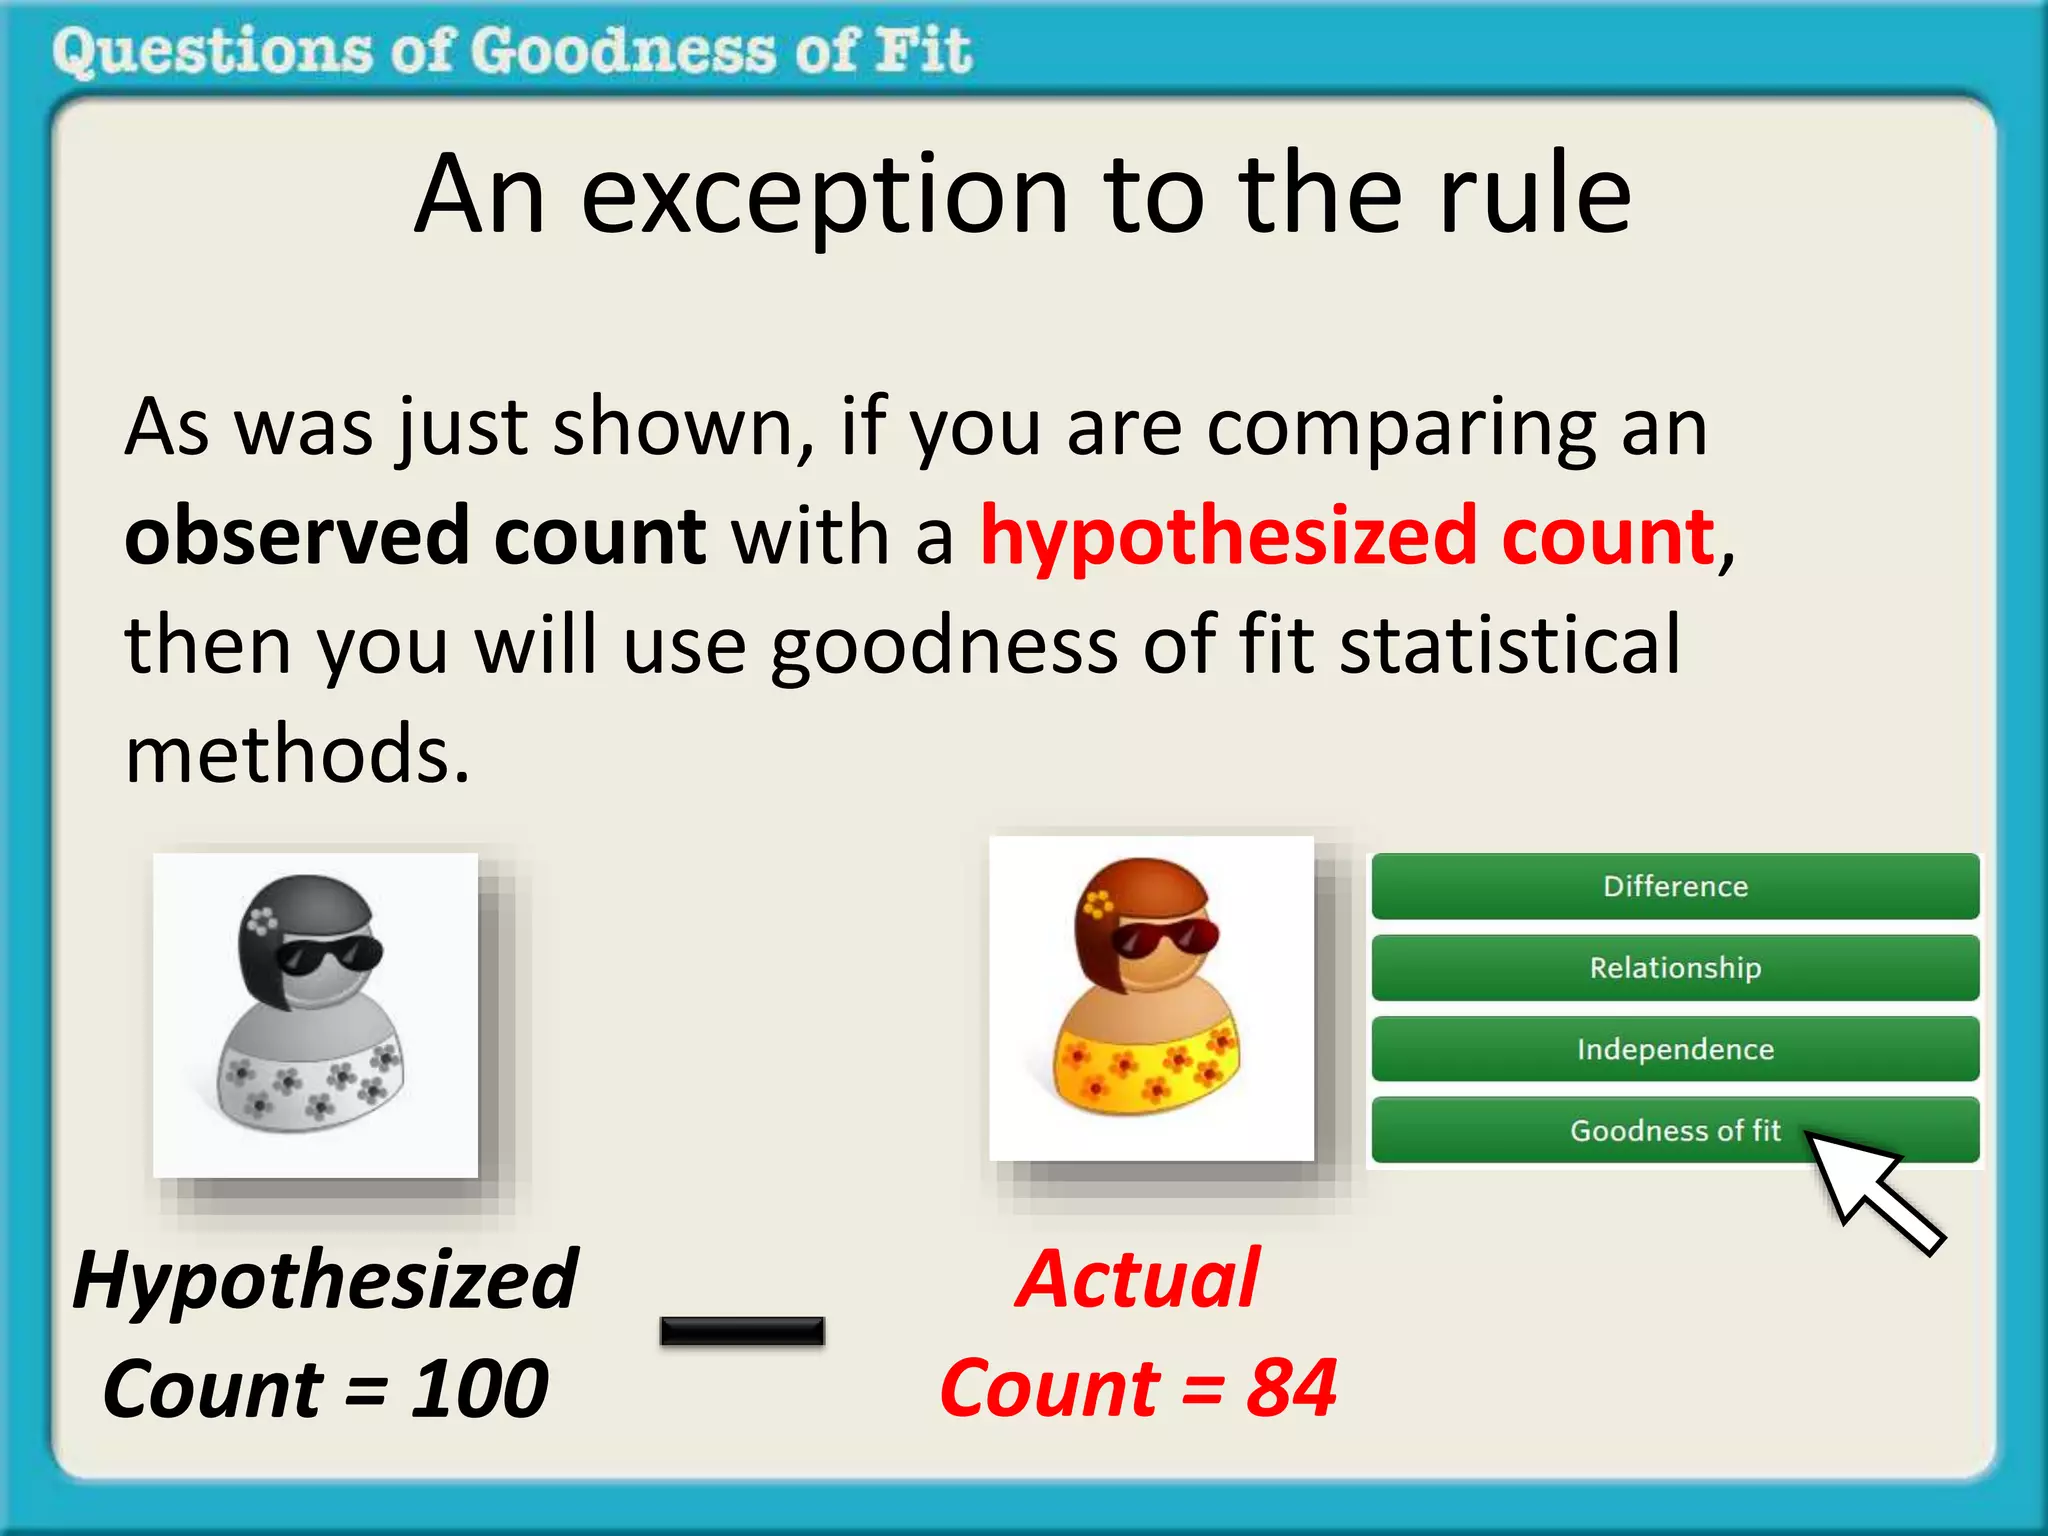
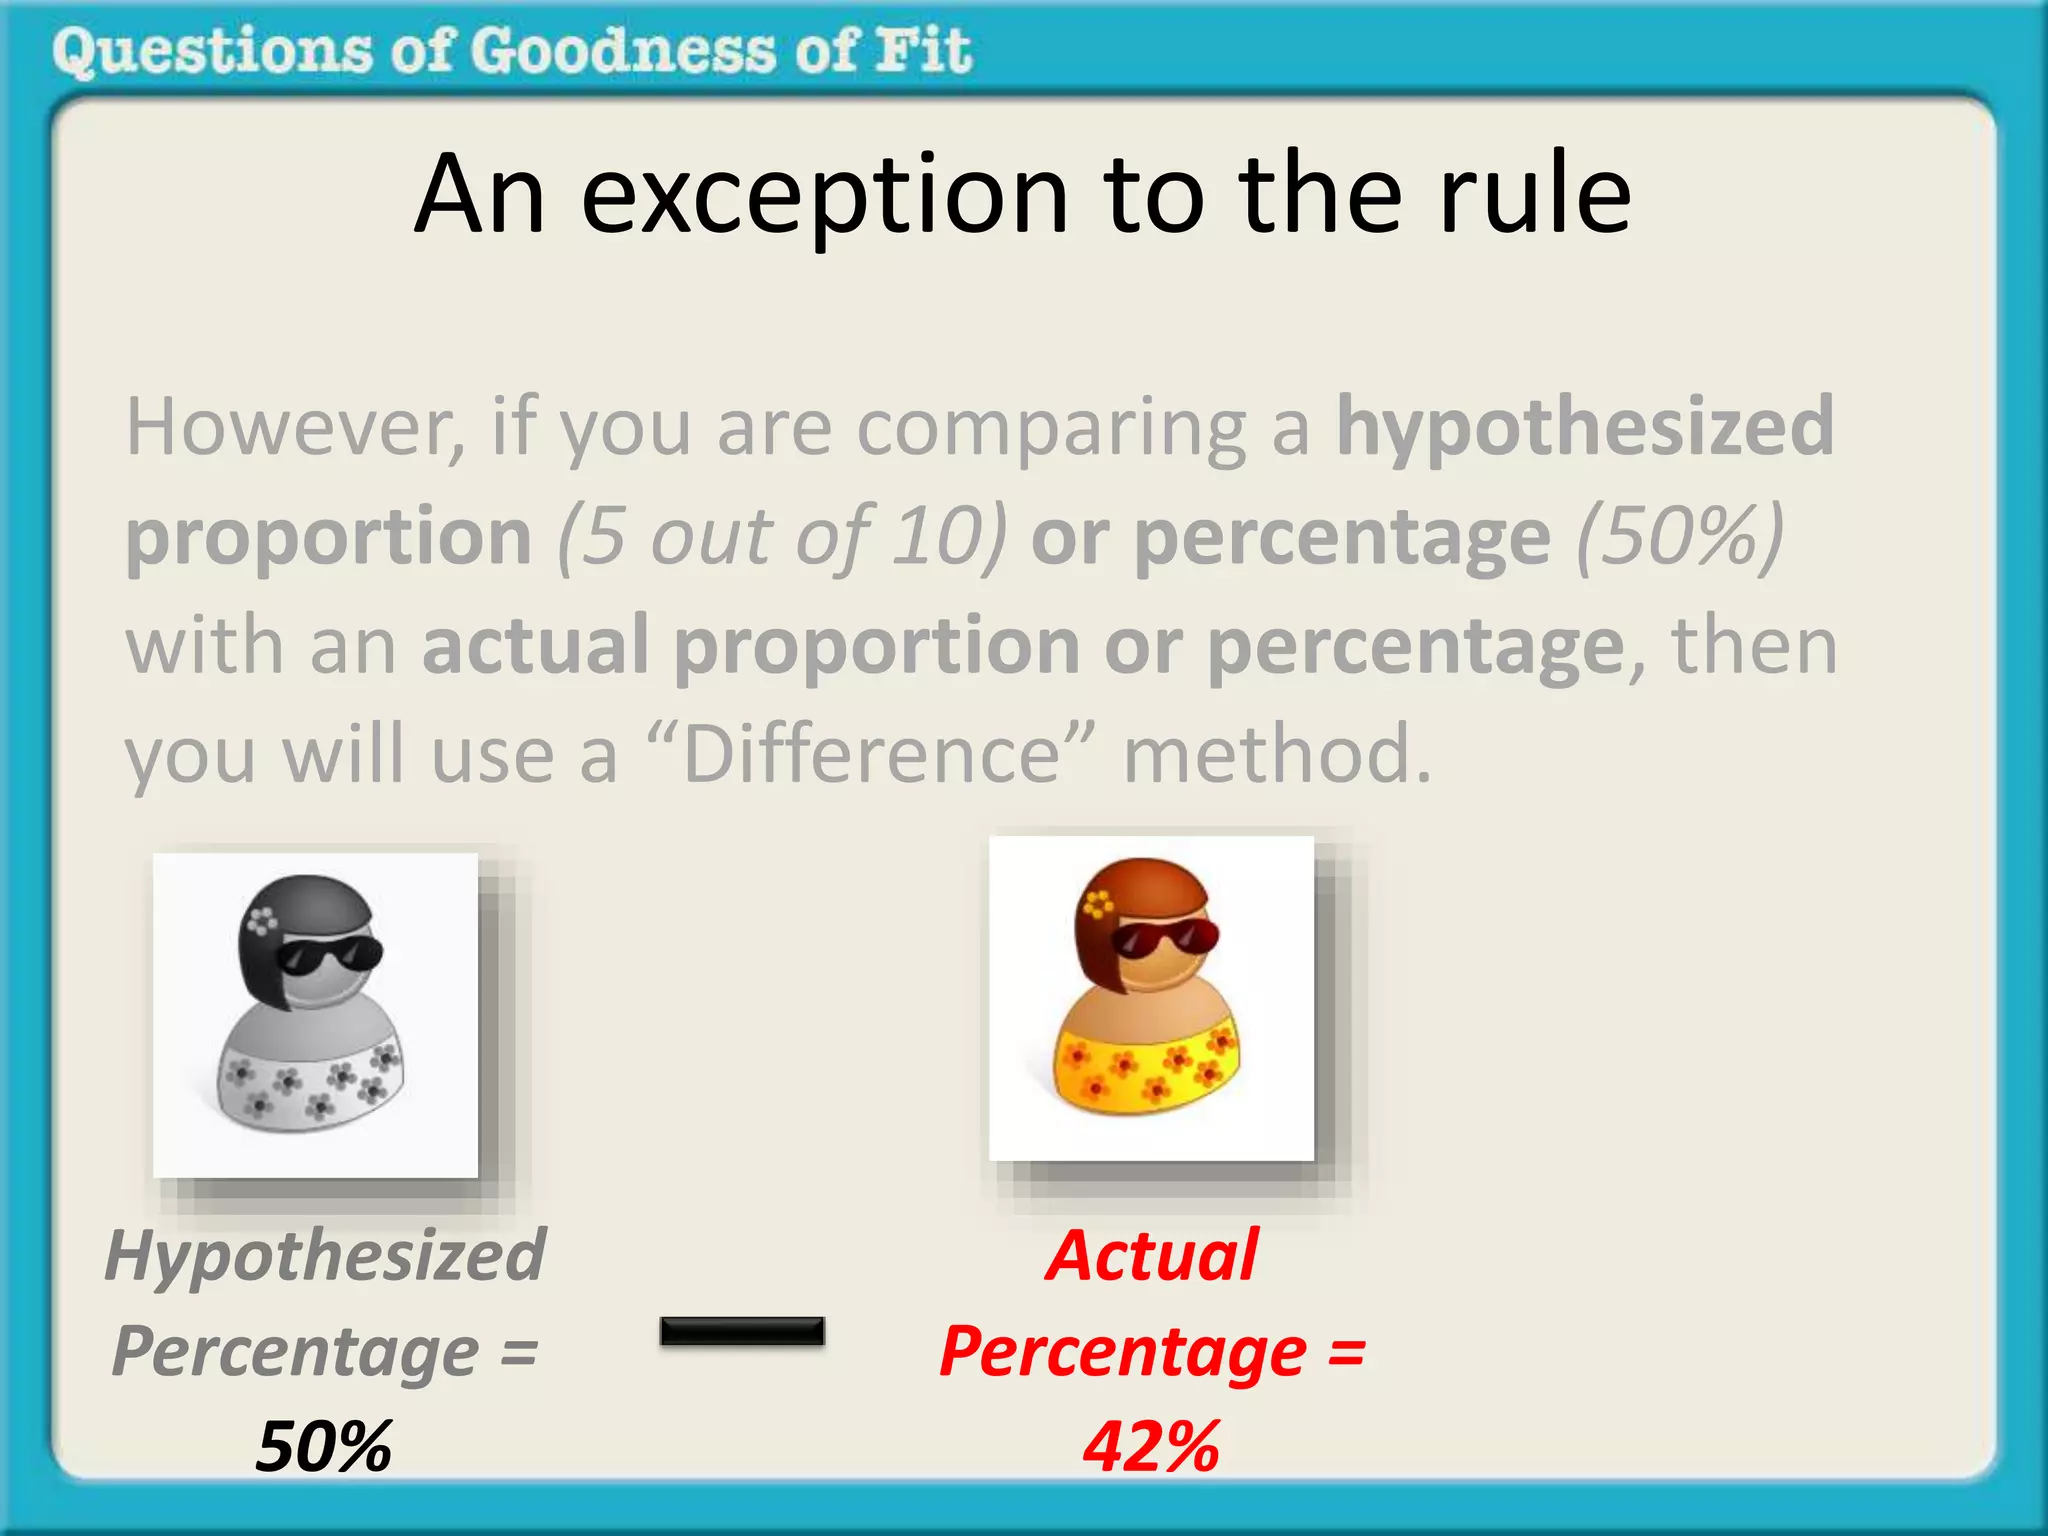
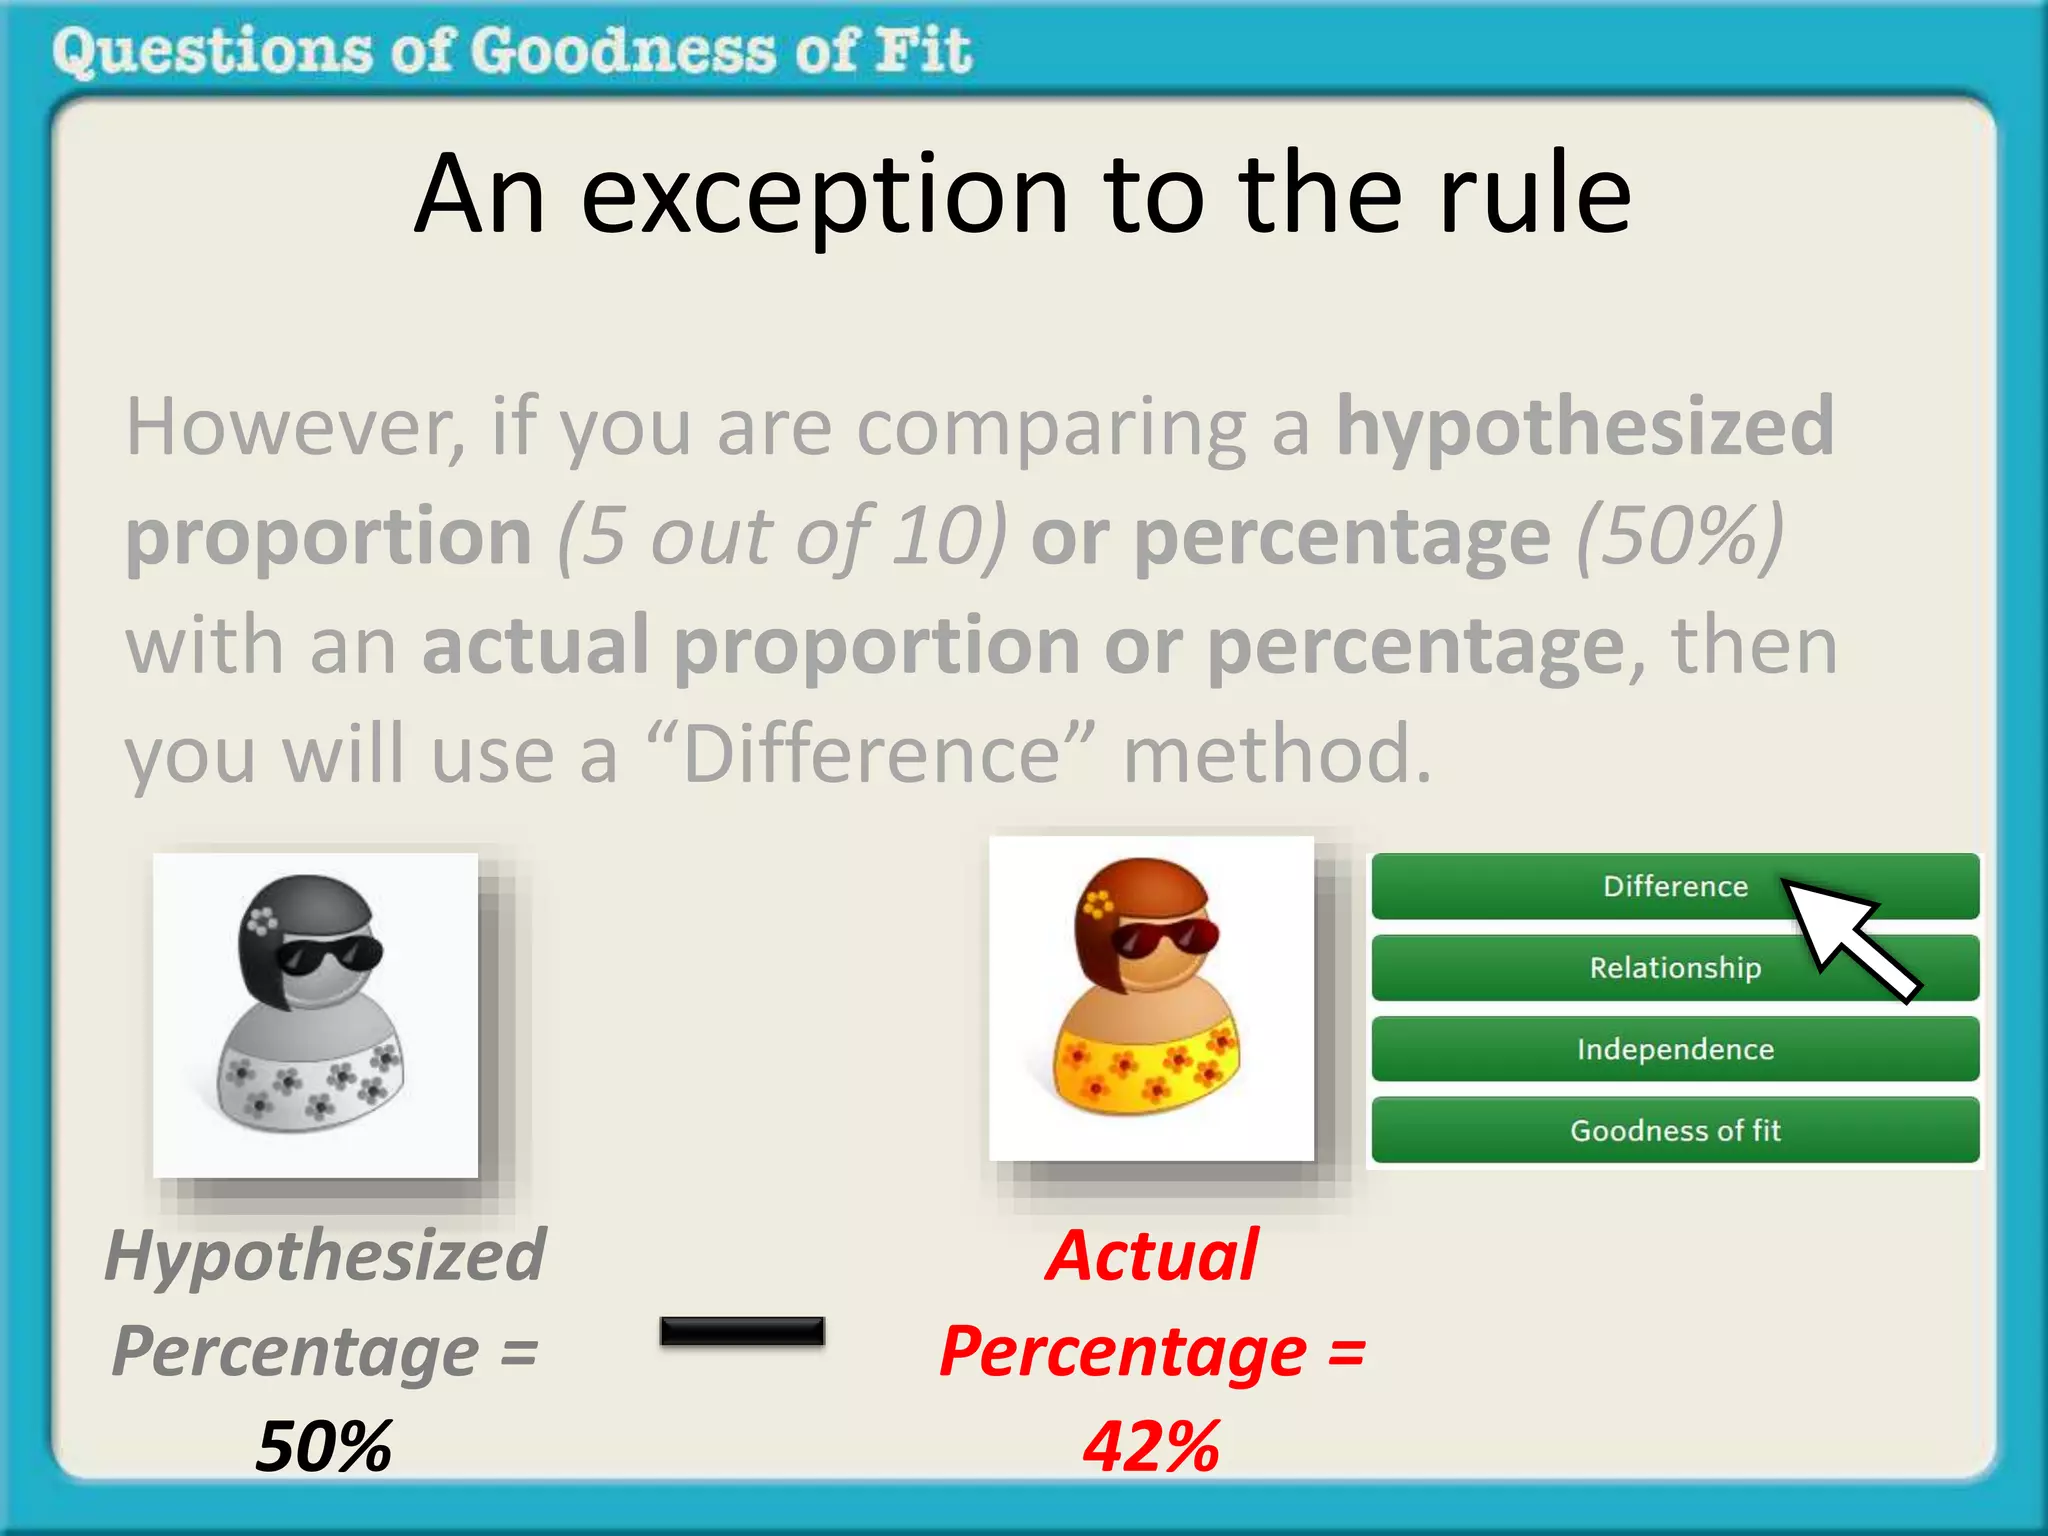
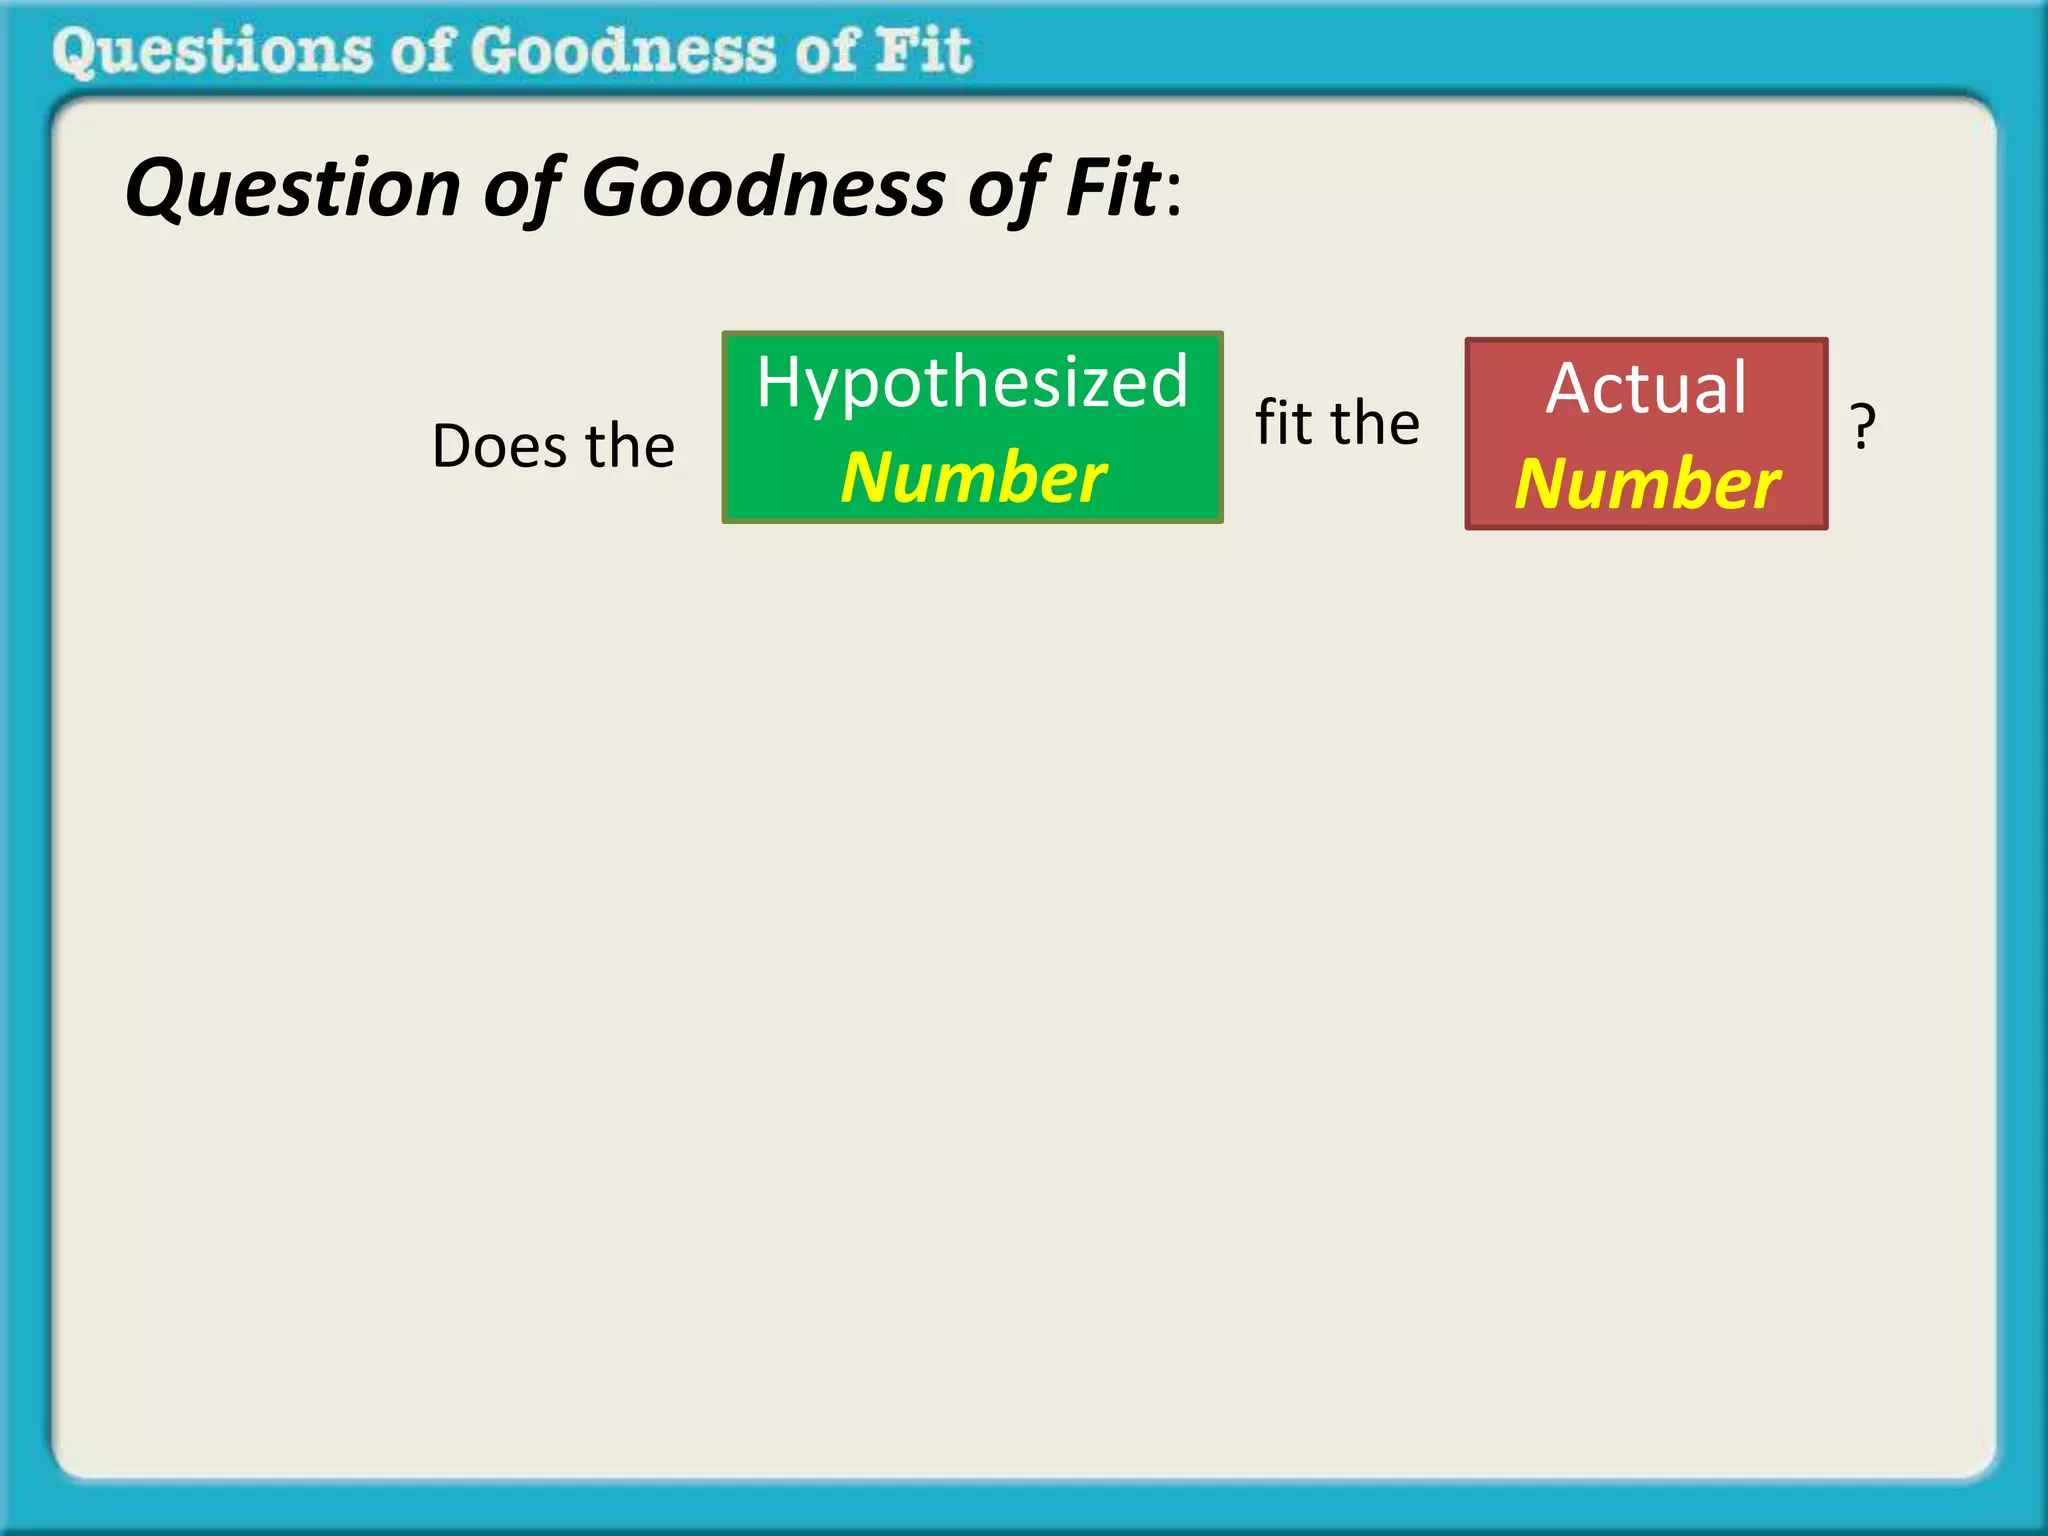
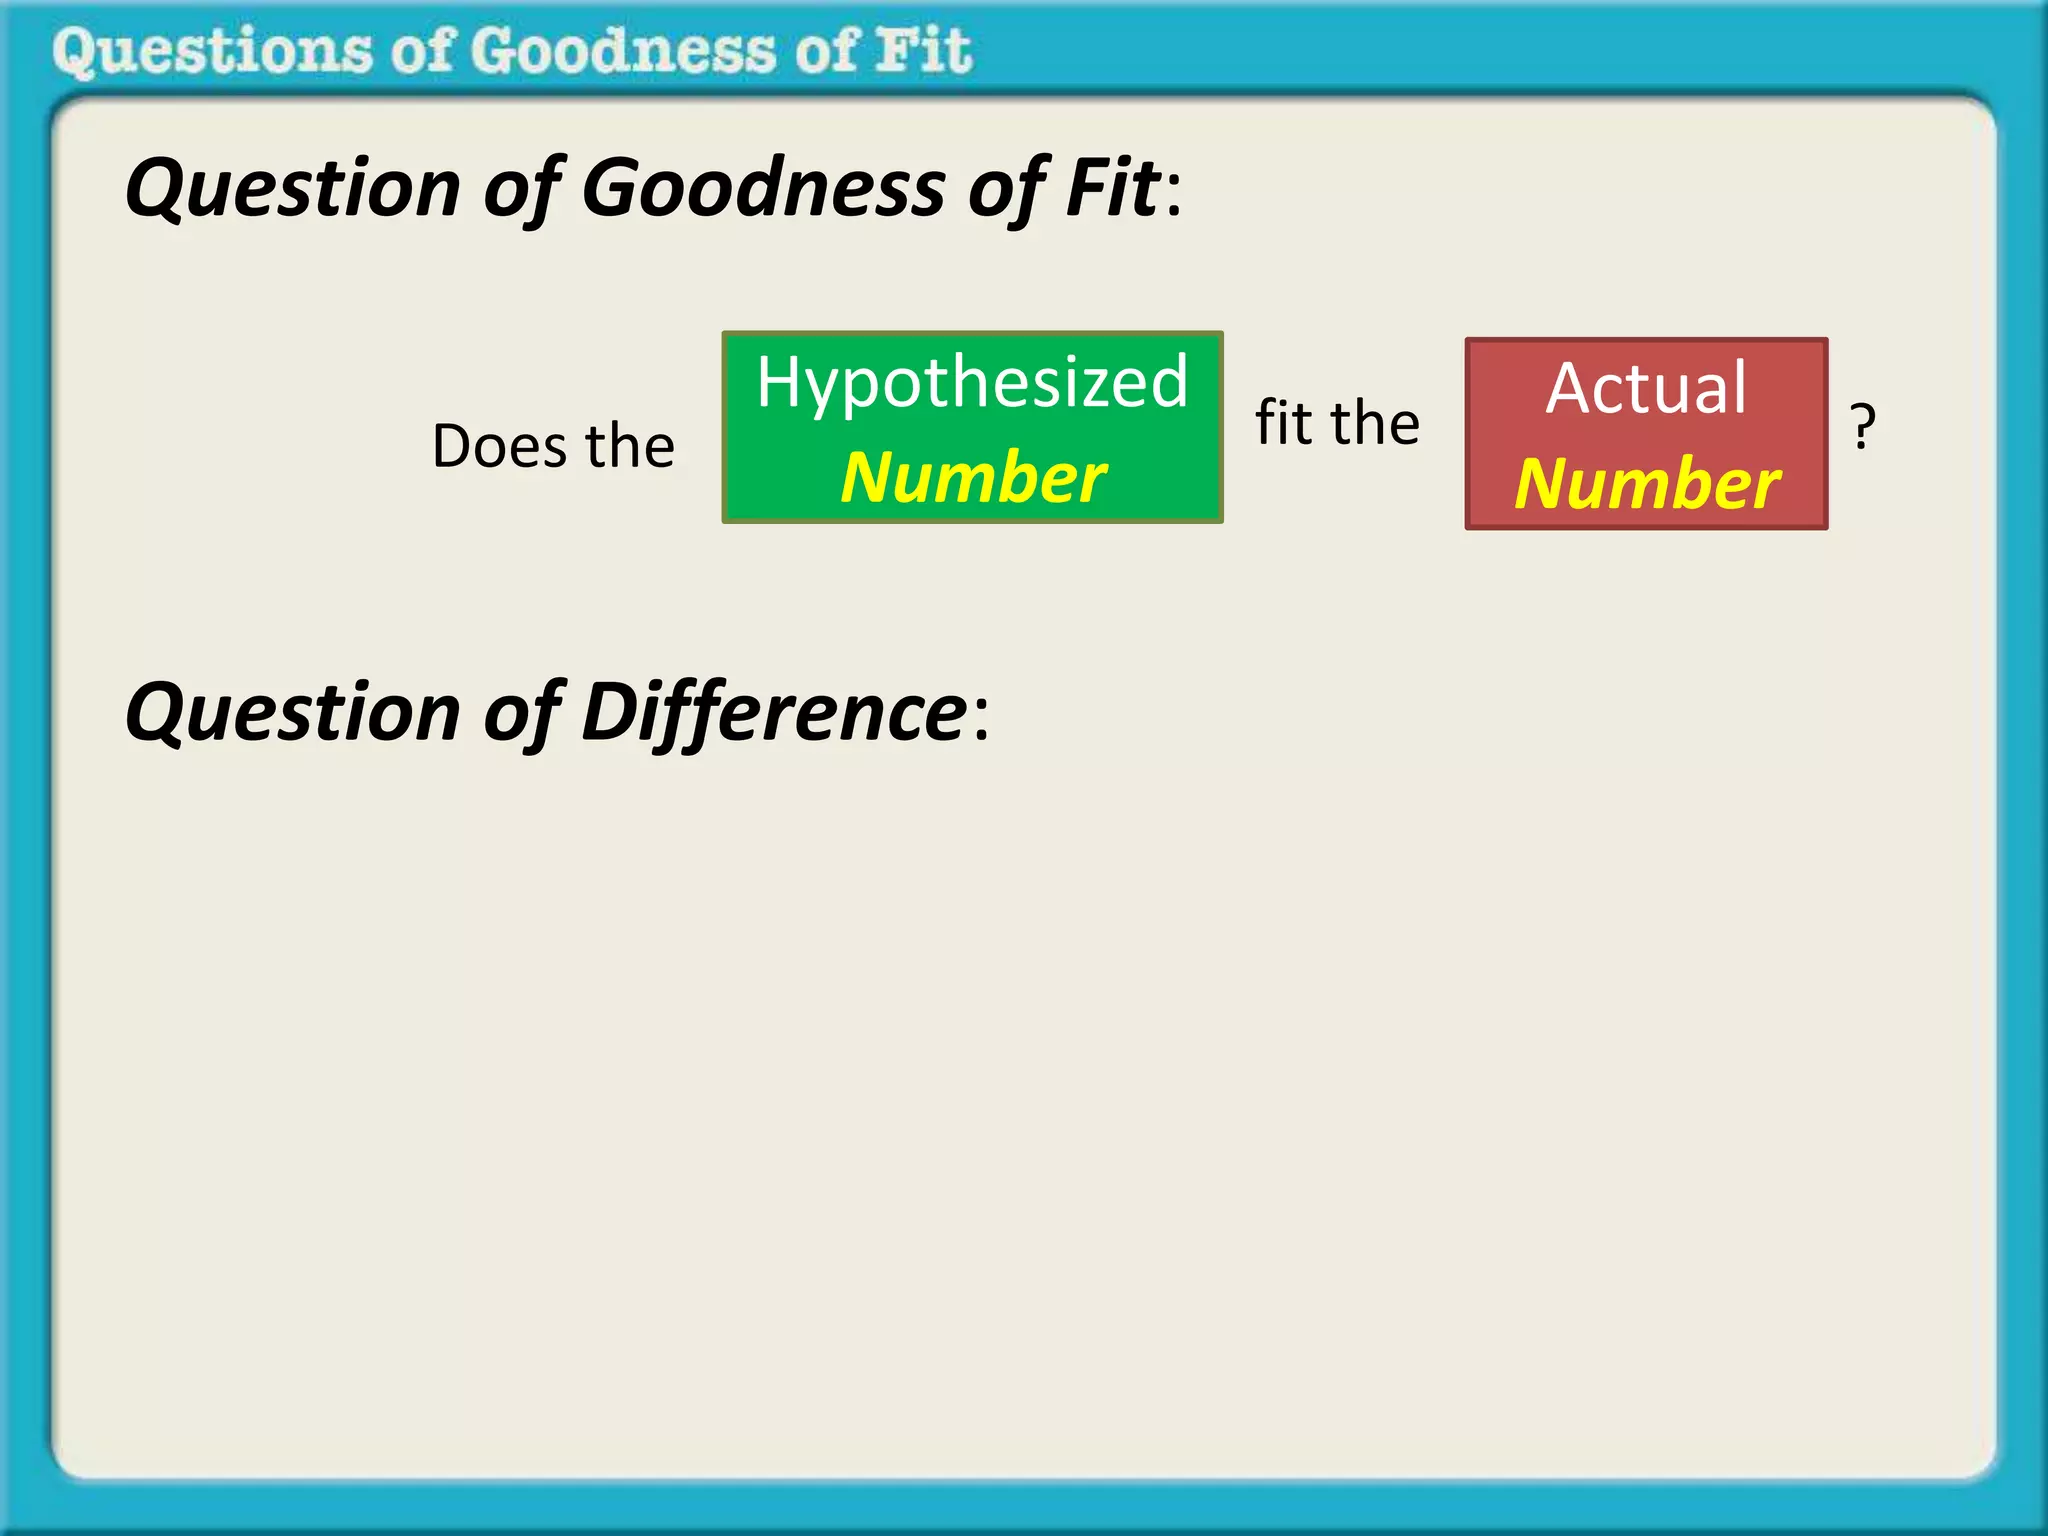
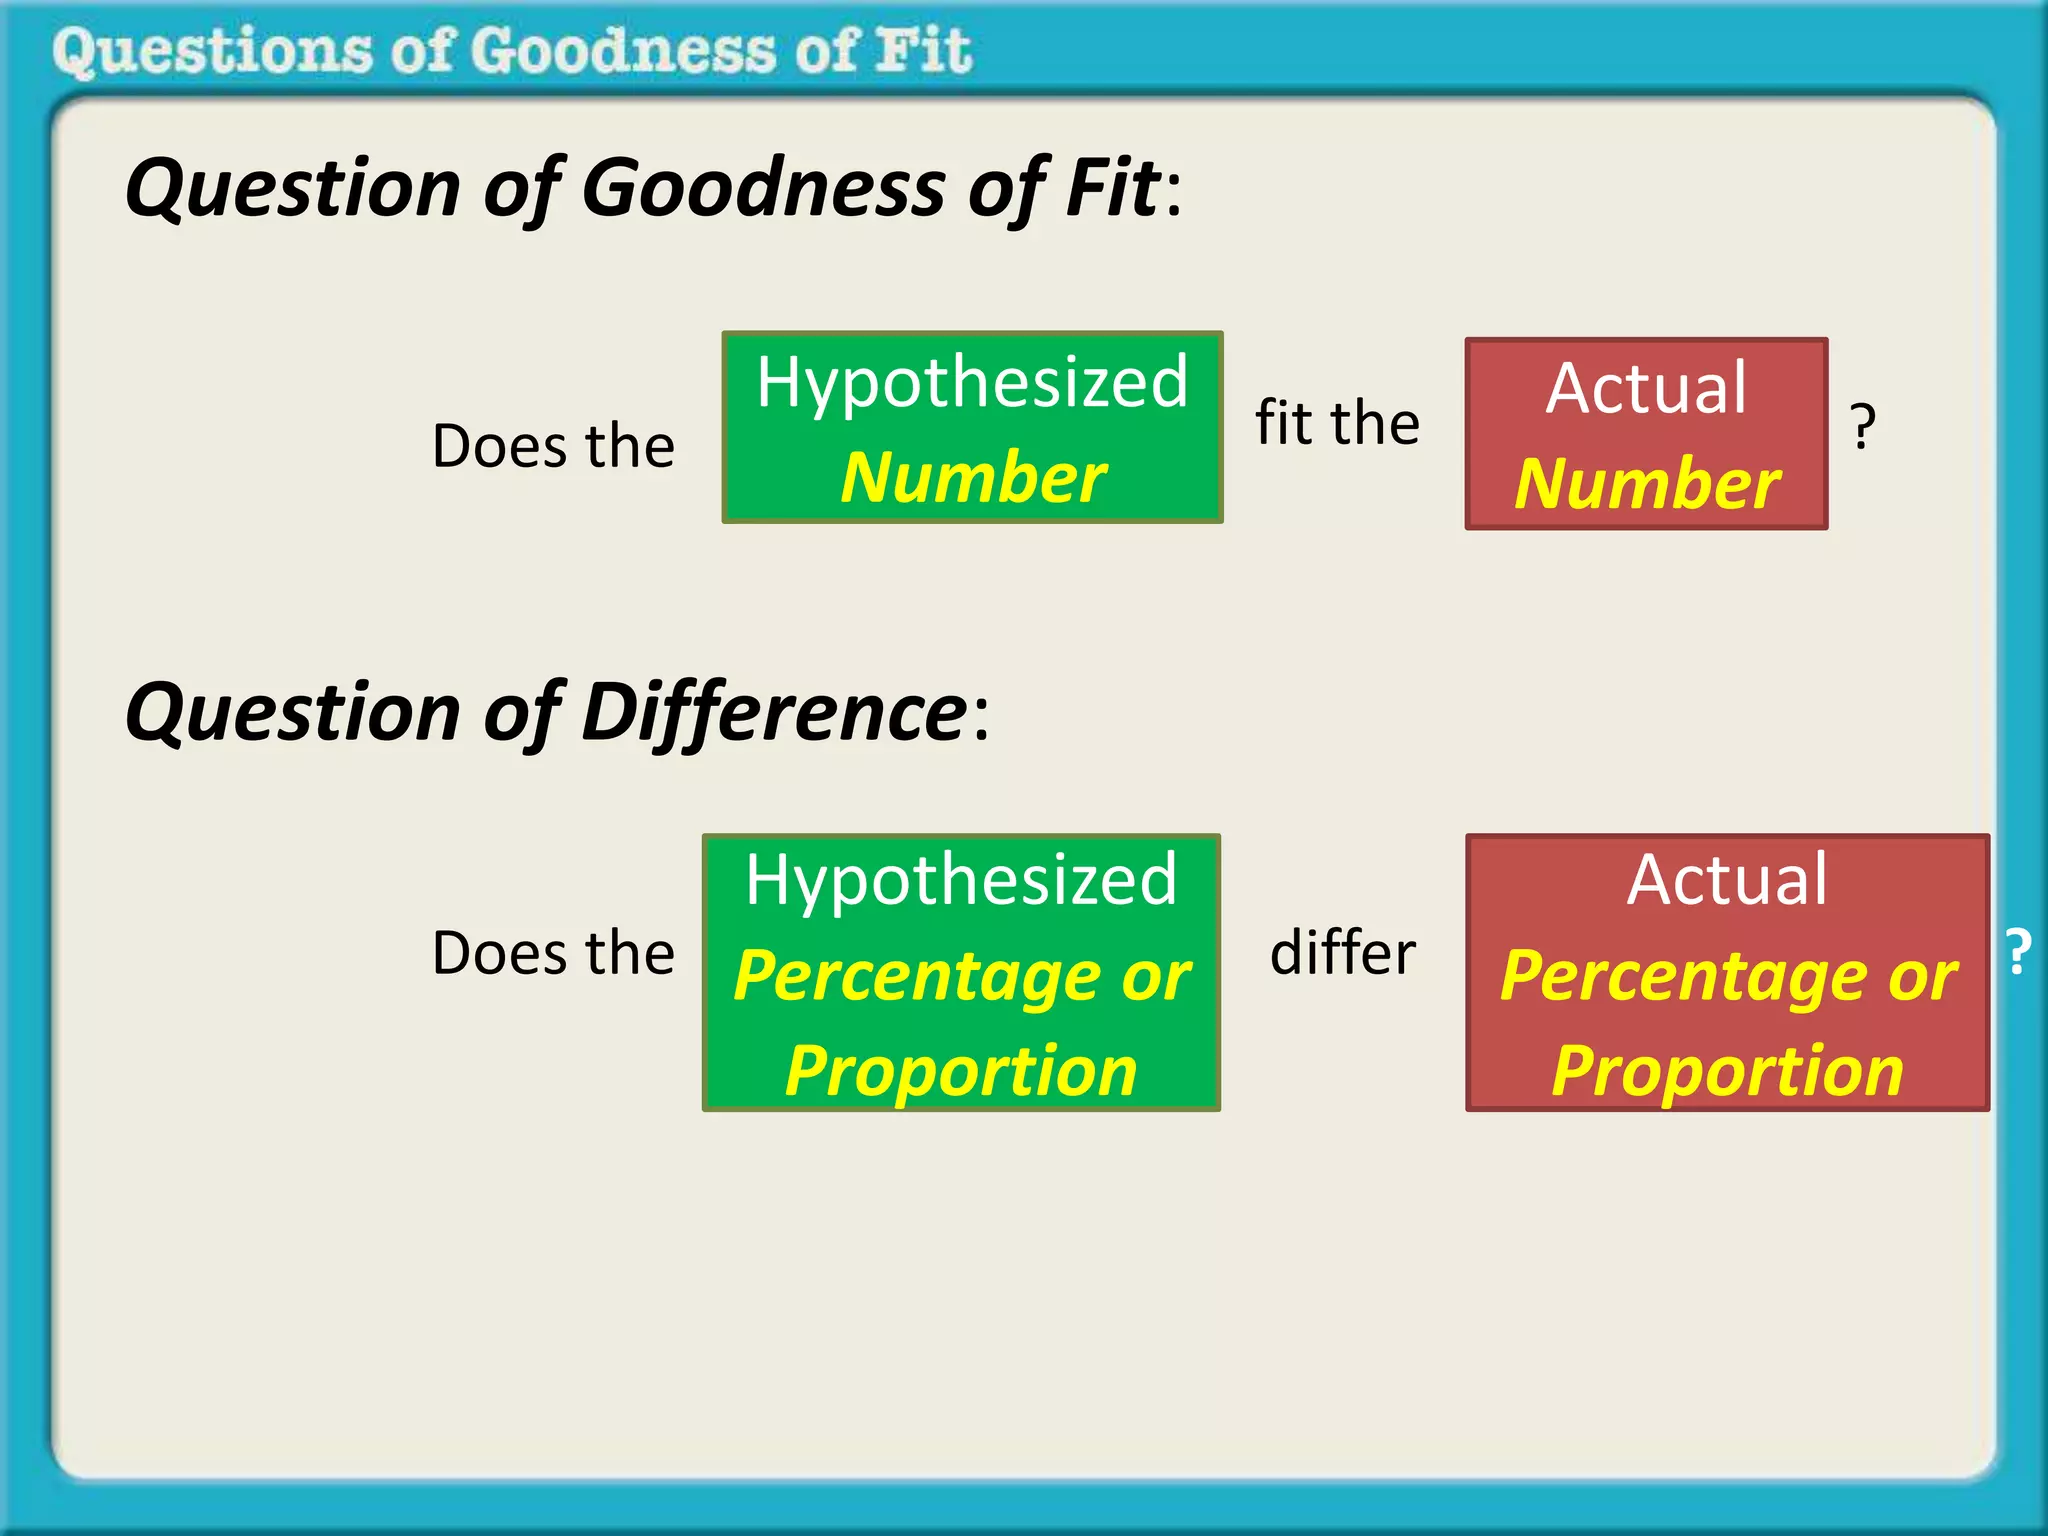
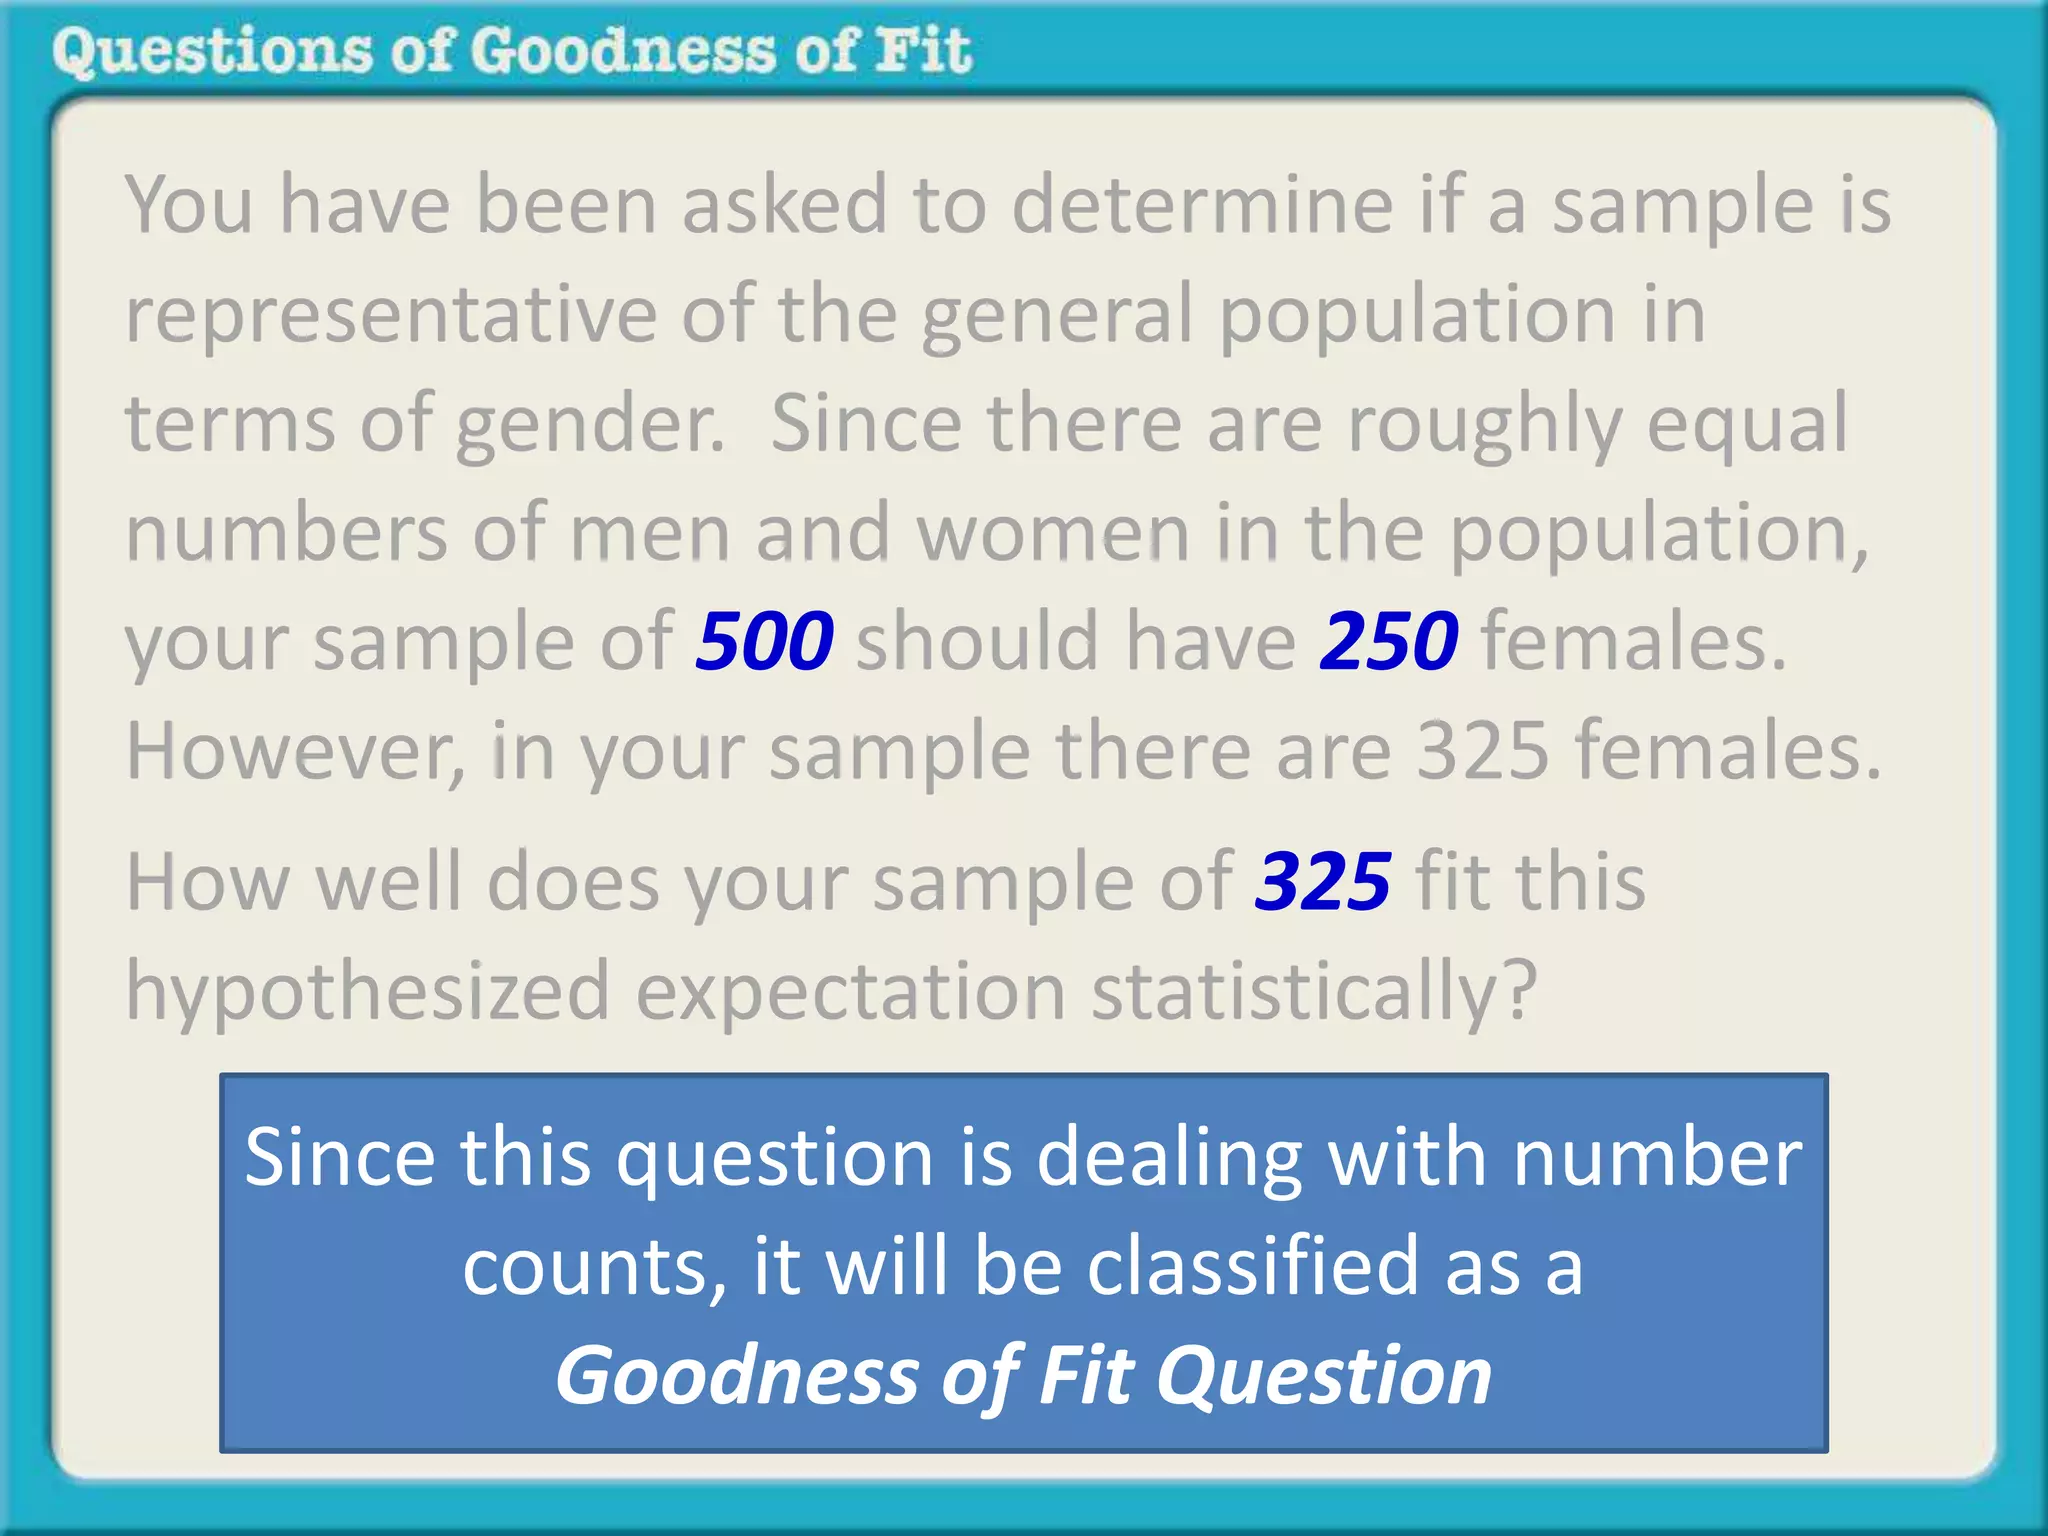
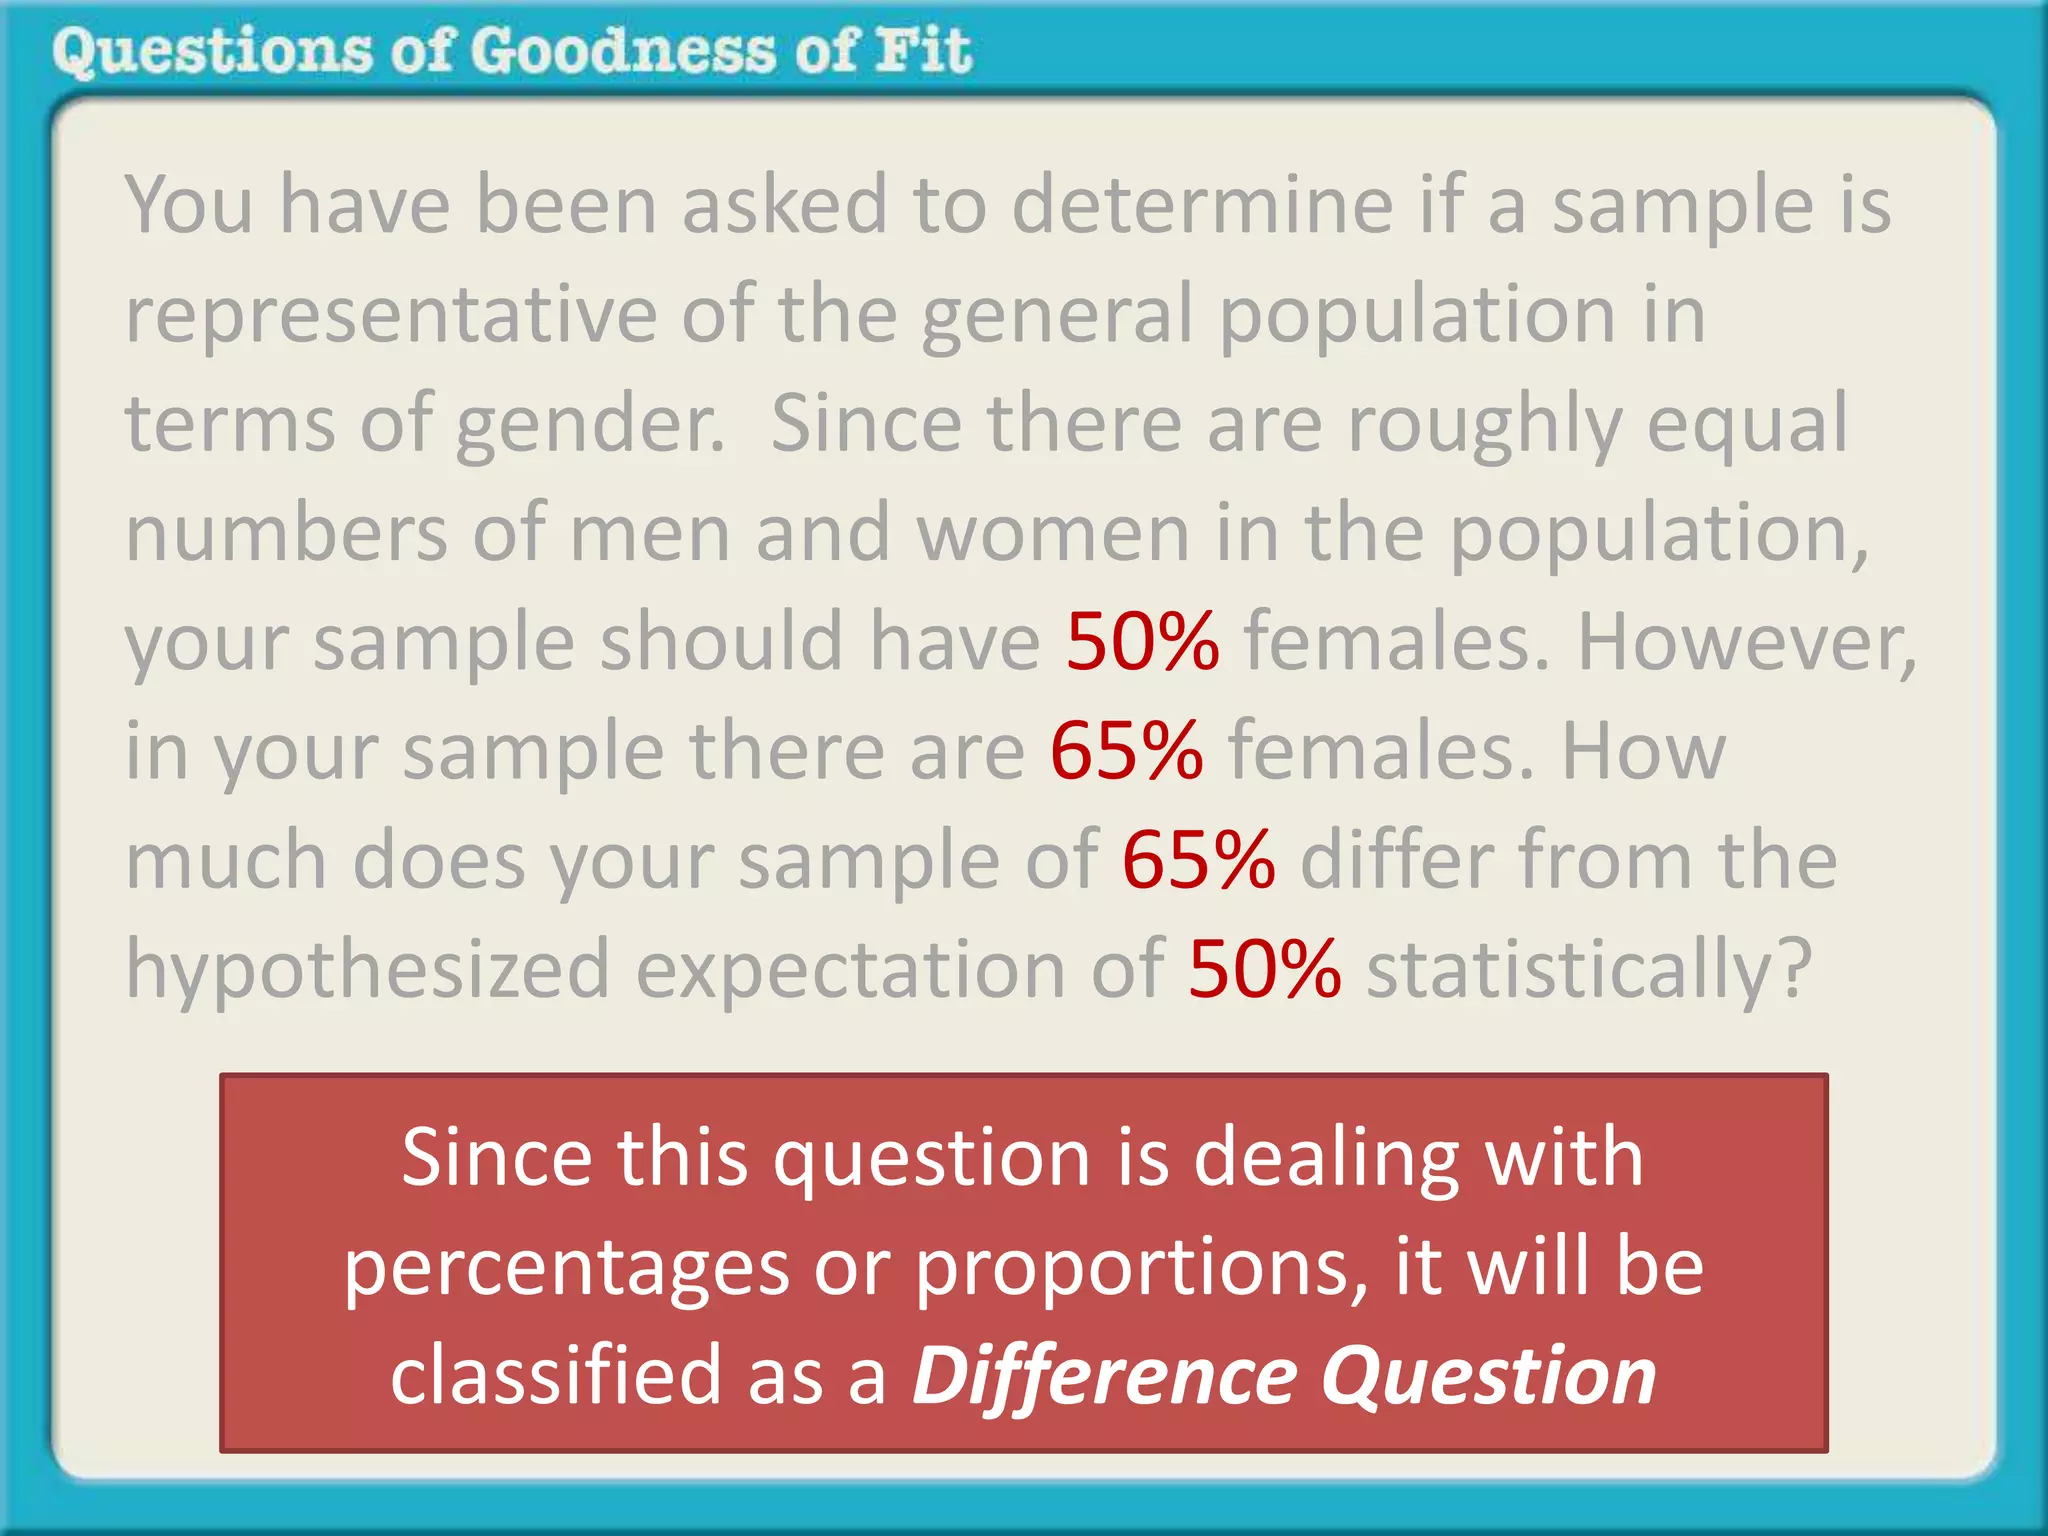
Questions of Goodness of Fit
Is the problem you are working on a question of 
Goodness of Fit?
Is the problem you are working on a question of 
Goodness of Fit?
Questions of Goodness of Fit have become increasingly 
important in modern statistics.
Goodness of fit is a method used to determine how close 
a hypothesized pattern fits an observed pattern.
Goodness of fit is a method used to determine how close 
a hypothesized pattern fits an observed pattern. 
Hypothesized Pattern-the 
way you think 
things are.
Goodness of fit is a method used to determine how close 
a hypothesized pattern fits an observed pattern. 
fits 
Hypothesized Pattern-the 
way you think 
things are.
Goodness of fit is a method used to determine how close 
a hypothesized pattern fits an observed pattern. 
Observed Pattern – 
the way things 
actually are. 
Hypothesized Pattern-the 
way you think 
things are. 
fits
For example, let’s say we hypothesize that there are an 
equal number of females as there are males in the town 
of Solvang, California.
So, in a sample of 200 Solvangans we would hypothesize 
that 100 would be female.
So, in a sample of 200 Solvangans we would hypothesize 
that 100 would be female. 
The hypothesized 
number 
of females in a 
sample of 200 is 
100
So, in a sample of 200 Solvangans we would hypothesize 
that 100 would be female. 
The hypothesized 
number 
of females in a 
sample of 200 is 
100 
That is because we assume 
that an equal number will be 
males and an equal number 
will be females
We then take a sample of 200 and find that there are 
actually 84.
Once again, our hypothesized number of females from a 
sample of 200 is 100.
Once again, our hypothesized number of females from a 
sample of 200 is 100. 
The hypothesized 
number 
of females in a 
sample of 200 is 
100
But, our actual number of females from a sample of 100 
is 84.
Is the difference between 100 and 84 statistically 
significant?
Is the difference between 100 and 84 statistically 
significant? 
Note - Even though we are using 
the word difference here, in this 
case we are referring to how well 
the data FITS the hypothesis.
Is the difference between 100 and 84 statistically 
significant? 
The HYPOTHESIZED 
number 
of females in a 
sample of 200 is 
100
Is the difference between 100 and 84 statistically 
significant? 
The ACTUAL 
number 
of females in a 
sample of 200 is 
84 
The HYPOTHESIZED 
number 
of females in a 
sample of 200 is 
100
Is the difference between 100 and 84 statistically 
significant? 
The ACTUAL 
number 
of females in a 
sample of 200 is 
84 16 
The HYPOTHESIZED 
number 
of females in a 
sample of 200 is 
100
Is the difference between 100 and 84 statistically 
significant? 
The ACTUAL 
number 
of females in a 
sample of 200 is 
84 16 
The HYPOTHESIZED 
number 
of females in a 
sample of 200 is 
100
If it is significantly different, then we may need to collect 
a new sample that is more representative of the 
hypothesized population.
If it is significantly different, then we may need to collect 
a new sample that is more representative of the 
hypothesized population.
Here is an equation that we will use as a guide 
to identify goodness of fit questions.
Here is an equation that we will use as a guide 
to identify goodness of fit questions. 
Hypothesized 
Number 
fit the 
Actual 
Number 
Does the ?
Examples of Goodness of Fit Tests
Example #1
Consider a standard package of milk chocolate M&Ms.
Consider a standard package of milk chocolate M&Ms. 
There are six different colors: red, orange, yellow, 
green, blue and brown.
Consider a standard package of milk chocolate M&Ms. 
There are six different colors: red, orange, yellow, 
green, blue and brown. Suppose that we are curious 
about the distribution of these colors and ask, do all six 
colors occur equally?
Consider a standard package of milk chocolate M&Ms. 
There are six different colors: red, orange, yellow, 
green, blue and brown. Suppose that we are curious 
about the distribution of these colors and ask, do all six 
colors occur equally? You collect 24 M&Ms with 4 reds, 
4 oranges, 3 yellows, 5 greens, 2 blues, & 6 browns.
Consider a standard package of milk chocolate M&Ms. 
There are six different colors: red, orange, yellow, 
green, blue and brown. Suppose that we are curious 
about the distribution of these colors and ask, do all six 
colors occur equally? You collect 24 M&Ms with 4 reds, 
4 oranges, 3 yellows, 5 greens, 2 blues, & 6 browns. 
Are these differences statistically significant?
Consider a standard package of milk chocolate M&Ms. 
There are six different colors: red, orange, yellow, 
green, blue and brown. Suppose that we are curious 
about the distribution of these colors and ask, do all six 
colors occur equally? You collect 24 M&Ms with 4 reds, 
4 oranges, 3 yellows, 5 greens, 2 blues, & 6 browns. 
Are these differences statistically significant? 
Hypothesized 
Number 
fit the 
Actual 
Number 
Does the ?
Consider a standard package of milk chocolate M&Ms. 
There are six different colors: red, orange, yellow, 
green, blue and brown. Suppose that we are curious 
about the distribution of these colors and ask, do all six 
colors occur equally? You collect 24 M&Ms with 4 reds, 
4 oranges, 3 yellows, 5 greens, 2 blues, & 6 browns. 
Are these differences statistically significant? 
fit the 
Actual 
Number 
Does the 
Hypothesized 
Number = 
4 red, 4 orange 
4 yellow, 4 green 
4 blue, 4 brown 
?
Consider a standard package of milk chocolate M&Ms. 
There are six different colors: red, orange, yellow, 
green, blue and brown. Suppose that we are curious 
about the distribution of these colors and ask, do all six 
colors occur equally? You collect 24 M&Ms with 4 reds, 
4 oranges, 3 yellows, 5 greens, 2 blues, & 6 browns. 
Are these differences statistically significant? 
Hypothesized 
Number = 
4 red, 4 orange 
4 yellow, 4 green 
4 blue, 4 brown 
Does the fit the 
Actual 
Number = 
4 red, 4 orange 
3 yellow, 5 green 
2 blue, 6 brown 
?
Example #2
Absenteeism of college students from math classes is a major 
concern to math instructors because missing class appears to 
increase the drop rate.
Absenteeism of college students from math classes is a major 
concern to math instructors because missing class appears to 
increase the drop rate. Suppose that a study was done to 
determine if the actual student absenteeism follows faculty 
perception.
Absenteeism of college students from math classes is a major 
concern to math instructors because missing class appears to 
increase the drop rate. Suppose that a study was done to 
determine if the actual student absenteeism follows faculty 
perception. The faculty expected that a group of 100 students 
would miss class according to the following chart.
Absenteeism of college students from math classes is a major 
concern to math instructors because missing class appears to 
increase the drop rate. Suppose that a study was done to 
determine if the actual student absenteeism follows faculty 
perception. The faculty expected that a group of 100 students 
would miss class according to the following chart. 
# of absences EXPECTED # of Students 
0-2 50 
3-5 30 
6-8 12 
9-11 6 
12+ 2
Absenteeism of college students from math classes is a major 
concern to math instructors because missing class appears to 
increase the drop rate. Suppose that a study was done to 
determine if the actual student absenteeism follows faculty 
perception. The faculty expected that a group of 100 students 
would miss class according to the following chart. Here were 
actual results of a random sample. 
# of absences EXPECTED # of Students 
0-2 50 
3-5 30 
6-8 12 
9-11 6 
12+ 2 
# of absences ACTUAL # of Students 
0-2 35 
3-5 40 
6-8 20 
9-11 1 
12+ 4
Absenteeism of college students from math classes is a major 
concern to math instructors because missing class appears to 
increase the drop rate. Suppose that a study was done to 
determine if the actual student absenteeism follows faculty 
perception. The faculty expected that a group of 100 students 
would miss class according to the following chart. Here were 
actual results of a random sample. Did the faculty perception fit 
the reality? 
Hypothesized 
Number 
fit the 
Actual 
Number 
Does the ?
Absenteeism of college students from math classes is a major 
concern to math instructors because missing class appears to 
increase the drop rate. Suppose that a study was done to 
determine if the actual student absenteeism follows faculty 
perception. The faculty expected that a group of 100 students 
would miss class according to the following chart. Here were 
actual results of a random sample. Did the faculty perception fit 
the reality? 
Faculty 
Perceptions 
of Student 
Absenteeism 
fit the 
Actual 
Number 
Does the ?
Absenteeism of college students from math classes is a major 
concern to math instructors because missing class appears to 
increase the drop rate. Suppose that a study was done to 
determine if the actual student absenteeism follows faculty 
perception. The faculty expected that a group of 100 students 
would miss class according to the following chart. Here were 
actual results of a random sample. Did the faculty perception fit 
the reality? 
Actual 
Student 
Absenteeism 
Faculty 
Perceptions 
of Student 
Absenteeism 
Does the fit the ?
An exception to the rule
An exception to the rule 
As was just shown, if you are comparing an 
observed count with a hypothesized count, 
then you will use goodness of fit statistical 
methods.
An exception to the rule 
As was just shown, if you are comparing an 
observed count with a hypothesized count, 
then you will use goodness of fit statistical 
methods. 
Hypothesized 
Count = 100 
Actual 
Count = 84
An exception to the rule 
As was just shown, if you are comparing an 
observed count with a hypothesized count, 
then you will use goodness of fit statistical 
methods. 
Hypothesized 
Count = 100 
Actual 
Count = 84
An exception to the rule 
However,
An exception to the rule 
However, if you are comparing a hypothesized 
proportion (5 out of 10) or percentage (50%)
An exception to the rule 
However, if you are comparing a hypothesized 
proportion (5 out of 10) or percentage (50%) 
with an actual proportion or percentage, then 
you will use a “Difference” method.
An exception to the rule 
However, if you are comparing a hypothesized 
proportion (5 out of 10) or percentage (50%) 
with an actual proportion or percentage, then 
you will use a “Difference” method. 
Hypothesized 
Percentage = 
50% 
Actual 
Percentage = 
42%
An exception to the rule 
However, if you are comparing a hypothesized 
proportion (5 out of 10) or percentage (50%) 
with an actual proportion or percentage, then 
you will use a “Difference” method. 
Hypothesized 
Percentage = 
50% 
Actual 
Percentage = 
42%
Here are the two classifications with their 
equations:
Question of Goodness of Fit:
Question of Goodness of Fit: 
Hypothesized 
Number 
Actual 
Number 
Does the fit the ?
Question of Goodness of Fit: 
Hypothesized 
Number 
Question of Difference: 
Actual 
Number 
Does the fit the ?
Question of Goodness of Fit: 
Hypothesized 
Does the fit the ? 
Number 
Question of Difference: 
Actual 
Number 
Hypothesized 
Percentage or 
Proportion 
differ 
Actual 
Percentage or 
Proportion 
Does the 
?
Let’s see an example:
You have been asked to determine if a sample is 
representative of the general population in 
terms of gender.
You have been asked to determine if a sample is 
representative of the general population in 
terms of gender. Since there are roughly equal 
numbers of men and women in the population, 
your sample of 500 should have 250 females.
You have been asked to determine if a sample is 
representative of the general population in 
terms of gender. Since there are roughly equal 
numbers of men and women in the population, 
your sample of 500 should have 250 females. 
However, in your sample there are 325 females.
You have been asked to determine if a sample is 
representative of the general population in 
terms of gender. Since there are roughly equal 
numbers of men and women in the population, 
your sample of 500 should have 250 females. 
However, in your sample there are 325 females. 
How well does your sample of 325 fit this 
hypothesized expectation statistically?
You have been asked to determine if a sample is 
representative of the general population in 
terms of gender. Since there are roughly equal 
numbers of men and women in the population, 
your sample of 500 should have 250 females. 
However, in your sample there are 325 females. 
How well does your sample of 325 fit this 
hypothesized expectation statistically? 
Since this question is dealing with number 
counts, it will be classified as a 
Goodness of Fit Question
Now let’s see the same question but as a 
“difference” question.
You have been asked to determine if a sample is 
representative of the general population in 
terms of gender.
You have been asked to determine if a sample is 
representative of the general population in 
terms of gender. Since there are roughly equal 
numbers of men and women in the population, 
your sample should have 50% females.
You have been asked to determine if a sample is 
representative of the general population in 
terms of gender. Since there are roughly equal 
numbers of men and women in the population, 
your sample should have 50% females. However, 
in your sample there are 65% females.
You have been asked to determine if a sample is 
representative of the general population in 
terms of gender. Since there are roughly equal 
numbers of men and women in the population, 
your sample should have 50% females. However, 
in your sample there are 65% females. How 
much does your sample of 65% differ from the 
hypothesized expectation of 50% statistically?
You have been asked to determine if a sample is 
representative of the general population in 
terms of gender. Since there are roughly equal 
numbers of men and women in the population, 
your sample should have 50% females. However, 
in your sample there are 65% females. How 
much does your sample of 65% differ from the 
hypothesized expectation of 50% statistically? 
Since this question is dealing with 
percentages or proportions, it will be 
classified as a Difference Question
Examine the question or problem you are 
working on.
Is it a question of goodness of fit?
If so, select GOODNESS OF FIT

Questions of goodness of fit

  • 1.
  • 2.
    Is the problemyou are working on a question of Goodness of Fit?
  • 3.
    Is the problemyou are working on a question of Goodness of Fit?
  • 4.
    Questions of Goodnessof Fit have become increasingly important in modern statistics.
  • 5.
    Goodness of fitis a method used to determine how close a hypothesized pattern fits an observed pattern.
  • 6.
    Goodness of fitis a method used to determine how close a hypothesized pattern fits an observed pattern. Hypothesized Pattern-the way you think things are.
  • 7.
    Goodness of fitis a method used to determine how close a hypothesized pattern fits an observed pattern. fits Hypothesized Pattern-the way you think things are.
  • 8.
    Goodness of fitis a method used to determine how close a hypothesized pattern fits an observed pattern. Observed Pattern – the way things actually are. Hypothesized Pattern-the way you think things are. fits
  • 9.
    For example, let’ssay we hypothesize that there are an equal number of females as there are males in the town of Solvang, California.
  • 10.
    So, in asample of 200 Solvangans we would hypothesize that 100 would be female.
  • 11.
    So, in asample of 200 Solvangans we would hypothesize that 100 would be female. The hypothesized number of females in a sample of 200 is 100
  • 12.
    So, in asample of 200 Solvangans we would hypothesize that 100 would be female. The hypothesized number of females in a sample of 200 is 100 That is because we assume that an equal number will be males and an equal number will be females
  • 13.
    We then takea sample of 200 and find that there are actually 84.
  • 14.
    Once again, ourhypothesized number of females from a sample of 200 is 100.
  • 15.
    Once again, ourhypothesized number of females from a sample of 200 is 100. The hypothesized number of females in a sample of 200 is 100
  • 16.
    But, our actualnumber of females from a sample of 100 is 84.
  • 17.
    Is the differencebetween 100 and 84 statistically significant?
  • 18.
    Is the differencebetween 100 and 84 statistically significant? Note - Even though we are using the word difference here, in this case we are referring to how well the data FITS the hypothesis.
  • 19.
    Is the differencebetween 100 and 84 statistically significant? The HYPOTHESIZED number of females in a sample of 200 is 100
  • 20.
    Is the differencebetween 100 and 84 statistically significant? The ACTUAL number of females in a sample of 200 is 84 The HYPOTHESIZED number of females in a sample of 200 is 100
  • 21.
    Is the differencebetween 100 and 84 statistically significant? The ACTUAL number of females in a sample of 200 is 84 16 The HYPOTHESIZED number of females in a sample of 200 is 100
  • 22.
    Is the differencebetween 100 and 84 statistically significant? The ACTUAL number of females in a sample of 200 is 84 16 The HYPOTHESIZED number of females in a sample of 200 is 100
  • 23.
    If it issignificantly different, then we may need to collect a new sample that is more representative of the hypothesized population.
  • 24.
    If it issignificantly different, then we may need to collect a new sample that is more representative of the hypothesized population.
  • 25.
    Here is anequation that we will use as a guide to identify goodness of fit questions.
  • 26.
    Here is anequation that we will use as a guide to identify goodness of fit questions. Hypothesized Number fit the Actual Number Does the ?
  • 27.
  • 28.
  • 29.
    Consider a standardpackage of milk chocolate M&Ms.
  • 30.
    Consider a standardpackage of milk chocolate M&Ms. There are six different colors: red, orange, yellow, green, blue and brown.
  • 31.
    Consider a standardpackage of milk chocolate M&Ms. There are six different colors: red, orange, yellow, green, blue and brown. Suppose that we are curious about the distribution of these colors and ask, do all six colors occur equally?
  • 32.
    Consider a standardpackage of milk chocolate M&Ms. There are six different colors: red, orange, yellow, green, blue and brown. Suppose that we are curious about the distribution of these colors and ask, do all six colors occur equally? You collect 24 M&Ms with 4 reds, 4 oranges, 3 yellows, 5 greens, 2 blues, & 6 browns.
  • 33.
    Consider a standardpackage of milk chocolate M&Ms. There are six different colors: red, orange, yellow, green, blue and brown. Suppose that we are curious about the distribution of these colors and ask, do all six colors occur equally? You collect 24 M&Ms with 4 reds, 4 oranges, 3 yellows, 5 greens, 2 blues, & 6 browns. Are these differences statistically significant?
  • 34.
    Consider a standardpackage of milk chocolate M&Ms. There are six different colors: red, orange, yellow, green, blue and brown. Suppose that we are curious about the distribution of these colors and ask, do all six colors occur equally? You collect 24 M&Ms with 4 reds, 4 oranges, 3 yellows, 5 greens, 2 blues, & 6 browns. Are these differences statistically significant? Hypothesized Number fit the Actual Number Does the ?
  • 35.
    Consider a standardpackage of milk chocolate M&Ms. There are six different colors: red, orange, yellow, green, blue and brown. Suppose that we are curious about the distribution of these colors and ask, do all six colors occur equally? You collect 24 M&Ms with 4 reds, 4 oranges, 3 yellows, 5 greens, 2 blues, & 6 browns. Are these differences statistically significant? Hypothesized Number fit the Actual Number Does the ?
  • 36.
    Consider a standardpackage of milk chocolate M&Ms. There are six different colors: red, orange, yellow, green, blue and brown. Suppose that we are curious about the distribution of these colors and ask, do all six colors occur equally? You collect 24 M&Ms with 4 reds, 4 oranges, 3 yellows, 5 greens, 2 blues, & 6 browns. Are these differences statistically significant? fit the Actual Number Does the Hypothesized Number = 4 red, 4 orange 4 yellow, 4 green 4 blue, 4 brown ?
  • 37.
    Consider a standardpackage of milk chocolate M&Ms. There are six different colors: red, orange, yellow, green, blue and brown. Suppose that we are curious about the distribution of these colors and ask, do all six colors occur equally? You collect 24 M&Ms with 4 reds, 4 oranges, 3 yellows, 5 greens, 2 blues, & 6 browns. Are these differences statistically significant? fit the Actual Number Does the Hypothesized Number = 4 red, 4 orange 4 yellow, 4 green 4 blue, 4 brown ?
  • 38.
    Consider a standardpackage of milk chocolate M&Ms. There are six different colors: red, orange, yellow, green, blue and brown. Suppose that we are curious about the distribution of these colors and ask, do all six colors occur equally? You collect 24 M&Ms with 4 reds, 4 oranges, 3 yellows, 5 greens, 2 blues, & 6 browns. Are these differences statistically significant? Hypothesized Number = 4 red, 4 orange 4 yellow, 4 green 4 blue, 4 brown Does the fit the Actual Number = 4 red, 4 orange 3 yellow, 5 green 2 blue, 6 brown ?
  • 39.
  • 40.
    Absenteeism of collegestudents from math classes is a major concern to math instructors because missing class appears to increase the drop rate.
  • 41.
    Absenteeism of collegestudents from math classes is a major concern to math instructors because missing class appears to increase the drop rate. Suppose that a study was done to determine if the actual student absenteeism follows faculty perception.
  • 42.
    Absenteeism of collegestudents from math classes is a major concern to math instructors because missing class appears to increase the drop rate. Suppose that a study was done to determine if the actual student absenteeism follows faculty perception. The faculty expected that a group of 100 students would miss class according to the following chart.
  • 43.
    Absenteeism of collegestudents from math classes is a major concern to math instructors because missing class appears to increase the drop rate. Suppose that a study was done to determine if the actual student absenteeism follows faculty perception. The faculty expected that a group of 100 students would miss class according to the following chart. # of absences EXPECTED # of Students 0-2 50 3-5 30 6-8 12 9-11 6 12+ 2
  • 44.
    Absenteeism of collegestudents from math classes is a major concern to math instructors because missing class appears to increase the drop rate. Suppose that a study was done to determine if the actual student absenteeism follows faculty perception. The faculty expected that a group of 100 students would miss class according to the following chart. Here were actual results of a random sample. # of absences EXPECTED # of Students 0-2 50 3-5 30 6-8 12 9-11 6 12+ 2
  • 45.
    Absenteeism of collegestudents from math classes is a major concern to math instructors because missing class appears to increase the drop rate. Suppose that a study was done to determine if the actual student absenteeism follows faculty perception. The faculty expected that a group of 100 students would miss class according to the following chart. Here were actual results of a random sample. # of absences EXPECTED # of Students 0-2 50 3-5 30 6-8 12 9-11 6 12+ 2 # of absences ACTUAL # of Students 0-2 35 3-5 40 6-8 20 9-11 1 12+ 4
  • 46.
    Absenteeism of collegestudents from math classes is a major concern to math instructors because missing class appears to increase the drop rate. Suppose that a study was done to determine if the actual student absenteeism follows faculty perception. The faculty expected that a group of 100 students would miss class according to the following chart. Here were actual results of a random sample. Did the faculty perception fit the reality? Hypothesized Number fit the Actual Number Does the ?
  • 47.
    Absenteeism of collegestudents from math classes is a major concern to math instructors because missing class appears to increase the drop rate. Suppose that a study was done to determine if the actual student absenteeism follows faculty perception. The faculty expected that a group of 100 students would miss class according to the following chart. Here were actual results of a random sample. Did the faculty perception fit the reality? Hypothesized Number fit the Actual Number Does the ?
  • 48.
    Absenteeism of collegestudents from math classes is a major concern to math instructors because missing class appears to increase the drop rate. Suppose that a study was done to determine if the actual student absenteeism follows faculty perception. The faculty expected that a group of 100 students would miss class according to the following chart. Here were actual results of a random sample. Did the faculty perception fit the reality? Faculty Perceptions of Student Absenteeism fit the Actual Number Does the ?
  • 49.
    Absenteeism of collegestudents from math classes is a major concern to math instructors because missing class appears to increase the drop rate. Suppose that a study was done to determine if the actual student absenteeism follows faculty perception. The faculty expected that a group of 100 students would miss class according to the following chart. Here were actual results of a random sample. Did the faculty perception fit the reality? Faculty Perceptions of Student Absenteeism fit the Actual Number Does the ?
  • 50.
    Absenteeism of collegestudents from math classes is a major concern to math instructors because missing class appears to increase the drop rate. Suppose that a study was done to determine if the actual student absenteeism follows faculty perception. The faculty expected that a group of 100 students would miss class according to the following chart. Here were actual results of a random sample. Did the faculty perception fit the reality? Actual Student Absenteeism Faculty Perceptions of Student Absenteeism Does the fit the ?
  • 51.
  • 52.
    An exception tothe rule As was just shown, if you are comparing an observed count with a hypothesized count, then you will use goodness of fit statistical methods.
  • 53.
    An exception tothe rule As was just shown, if you are comparing an observed count with a hypothesized count, then you will use goodness of fit statistical methods. Hypothesized Count = 100 Actual Count = 84
  • 54.
    An exception tothe rule As was just shown, if you are comparing an observed count with a hypothesized count, then you will use goodness of fit statistical methods. Hypothesized Count = 100 Actual Count = 84
  • 55.
    An exception tothe rule However,
  • 56.
    An exception tothe rule However, if you are comparing a hypothesized proportion (5 out of 10) or percentage (50%)
  • 57.
    An exception tothe rule However, if you are comparing a hypothesized proportion (5 out of 10) or percentage (50%) with an actual proportion or percentage, then you will use a “Difference” method.
  • 58.
    An exception tothe rule However, if you are comparing a hypothesized proportion (5 out of 10) or percentage (50%) with an actual proportion or percentage, then you will use a “Difference” method. Hypothesized Percentage = 50% Actual Percentage = 42%
  • 59.
    An exception tothe rule However, if you are comparing a hypothesized proportion (5 out of 10) or percentage (50%) with an actual proportion or percentage, then you will use a “Difference” method. Hypothesized Percentage = 50% Actual Percentage = 42%
  • 60.
    Here are thetwo classifications with their equations:
  • 61.
  • 62.
    Question of Goodnessof Fit: Hypothesized Number Actual Number Does the fit the ?
  • 63.
    Question of Goodnessof Fit: Hypothesized Number Question of Difference: Actual Number Does the fit the ?
  • 64.
    Question of Goodnessof Fit: Hypothesized Does the fit the ? Number Question of Difference: Actual Number Hypothesized Percentage or Proportion differ Actual Percentage or Proportion Does the ?
  • 65.
  • 66.
    You have beenasked to determine if a sample is representative of the general population in terms of gender.
  • 67.
    You have beenasked to determine if a sample is representative of the general population in terms of gender. Since there are roughly equal numbers of men and women in the population, your sample of 500 should have 250 females.
  • 68.
    You have beenasked to determine if a sample is representative of the general population in terms of gender. Since there are roughly equal numbers of men and women in the population, your sample of 500 should have 250 females. However, in your sample there are 325 females.
  • 69.
    You have beenasked to determine if a sample is representative of the general population in terms of gender. Since there are roughly equal numbers of men and women in the population, your sample of 500 should have 250 females. However, in your sample there are 325 females. How well does your sample of 325 fit this hypothesized expectation statistically?
  • 70.
    You have beenasked to determine if a sample is representative of the general population in terms of gender. Since there are roughly equal numbers of men and women in the population, your sample of 500 should have 250 females. However, in your sample there are 325 females. How well does your sample of 325 fit this hypothesized expectation statistically? Since this question is dealing with number counts, it will be classified as a Goodness of Fit Question
  • 71.
    Now let’s seethe same question but as a “difference” question.
  • 72.
    You have beenasked to determine if a sample is representative of the general population in terms of gender.
  • 73.
    You have beenasked to determine if a sample is representative of the general population in terms of gender. Since there are roughly equal numbers of men and women in the population, your sample should have 50% females.
  • 74.
    You have beenasked to determine if a sample is representative of the general population in terms of gender. Since there are roughly equal numbers of men and women in the population, your sample should have 50% females. However, in your sample there are 65% females.
  • 75.
    You have beenasked to determine if a sample is representative of the general population in terms of gender. Since there are roughly equal numbers of men and women in the population, your sample should have 50% females. However, in your sample there are 65% females. How much does your sample of 65% differ from the hypothesized expectation of 50% statistically?
  • 76.
    You have beenasked to determine if a sample is representative of the general population in terms of gender. Since there are roughly equal numbers of men and women in the population, your sample should have 50% females. However, in your sample there are 65% females. How much does your sample of 65% differ from the hypothesized expectation of 50% statistically? Since this question is dealing with percentages or proportions, it will be classified as a Difference Question
  • 77.
    Examine the questionor problem you are working on.
  • 78.
    Is it aquestion of goodness of fit?
  • 79.
    If so, selectGOODNESS OF FIT