Download to read offline
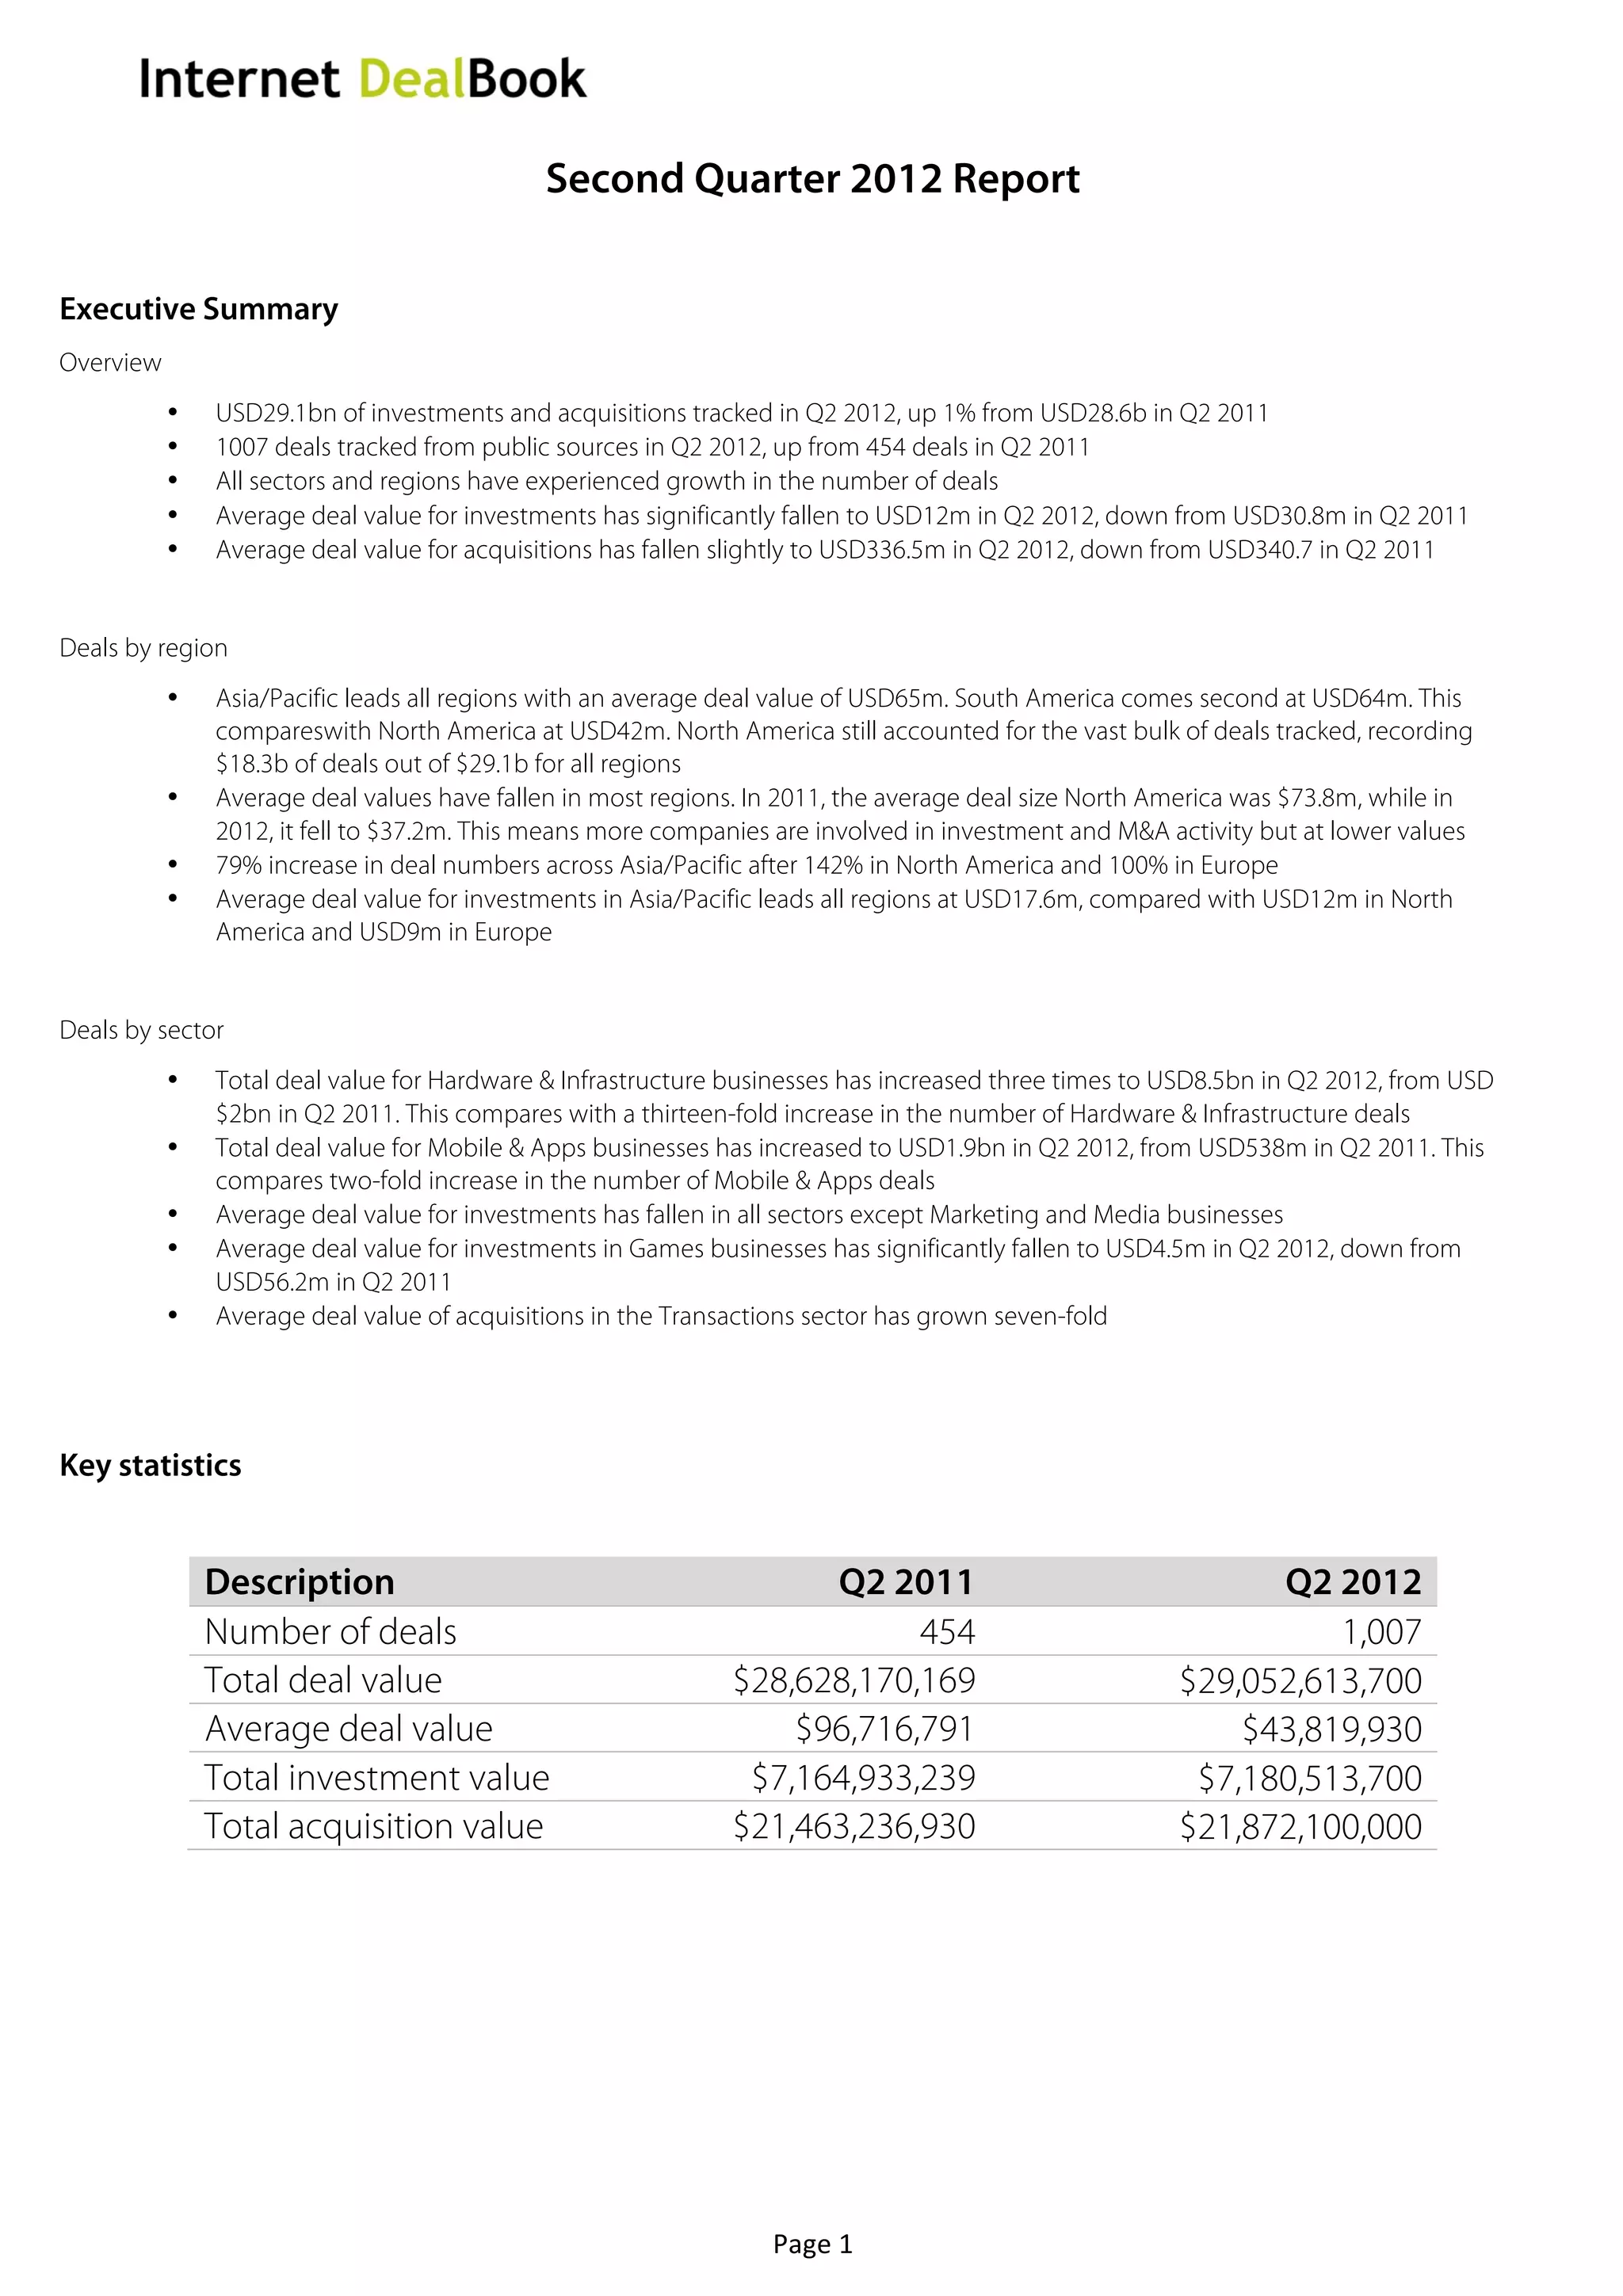
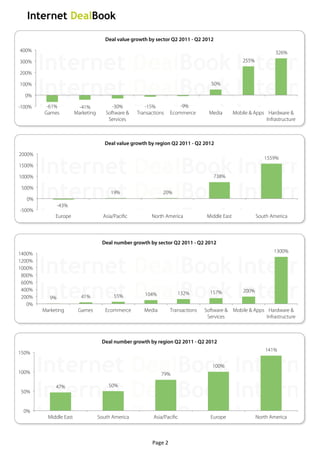
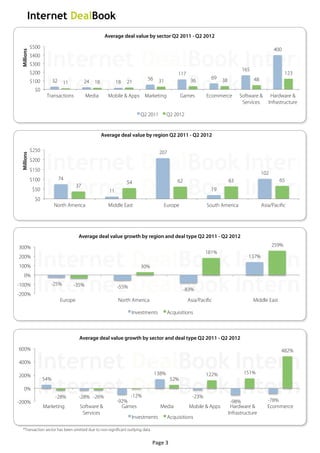

The document summarizes key investment and M&A trends for the second quarter of 2012. It found that while the total deal value and number of deals increased from Q2 2011, the average deal value decreased significantly. The number of deals increased across all regions and sectors. Asia/Pacific and South America had the highest average deal values, while average deal values decreased the most in Europe and North America. Hardware/infrastructure saw the largest increase in total deal value.


