
Recommended
Recommended
More Related Content
Viewers also liked
Viewers also liked (18)
Similar to Venture-Backed M&A Activity Remained Stable in Q3 2004 With Software Deals Leading
Similar to Venture-Backed M&A Activity Remained Stable in Q3 2004 With Software Deals Leading (20)
More from mensa25
More from mensa25 (20)
Recently uploaded
Recently uploaded (20)
Venture-Backed M&A Activity Remained Stable in Q3 2004 With Software Deals Leading
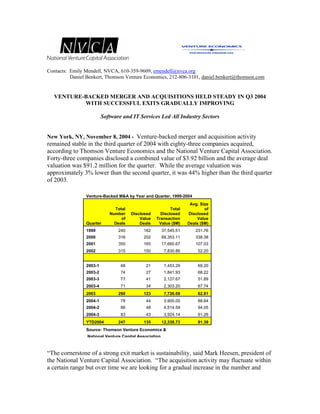
- 1. Contacts: Emily Mendell, NVCA, 610-359-9609, emendell@nvca.org Daniel Benkert, Thomson Venture Economics, 212-806-3101, daniel.benkert@thomson.com VENTURE-BACKED MERGER AND ACQUISITIONS HELD STEADY IN Q3 2004 WITH SUCCESSFUL EXITS GRADUALLY IMPROVING Software and IT Services Led All Industry Sectors New York, NY, November 8, 2004 - Venture-backed merger and acquisition activity remained stable in the third quarter of 2004 with eighty-three companies acquired, according to Thomson Venture Economics and the National Venture Capital Association. Forty-three companies disclosed a combined value of $3.92 billion and the average deal valuation was $91.2 million for the quarter. While the average valuation was approximately 3% lower than the second quarter, it was 44% higher than the third quarter of 2003. Venture-Backed M&A by Year and Quarter, 1999-2004 Avg. Size Total Total of Number Disclosed Disclosed Disclosed of Transaction Value Value Quarter Deals Value ($M) Deals Deals ($M) 1999 240 162 37,545.51 231.76 2000 316 202 68,353.11 338.38 2001 350 165 17,660.67 107.03 2002 315 150 7,830.86 52.20 2003-1 68 21 1,453.29 69.20 2003-2 74 27 1,841.93 68.22 2003-3 77 41 2,127.67 51.89 2003-4 71 34 2,303.20 67.74 2003 290 123 7,726.09 62.81 2004-1 78 44 3,900.00 88.64 2004-2 86 48 4,514.59 94.05 2004-3 83 43 3,924.14 91.26 YTD2004 247 135 12,338.73 91.39 Source: Thomson Venture Economics & National Venture Capital Association “The cornerstone of a strong exit market is sustainability, said Mark Heesen, president of the National Venture Capital Association. “The acquisition activity may fluctuate within a certain range but over time we are looking for a gradual increase in the number and
- 2. value of the deals completed. We are seeing a healthier 2004 than 2003 both in the number and valuation of these companies. Much of this is because some of these companies established pre-2000 are now gaining some traction.” Year to date, 2004 has shown a 59.7% increase in total transaction value and a 12.7% rise in deal volume compared to the first three quarters of 2003. Further, an analysis of the relationship between transaction values and amounts invested by venture capitalists shows the improving strength of the market in 2004. Over the first nine months of 2004, 42 out of 134 disclosed value deals reported transaction values at least four times greater than the amount invested. These exits are 31.1% of the total thus far in 2004, while over the same period of 2003 they represented only 20.2% of the activity. Those deals that returned values greater than ten times the amount invested have been more prevalent this year as well, accounting for 13.4% of the disclosed value deals. During the first three quarters of 2003, they comprised only 4.5%. Analysis of Transaction Values versus Amount Invested 1Q-3Q 1Q-3Q Relationship between transaction value and investment 2003 2004 Deals where transaction value is less than total venture investment 34 47 Deals where transaction value is 1-4x total venture investment 37 45 Deals where transaction value is 4x-10x total venture investment 14 24 Deals where transaction value is greater than 10x venture investment 4 18 Total Disclosed Deals 89 134** Source: Thomson Venture Economics & National Venture Capital Association ** In 2004 135 deals had a disclosed value, but one of these targets did not have a disclosed total investment Software targets had a strong third quarter, making up 39% of all deals, with thirty-three companies acquired. Of these, seventeen disclosed a total value of $1.5 billion. In the second quarter, ten software companies out of twenty-five reported a combined value of $791.3 million. The strength of the software sector this quarter was anchored by three deals. Seisint was acquired by LexisNexis Group for $775 million; Matrics was bought by Symbol Technologies for $239 million; and Procket Networks sold to Cisco for $89 million. All three deals were in the top ten for the quarter. The Seisint deal is also the largest of 2004 thus far.
- 3. IT Services ranked second in the third quarter with five deals out of seven reporting $1.1 billion in transaction value. E-commerce services company Lynk Systems was acquired for $525 million by the Royal Bank of Scotland; and Lucent Technologies paid $295.7 million for Telica, a telecommunications equipment supplier. Venture-Backed M&A Activity by Sector, Q3 2004 Q3 2004 Avg. Size of Disclosed Disclosed Value Total Total Value Deals Industry Deals Deals Value($M) ($M) Software 33 17 1,535.56 90.33 IT Services 7 5 1,108.77 221.75 Telecommunications 4 3 340.21 113.40 Media and Entertainment 7 3 265.50 88.50 Medical Devices and Equipment 5 3 173.50 57.83 Biotechnology 7 5 148.72 29.74 Networking and Equipment 4 3 125.45 41.82 Semiconductors 2 1 95.53 95.53 Business Products and Services 3 1 73.00 73.00 Computers and Peripherals 3 1 53.00 53.00 Consumer Products and Services 1 1 4.90 4.90 Electronics/Instrumentation 1 N/A N/A N/A Financial Services 2 N/A N/A N/A Healthcare Services 1 N/A N/A N/A Industrial/Energy 1 N/A N/A N/A Other 1 N/A N/A N/A Retailing/Distribution 1 N/A N/A N/A 83 43 3,924.14 91.26 Source: Thomson Venture Economics & National Venture Capital Association
- 4. An examination of funding histories reveals that 79% of the companies acquired in 2004 received their first round of venture financing prior to the technology bubble burst. Of the 18 companies that received greater than 10x the venture investment this year, 11 were funded pre-bubble burst. These figures demonstrate availability of viable exit options for companies that survived the recession. Funding History of Companies Acquired in 2004 (Q1 – Q3) Total number of companies Year of acquired this year First that had first Investment funding in: 1984 1 1992 1 1994 2 1995 11 1996 7 1997 14 1998 36 1999 60 2000 63 2001 27 2002 13 2003 10 2004 2 247 Thomson Venture Economics, a Thomson Financial company, is the foremost information provider for equity professionals worldwide. Venture Economics offers an unparalleled range of products from directories to conferences, journals, newsletters, research reports, and the Venture Expert™ database. For over 35 years, Venture Economics has been tracking the venture capital and buyouts industry. Since 1961, it has been a recognized source for comprehensive analysis of investment activity and performance of the private equity industry. Venture Economics maintains a long-standing relationship within the private equity investment community, in-depth industry knowledge, and proprietary research techniques. Private equity managers and institutional investors alike consider Venture Economics information to be the industry standard. For more information about Venture Economics, please visit www.ventureeconomics.com. About Thomson Financial Thomson Financial is a US$1.5 billion provider of information and technology solutions to the worldwide financial community. Through the widest range of products and services in the industry, Thomson Financial helps clients in more than 70 countries make better decisions, be more productive and achieve superior results. Thomson Financial is part of The Thomson
- 5. Corporation (www.thomson.com), a leading provider of value-added information, software tools and applications to more than 20 million users in the fields of law, tax, accounting, financial services, higher education, reference information, corporate training and assessment, scientific research and healthcare. With revenues of US$7.6 billion, The Thomson Corporation lists its common shares on the New York and Toronto stock exchanges (NYSE: TOC; TSX: TOC). About NVCA The National Venture Capital Association (NVCA) represents approximately 450 venture capital and private equity firms. NVCA's mission is to foster greater understanding of the importance of venture capital to the U.S. economy, and support entrepreneurial activity and innovation. According to a 2004 Global Insight study, venture-backed companies accounted for 10.1 million jobs and $1.8 trillion in revenue in the U.S. in 2003. The NVCA represents the public policy interests of the venture capital community, strives to maintain high professional standards, provides reliable industry data, sponsors professional development, and facilitates interaction among its members. For more information about the NVCA, please visit www.nvca.org.