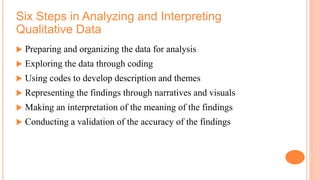
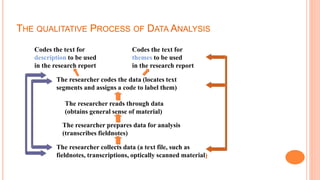
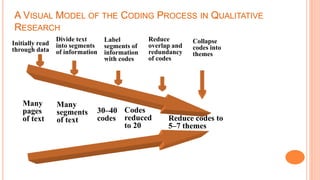
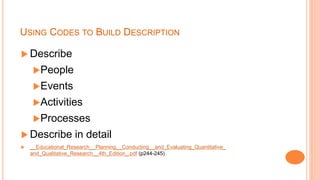
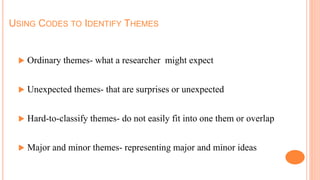
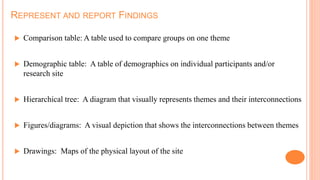
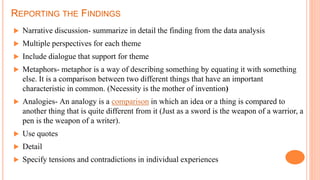
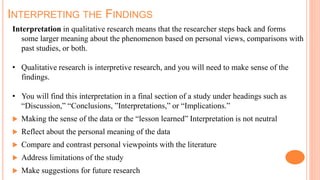
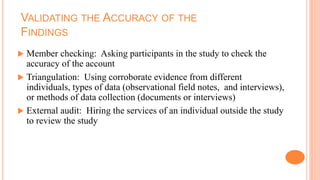
Advanced Research Methods- Quantitative and
qualitative (DVMT 523)
1
SGDS
John W. Creswell (2012). Educational Research: Planning, Conducting, and
Evaluating Quantitative and Qualitative Research, 4th ed: Pearson Education Inc.
CHAPTER II
THE PROCESS OF CONDUCTING RESEARCH
Analyzing & Interpreting Qualitative Data
John W. Creswell (2012). Educational Research: Planning, Conducting, and
Evaluating Quantitative and Qualitative Research, 4th ed: Pearson Education Inc.
The NIHR RDS for the East Midlands / Yorkshire & the Humber (2009)
QUALITATIVE DATAANALYSIS
Analyzing & Interpreting Qualitative Data
By the end of this session, you should be able to:
 Understand qualitative data analysis
 Identify the six steps in the process of analyzing and interpreting
qualitative data
 Describe how to prepare and organize the data for analysis
 Describe how to explore and code the data
 Use codes to build description and themes
 Construct a representation and reporting of qualitative findings
 Make an interpretation of the qualitative findings
 Advance validation for the accuracy of your findings
DATA ANALYSIS?
 During or immediately after data collection, you need to make sense of the
information supplied by individuals in the study.
 Analysis consists of “taking the data apart” to determine individual responses
and then “putting it together” to summarize it.
 Analyzing and interpreting the data involves drawing conclusions about it;
representing it in tables, figures, and pictures to summarize it; and
explaining the conclusions in words to provide answers to your research
questions..
DATA ANALYSIS IN QUALI AND QUANTI
 Qualitative research– generate a mass of words generated by interviews or
observational data needs to be described and summarised.
 researchers need to seek relationships between various themes that have been identified, or
to relate behaviour or ideas to biographical characteristics of respondents such as age or
gender.
 theory could be developed and tested using advanced analytical techniques.
 Quantitative research- generate a mass of numbers that need to be summarised,
described and analysed.
 characteristics of the data may be described and explored by drawing graphs and charts,
doing cross tabulations and calculating means and standard deviations.
 seeking patterns and relationships in the data by performing multiple regression, or an
analysis of variance perhaps.
QUALITATIVE DATA ANALYSIS?
 Qualitative data analysis is the classification and interpretation of
linguistic (or visual) material to make statements about implicit and
explicit dimensions and structures of meaning-making in the material
and what is represented in it.
 Meaning-making can refer to subjective or social meanings.
 Qualitative data analysis also is applied to discover and describe
issues in the field or structures and processes in routines and
practices.
 Explain relationship
 Develop a theory- arrive at generalizable statements by comparing
various materials or various texts or several cases- develop theory
Six Steps in Analyzing and Interpreting
Qualitative Data
 Preparing and organizing the data for analysis
 Exploring the data through coding
 Using codes to develop description and themes
 Representing the findings through narratives and visuals
 Making an interpretation of the meaning of the findings
 Conducting a validation of the accuracy of the findings
THE QUALITATIVE PROCESS OF DATA ANALYSIS
Codes the text for
description to be used
in the research report
Codes the text for
themes to be used
in the research report
The researcher codes the data (locates text
segments and assigns a code to label them)
The researcher prepares data for analysis
(transcribes fieldnotes)
The researcher collects data (a text file, such as
fieldnotes, transcriptions, optically scanned material)
The researcher reads through data
(obtains general sense of material)
PREPARING AND ORGANIZING THE DATA
 Develop a matrix or table of sources that can be used to
organize the material
 Organize material by type
 Keep duplicate copies of materials
 Transcribe data
 Prepare data for hand or computer analysis (and select
computer program)
EXPLORING THE DATA
 Obtain a general sense of the data by performing a preliminary
exploratory analysis
 Read through fieldnotes and interviews several times to get a sense of
the interview and the observation
 Write memos in the margins of interviews or fieldnotes of your initial
reflections on the data
 Consider whether more data are needed
CODING THE DATA
 Read through all transcripts
 Start with one transcript
 Identify text segments. Ask, “What is this person saying?”
 Bracket text segment
 Assign code word
One, two, or three words that describe what is being said
Terms from the literature can be used
When possible use a participant’s actual words
Practice lean coding (30–40 codes)
CODING THE DATA (CONT’D)
 Include codes that describe the participants and site
 Reduce redundancy
 Take out codes that are duplicate ideas
 Reduce to a manageable list (usually 25–30)
 Collapse codes into themes, which are:
 The major ideas that emerge from the data
 The ideas the participants most frequently discuss, are unique or surprising,
have the most evidence to support them, or those you might expect to find
when studying the phenomenon
 Usually number 5–7
A VISUAL MODEL OF THE CODING PROCESS IN QUALITATIVE
RESEARCH
Reduce codes to
5–7 themes
Initially read
through data
Divide text
into segments
of information
Label
segments of
information
with codes
Reduce
overlap and
redundancy
of codes
Collapse
codes into
themes
Many
pages
of text
Many
segments
of text
30–40
codes
Codes
reduced
to 20
USING CODES TO BUILD DESCRIPTION
 Describe
People
Events
Activities
Processes
 Describe in detail
 __Educational_Research__Planning__Conducting__and_Evaluating_Quantitative_
and_Qualitative_Research__4th_Edition_.pdf (p244-245)
USING CODES TO IDENTIFY THEMES
 Ordinary themes- what a researcher might expect
 Unexpected themes- that are surprises or unexpected
 Hard-to-classify themes- do not easily fit into one them or overlap
 Major and minor themes- representing major and minor ideas
REPRESENT AND REPORT FINDINGS
 Comparison table: A table used to compare groups on one theme
 Demographic table: A table of demographics on individual participants and/or
research site
 Hierarchical tree: A diagram that visually represents themes and their interconnections
 Figures/diagrams: A visual depiction that shows the interconnections between themes
 Drawings: Maps of the physical layout of the site
REPORTING THE FINDINGS
 Narrative discussion- summarize in detail the finding from the data analysis
 Multiple perspectives for each theme
 Include dialogue that support for theme
 Metaphors- metaphor is a way of describing something by equating it with something
else. It is a comparison between two different things that have an important
characteristic in common. (Necessity is the mother of invention)
 Analogies- An analogy is a comparison in which an idea or a thing is compared to
another thing that is quite different from it (Just as a sword is the weapon of a warrior, a
pen is the weapon of a writer).
 Use quotes
 Detail
 Specify tensions and contradictions in individual experiences
INTERPRETING THE FINDINGS
Interpretation in qualitative research means that the researcher steps back and forms
some larger meaning about the phenomenon based on personal views, comparisons with
past studies, or both.
• Qualitative research is interpretive research, and you will need to make sense of the
findings.
• You will find this interpretation in a final section of a study under headings such as
“Discussion,” “Conclusions, ”Interpretations,” or “Implications.”
 Making the sense of the data or the “lesson learned” Interpretation is not neutral
 Reflect about the personal meaning of the data
 Compare and contrast personal viewpoints with the literature
 Address limitations of the study
 Make suggestions for future research
VALIDATING THE ACCURACY OF THE
FINDINGS
 Member checking: Asking participants in the study to check the
accuracy of the account
 Triangulation: Using corroborate evidence from different
individuals, types of data (observational field notes, and interviews),
or methods of data collection (documents or interviews)
 External audit: Hiring the services of an individual outside the study
to review the study
Thank You

chapter session 2.6 data analysis28,11.ppt

  • 1.
    Advanced Research Methods-Quantitative and qualitative (DVMT 523) 1 SGDS John W. Creswell (2012). Educational Research: Planning, Conducting, and Evaluating Quantitative and Qualitative Research, 4th ed: Pearson Education Inc.
  • 2.
    CHAPTER II THE PROCESSOF CONDUCTING RESEARCH Analyzing & Interpreting Qualitative Data John W. Creswell (2012). Educational Research: Planning, Conducting, and Evaluating Quantitative and Qualitative Research, 4th ed: Pearson Education Inc. The NIHR RDS for the East Midlands / Yorkshire & the Humber (2009) QUALITATIVE DATAANALYSIS
  • 3.
    Analyzing & InterpretingQualitative Data By the end of this session, you should be able to:  Understand qualitative data analysis  Identify the six steps in the process of analyzing and interpreting qualitative data  Describe how to prepare and organize the data for analysis  Describe how to explore and code the data  Use codes to build description and themes  Construct a representation and reporting of qualitative findings  Make an interpretation of the qualitative findings  Advance validation for the accuracy of your findings
  • 4.
    DATA ANALYSIS?  Duringor immediately after data collection, you need to make sense of the information supplied by individuals in the study.  Analysis consists of “taking the data apart” to determine individual responses and then “putting it together” to summarize it.  Analyzing and interpreting the data involves drawing conclusions about it; representing it in tables, figures, and pictures to summarize it; and explaining the conclusions in words to provide answers to your research questions..
  • 5.
    DATA ANALYSIS INQUALI AND QUANTI  Qualitative research– generate a mass of words generated by interviews or observational data needs to be described and summarised.  researchers need to seek relationships between various themes that have been identified, or to relate behaviour or ideas to biographical characteristics of respondents such as age or gender.  theory could be developed and tested using advanced analytical techniques.  Quantitative research- generate a mass of numbers that need to be summarised, described and analysed.  characteristics of the data may be described and explored by drawing graphs and charts, doing cross tabulations and calculating means and standard deviations.  seeking patterns and relationships in the data by performing multiple regression, or an analysis of variance perhaps.
  • 6.
    QUALITATIVE DATA ANALYSIS? Qualitative data analysis is the classification and interpretation of linguistic (or visual) material to make statements about implicit and explicit dimensions and structures of meaning-making in the material and what is represented in it.  Meaning-making can refer to subjective or social meanings.  Qualitative data analysis also is applied to discover and describe issues in the field or structures and processes in routines and practices.  Explain relationship  Develop a theory- arrive at generalizable statements by comparing various materials or various texts or several cases- develop theory
  • 7.
    Six Steps inAnalyzing and Interpreting Qualitative Data  Preparing and organizing the data for analysis  Exploring the data through coding  Using codes to develop description and themes  Representing the findings through narratives and visuals  Making an interpretation of the meaning of the findings  Conducting a validation of the accuracy of the findings
  • 8.
    THE QUALITATIVE PROCESSOF DATA ANALYSIS Codes the text for description to be used in the research report Codes the text for themes to be used in the research report The researcher codes the data (locates text segments and assigns a code to label them) The researcher prepares data for analysis (transcribes fieldnotes) The researcher collects data (a text file, such as fieldnotes, transcriptions, optically scanned material) The researcher reads through data (obtains general sense of material)
  • 9.
    PREPARING AND ORGANIZINGTHE DATA  Develop a matrix or table of sources that can be used to organize the material  Organize material by type  Keep duplicate copies of materials  Transcribe data  Prepare data for hand or computer analysis (and select computer program)
  • 10.
    EXPLORING THE DATA Obtain a general sense of the data by performing a preliminary exploratory analysis  Read through fieldnotes and interviews several times to get a sense of the interview and the observation  Write memos in the margins of interviews or fieldnotes of your initial reflections on the data  Consider whether more data are needed
  • 11.
    CODING THE DATA Read through all transcripts  Start with one transcript  Identify text segments. Ask, “What is this person saying?”  Bracket text segment  Assign code word One, two, or three words that describe what is being said Terms from the literature can be used When possible use a participant’s actual words Practice lean coding (30–40 codes)
  • 12.
    CODING THE DATA(CONT’D)  Include codes that describe the participants and site  Reduce redundancy  Take out codes that are duplicate ideas  Reduce to a manageable list (usually 25–30)  Collapse codes into themes, which are:  The major ideas that emerge from the data  The ideas the participants most frequently discuss, are unique or surprising, have the most evidence to support them, or those you might expect to find when studying the phenomenon  Usually number 5–7
  • 13.
    A VISUAL MODELOF THE CODING PROCESS IN QUALITATIVE RESEARCH Reduce codes to 5–7 themes Initially read through data Divide text into segments of information Label segments of information with codes Reduce overlap and redundancy of codes Collapse codes into themes Many pages of text Many segments of text 30–40 codes Codes reduced to 20
  • 14.
    USING CODES TOBUILD DESCRIPTION  Describe People Events Activities Processes  Describe in detail  __Educational_Research__Planning__Conducting__and_Evaluating_Quantitative_ and_Qualitative_Research__4th_Edition_.pdf (p244-245)
  • 15.
    USING CODES TOIDENTIFY THEMES  Ordinary themes- what a researcher might expect  Unexpected themes- that are surprises or unexpected  Hard-to-classify themes- do not easily fit into one them or overlap  Major and minor themes- representing major and minor ideas
  • 16.
    REPRESENT AND REPORTFINDINGS  Comparison table: A table used to compare groups on one theme  Demographic table: A table of demographics on individual participants and/or research site  Hierarchical tree: A diagram that visually represents themes and their interconnections  Figures/diagrams: A visual depiction that shows the interconnections between themes  Drawings: Maps of the physical layout of the site
  • 17.
    REPORTING THE FINDINGS Narrative discussion- summarize in detail the finding from the data analysis  Multiple perspectives for each theme  Include dialogue that support for theme  Metaphors- metaphor is a way of describing something by equating it with something else. It is a comparison between two different things that have an important characteristic in common. (Necessity is the mother of invention)  Analogies- An analogy is a comparison in which an idea or a thing is compared to another thing that is quite different from it (Just as a sword is the weapon of a warrior, a pen is the weapon of a writer).  Use quotes  Detail  Specify tensions and contradictions in individual experiences
  • 18.
    INTERPRETING THE FINDINGS Interpretationin qualitative research means that the researcher steps back and forms some larger meaning about the phenomenon based on personal views, comparisons with past studies, or both. • Qualitative research is interpretive research, and you will need to make sense of the findings. • You will find this interpretation in a final section of a study under headings such as “Discussion,” “Conclusions, ”Interpretations,” or “Implications.”  Making the sense of the data or the “lesson learned” Interpretation is not neutral  Reflect about the personal meaning of the data  Compare and contrast personal viewpoints with the literature  Address limitations of the study  Make suggestions for future research
  • 19.
    VALIDATING THE ACCURACYOF THE FINDINGS  Member checking: Asking participants in the study to check the accuracy of the account  Triangulation: Using corroborate evidence from different individuals, types of data (observational field notes, and interviews), or methods of data collection (documents or interviews)  External audit: Hiring the services of an individual outside the study to review the study
  • 20.