Downloaded 755 times


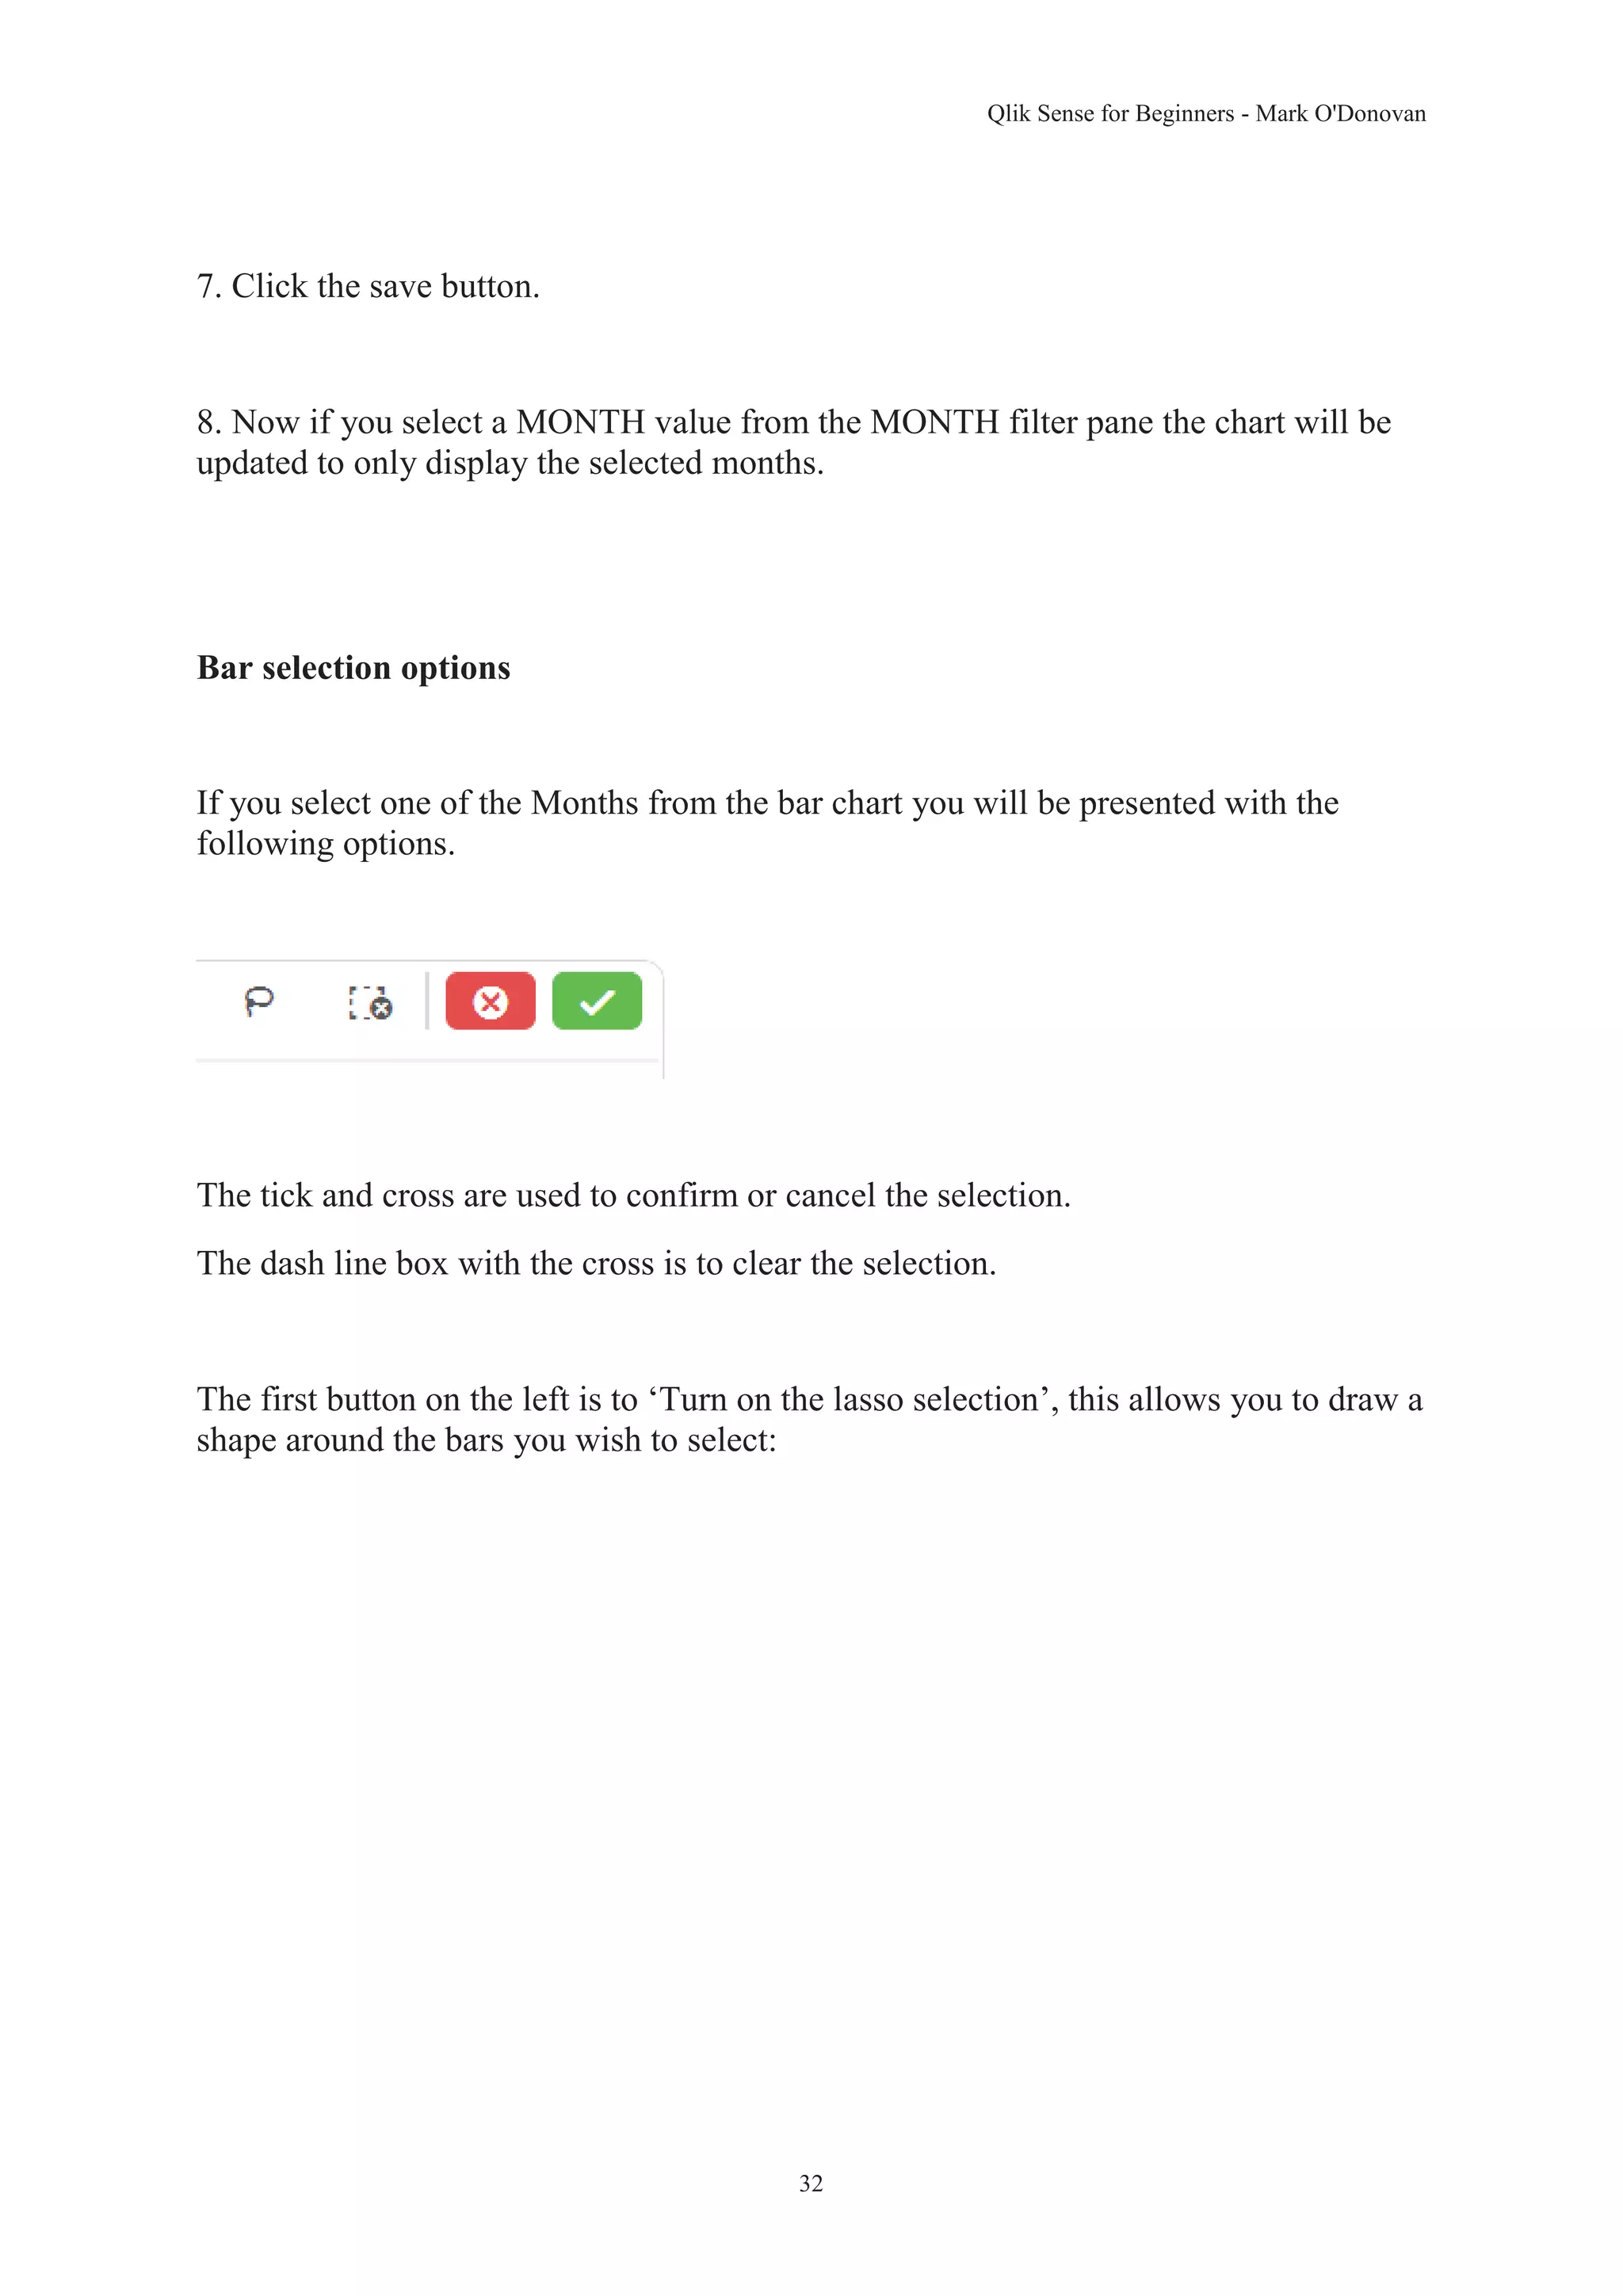
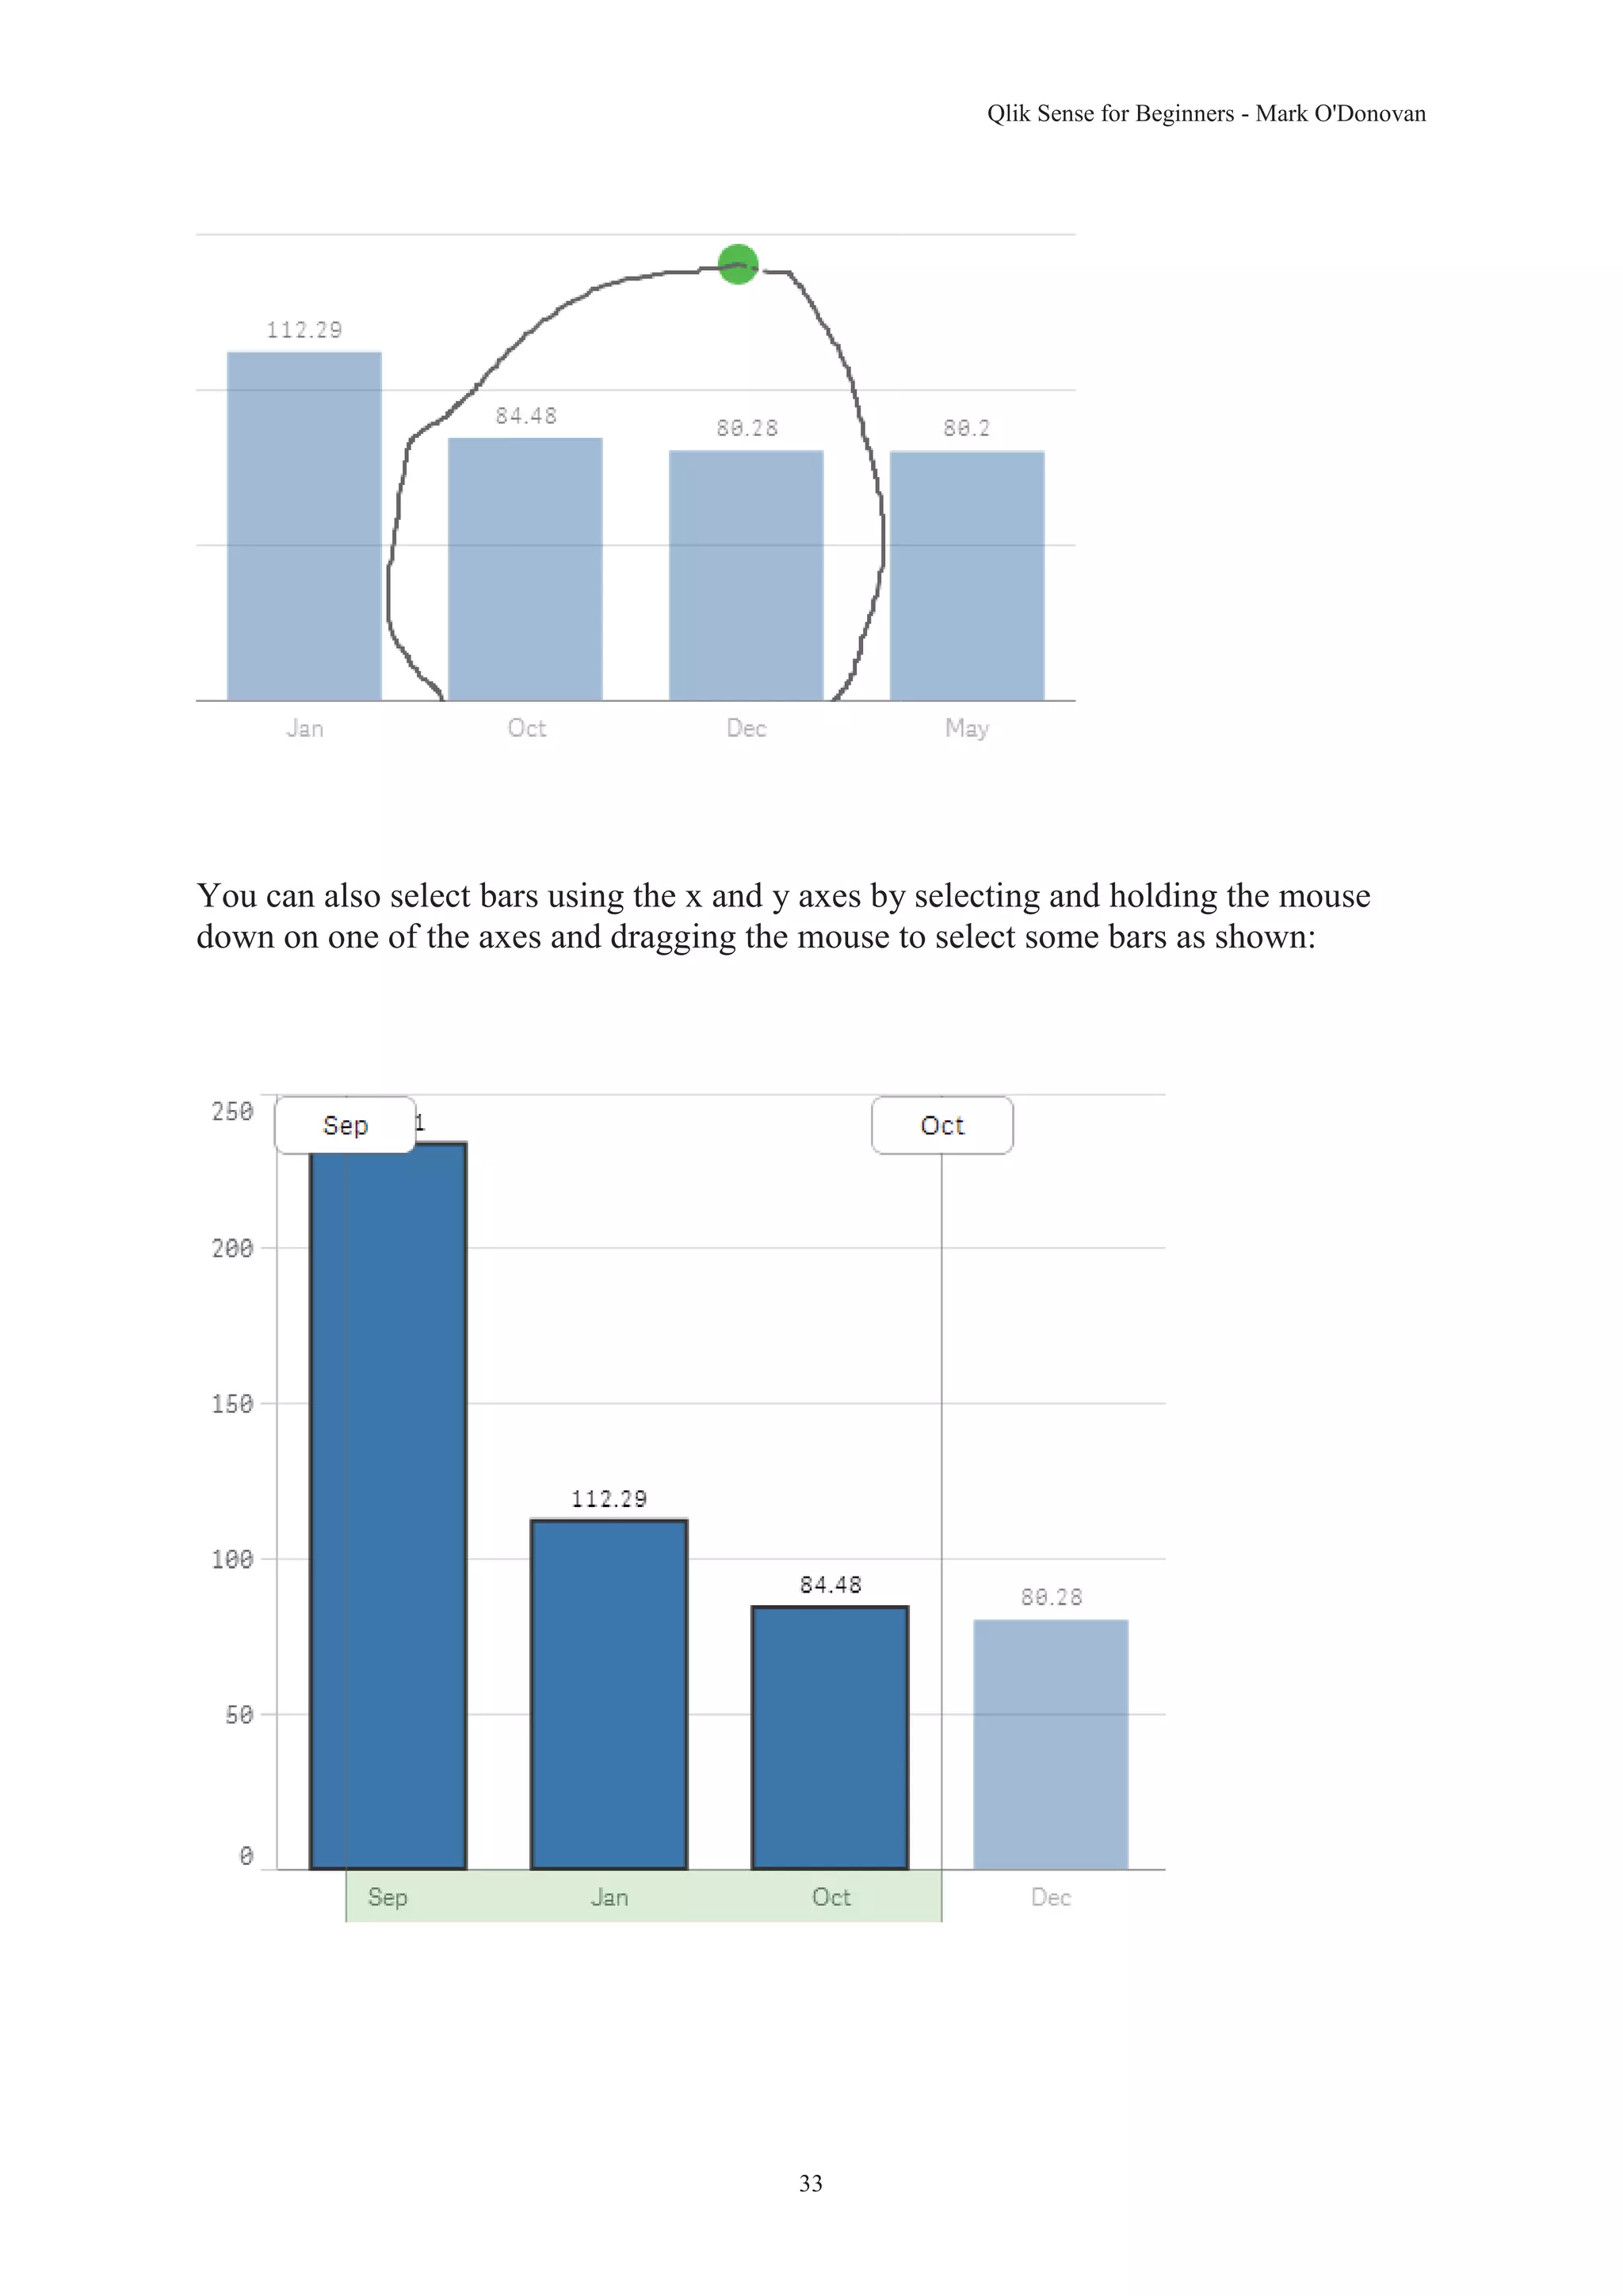
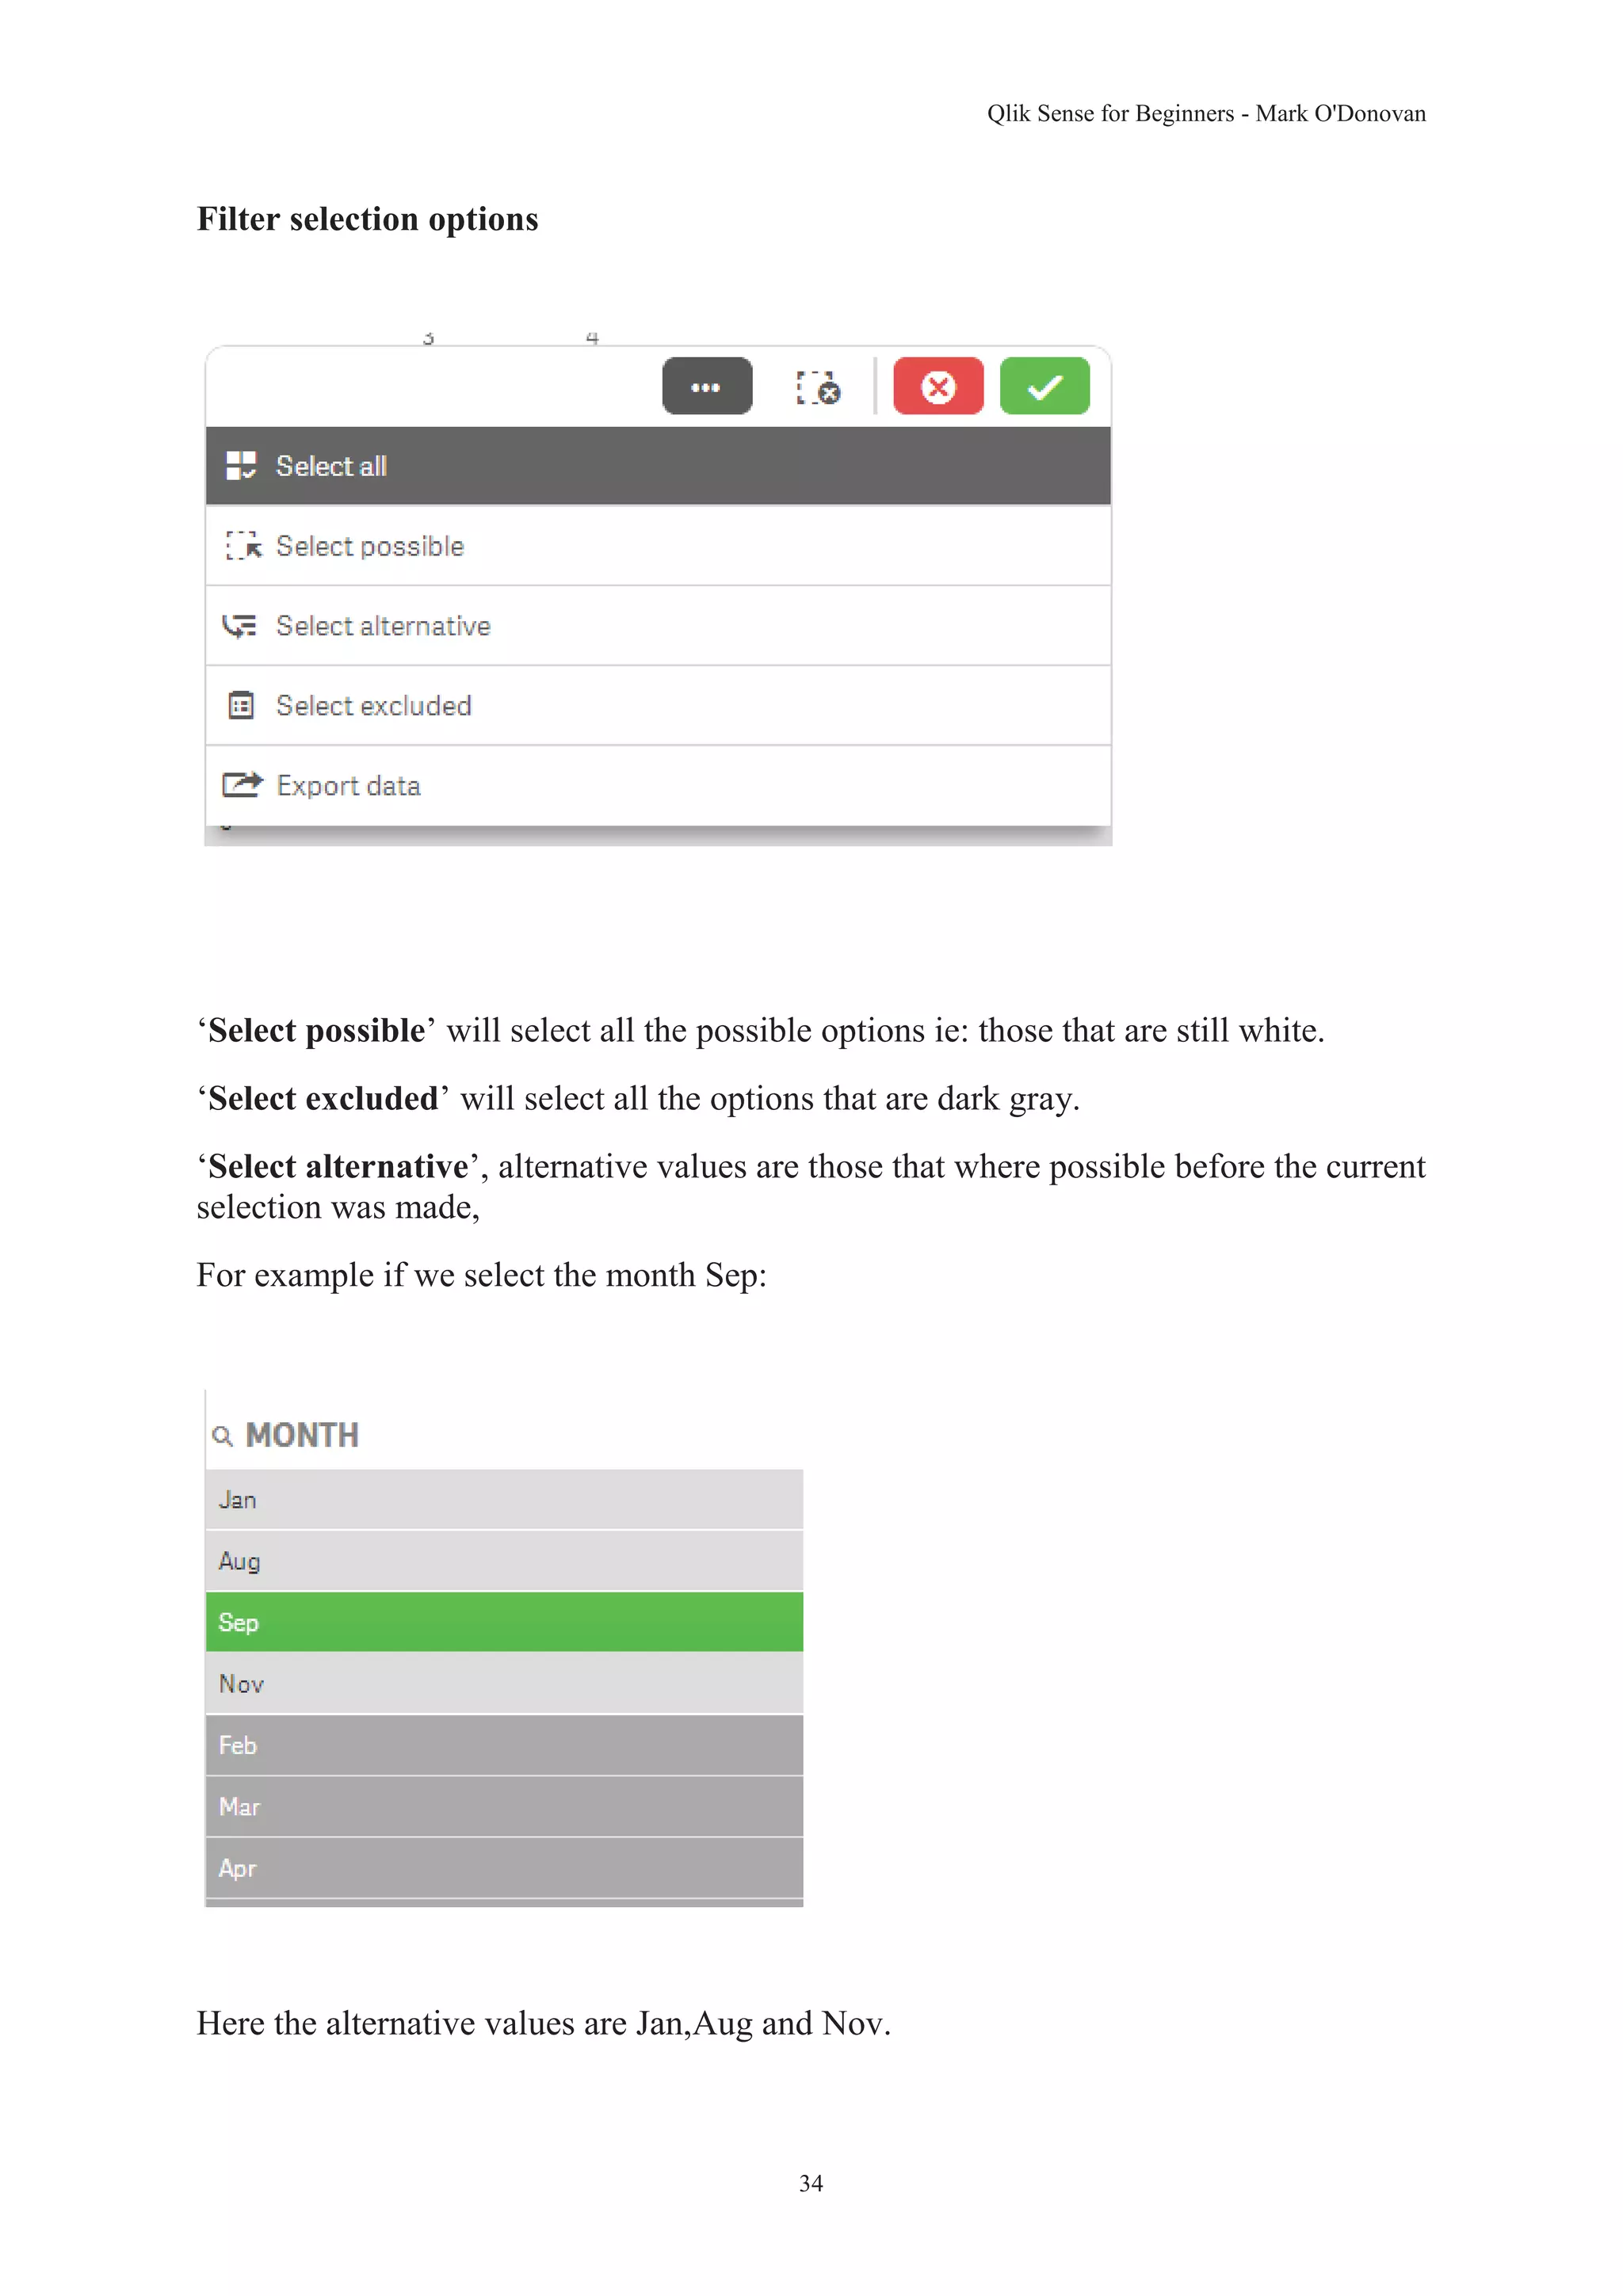

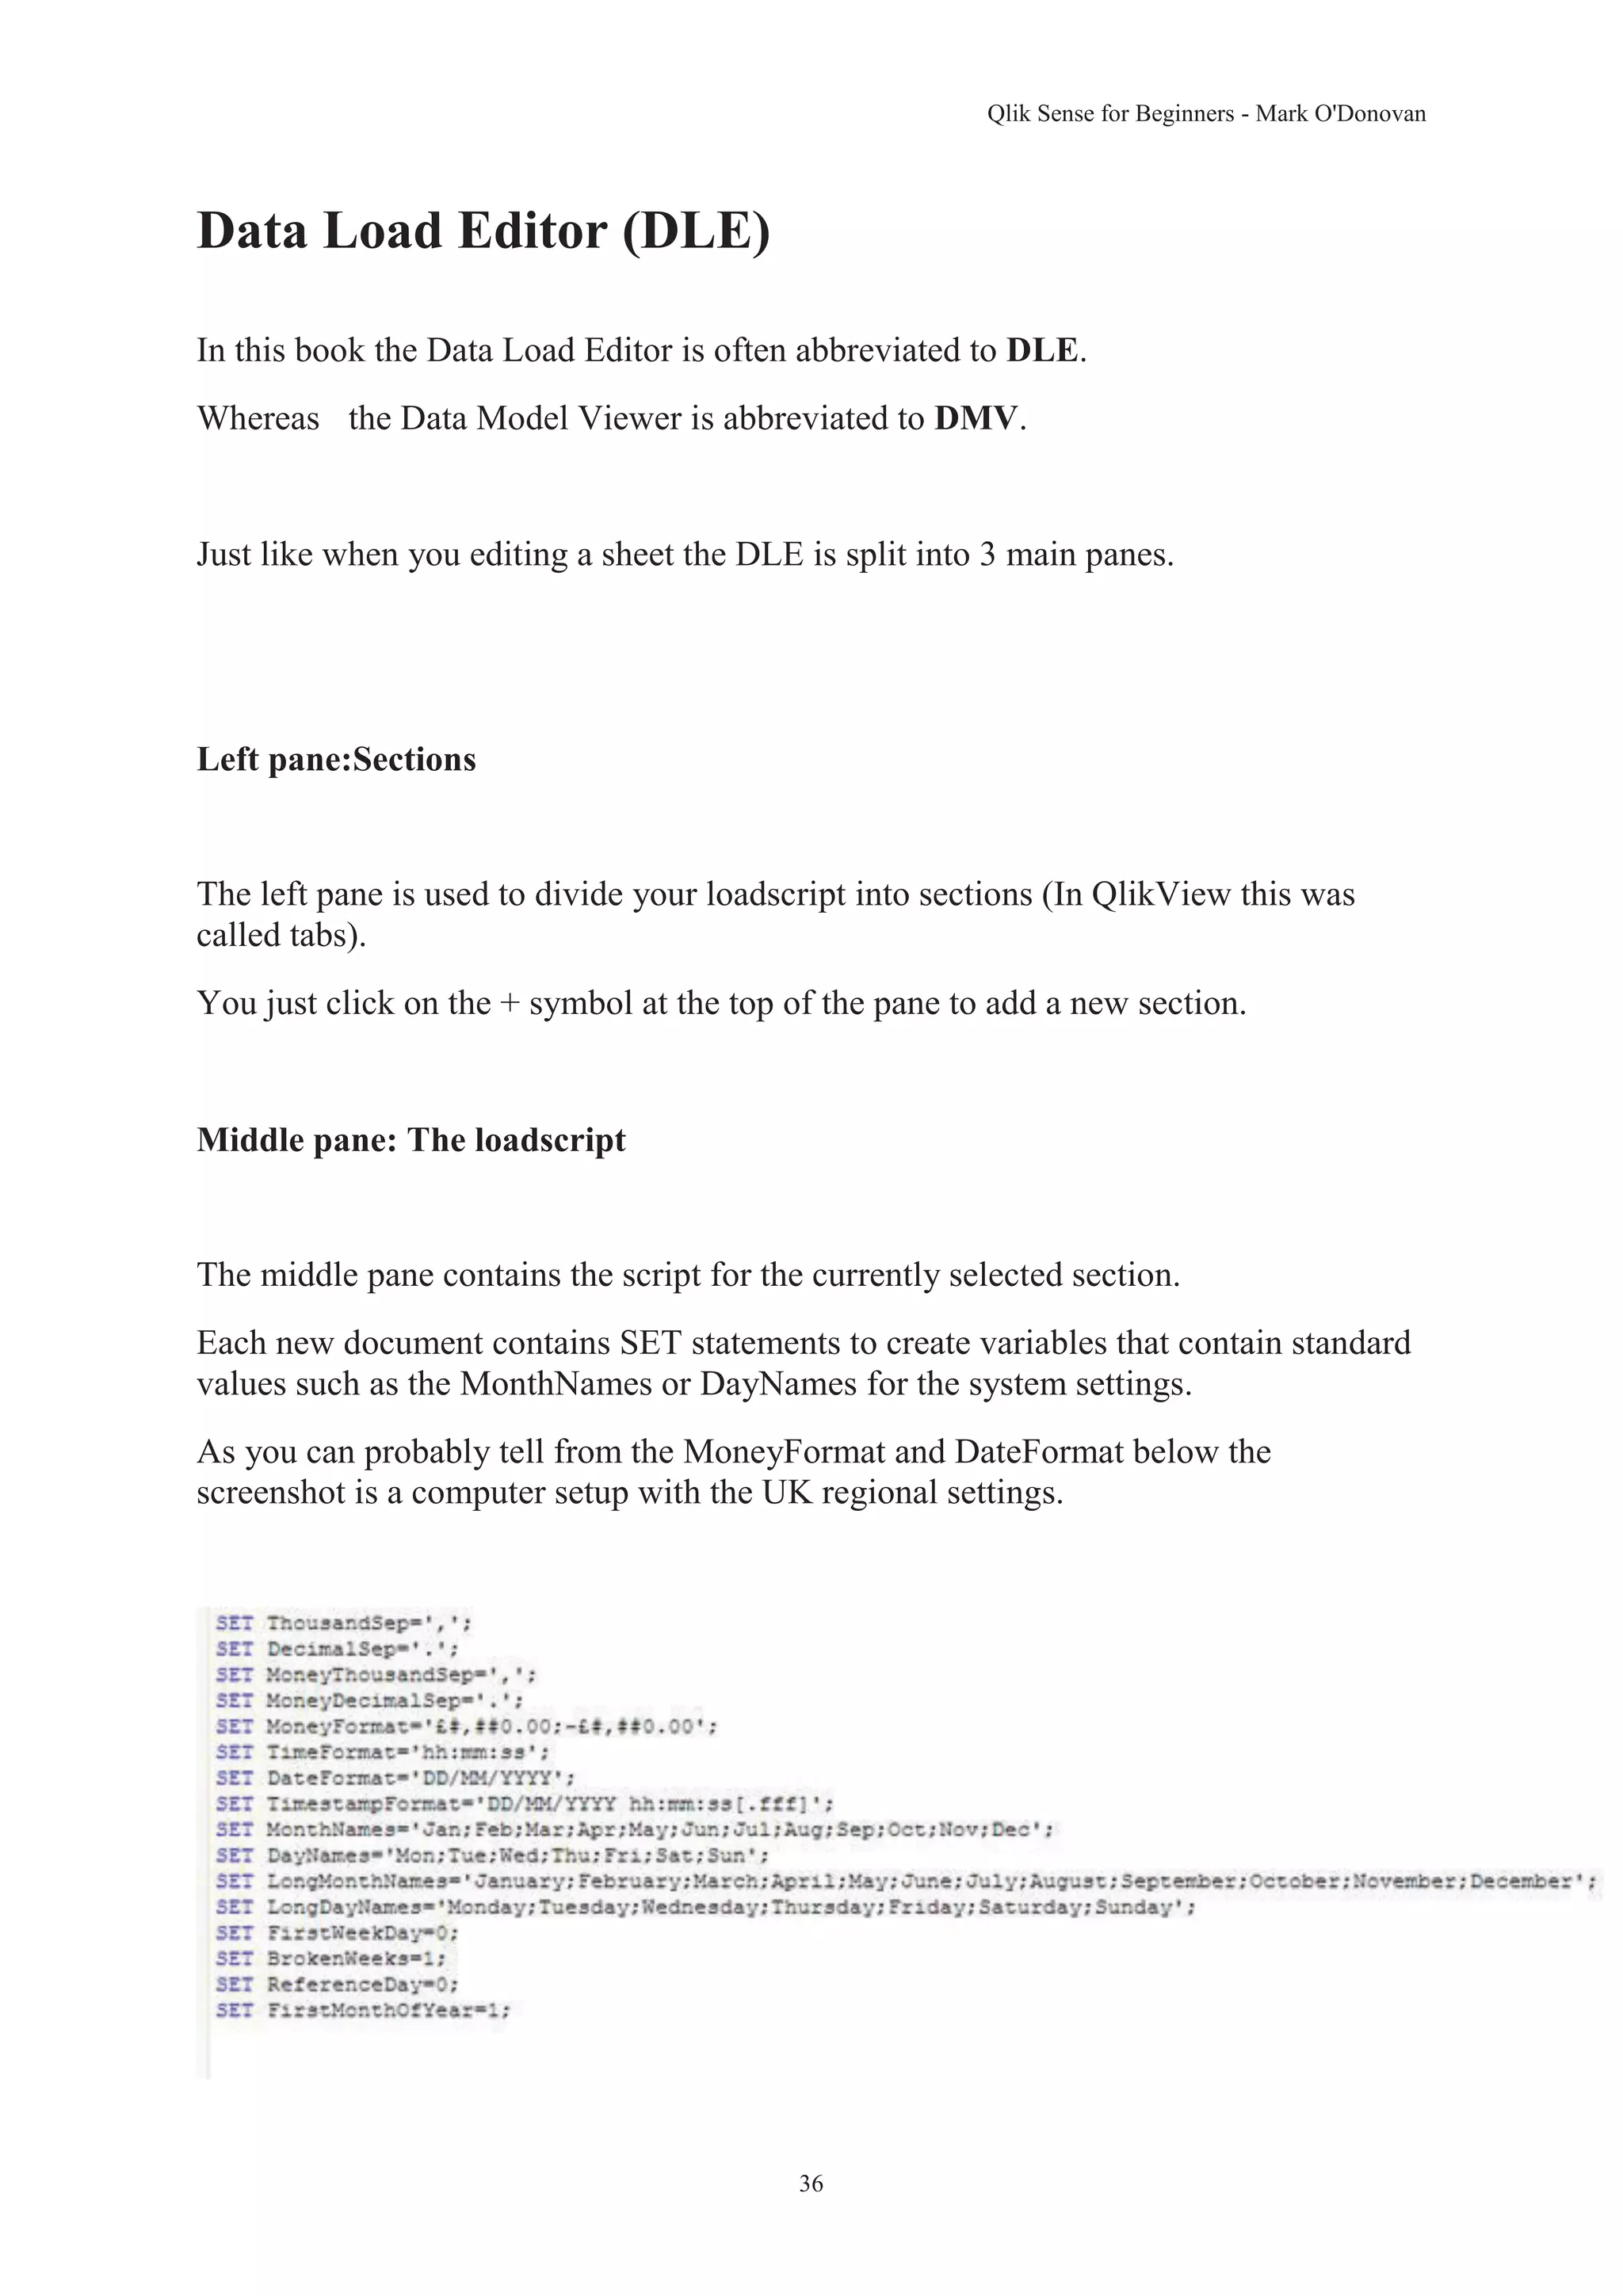
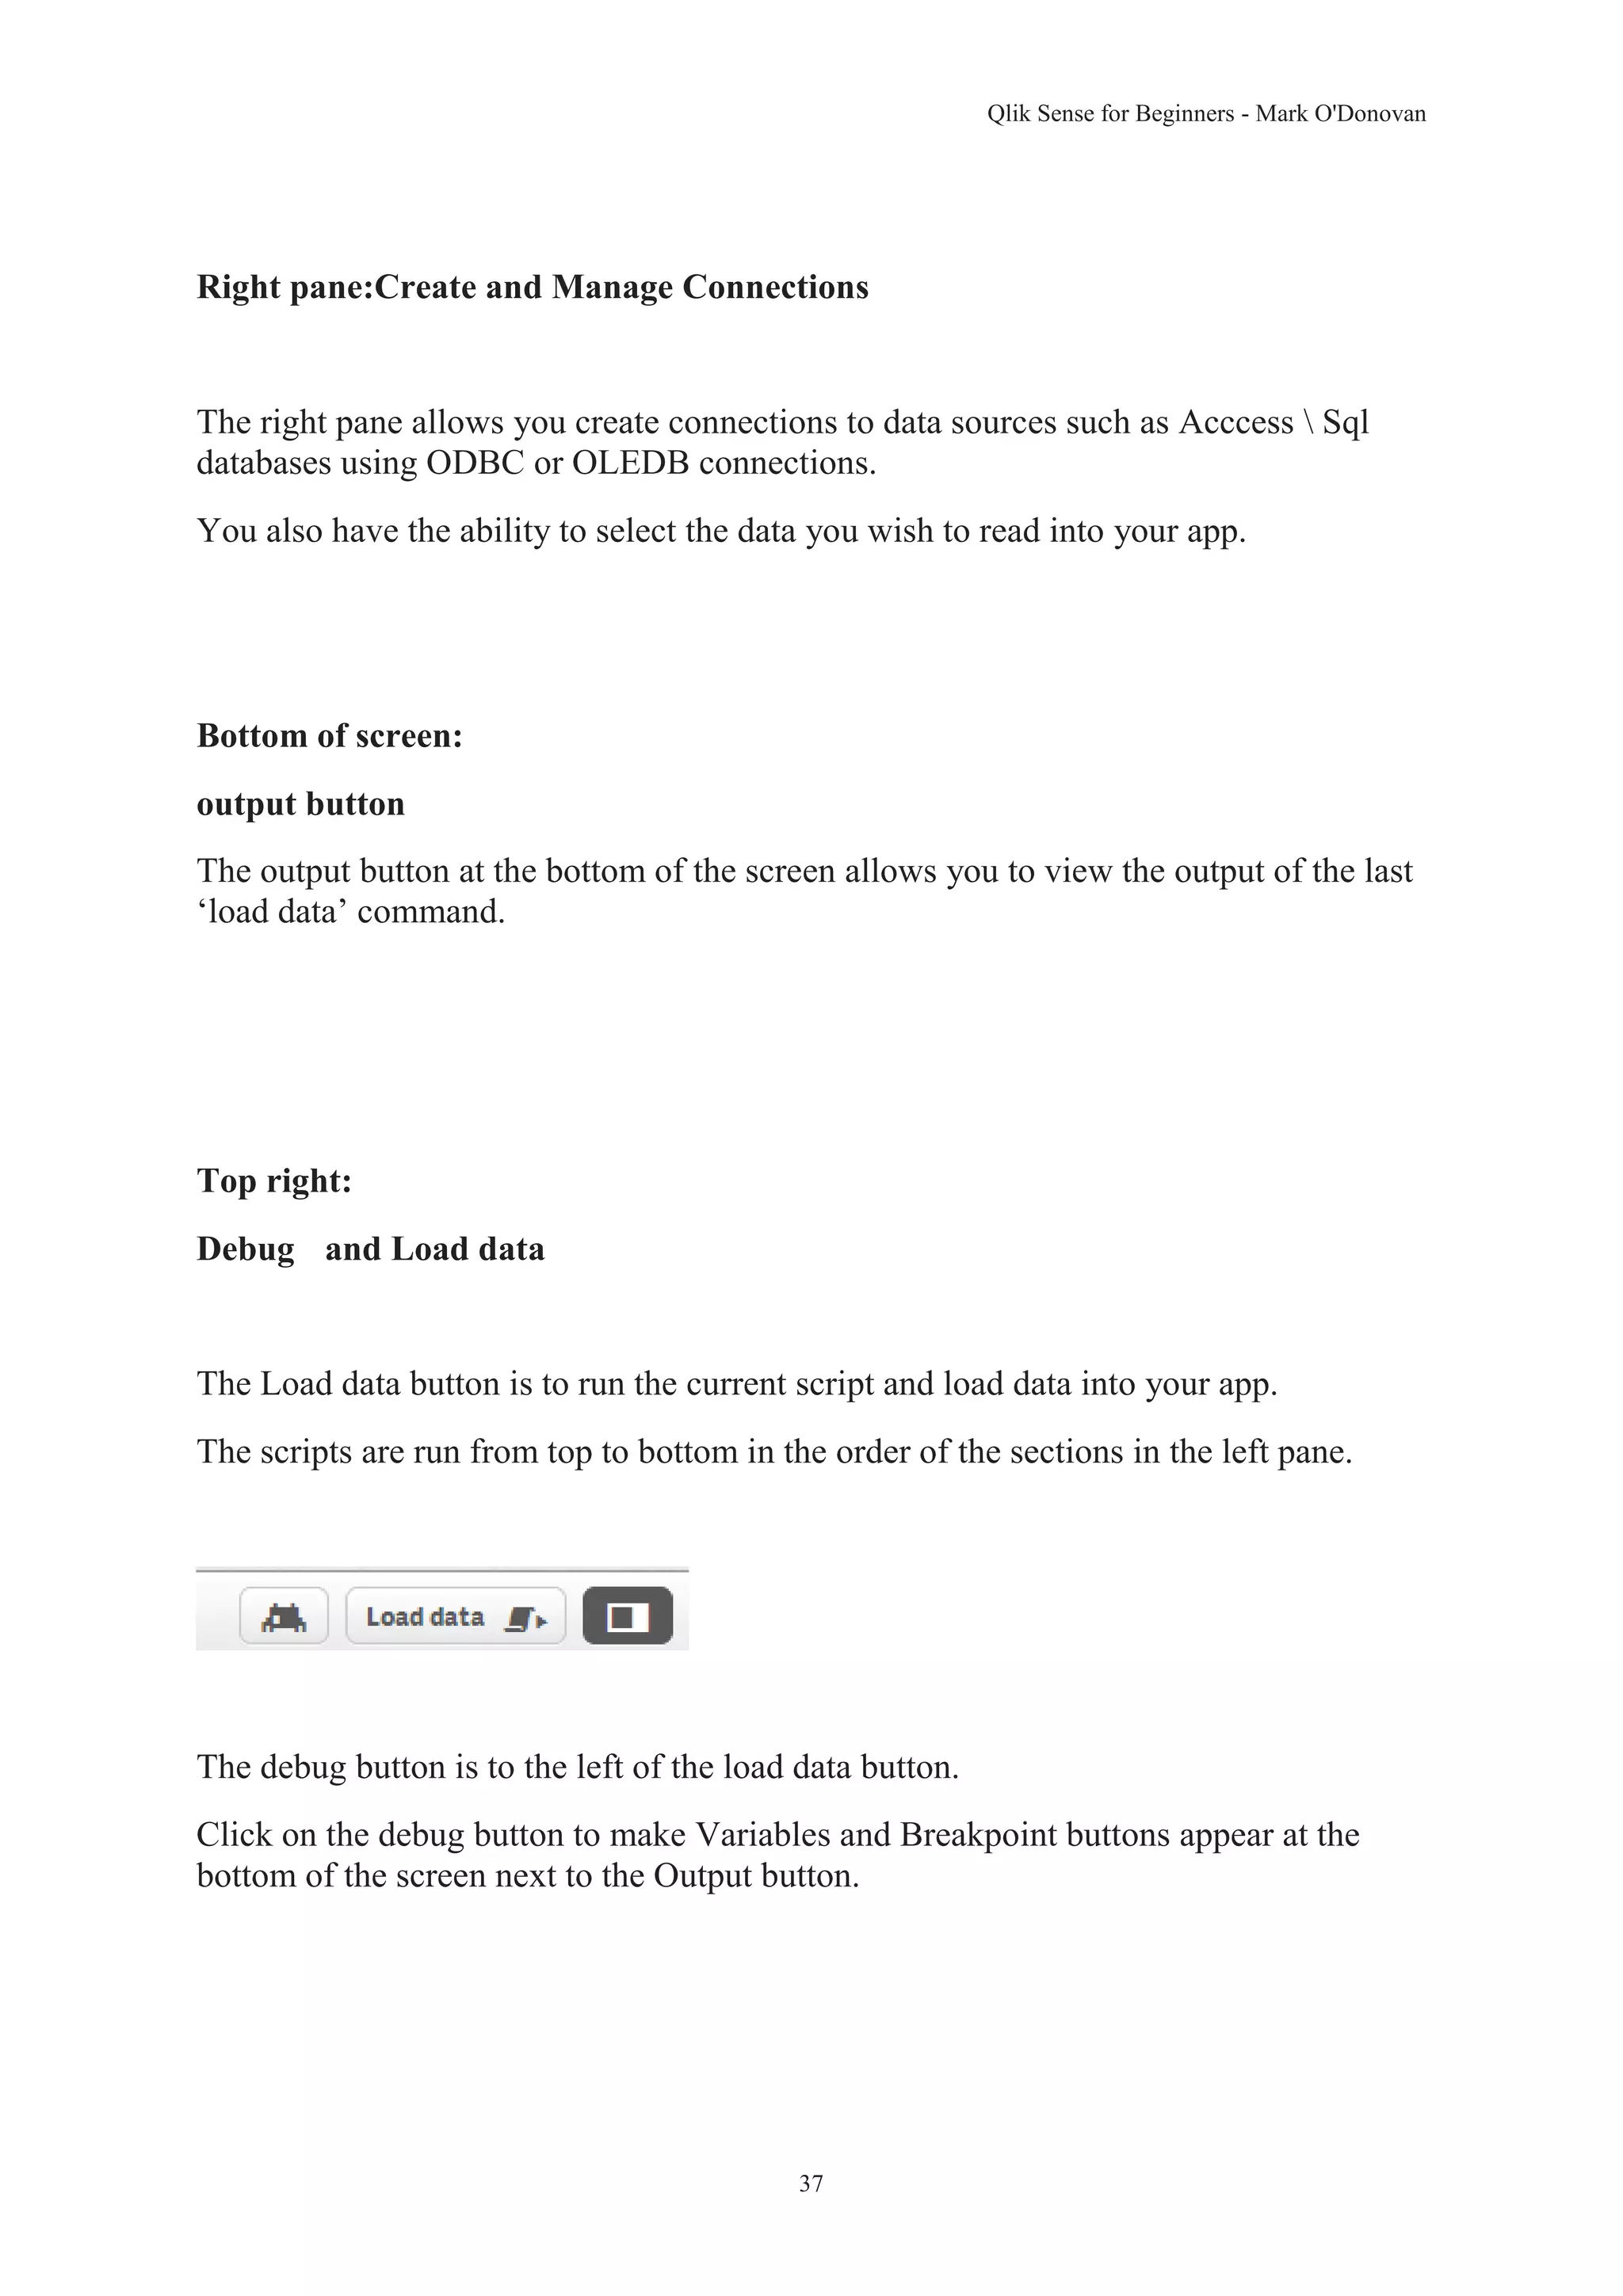

The document is a beginner's guide to Qlik Sense by Mark O'Donovan, covering installation, data importation, app creation, and advanced features. It includes detailed instructions, practical examples, and resources to help users gain proficiency in using Qlik Sense for data analysis and visualization. The author emphasizes the importance of self-service business intelligence and provides a comprehensive overview of the software's capabilities aimed at users from various backgrounds.


![Vibe Coding vs. Spec-Driven Development [Free Meetup]](https://cdn.slidesharecdn.com/ss_thumbnails/vibecodingvsspecdrivendevelopment-251209105622-43f455e7-thumbnail.jpg?width=640&height=640&fit=bounds)


