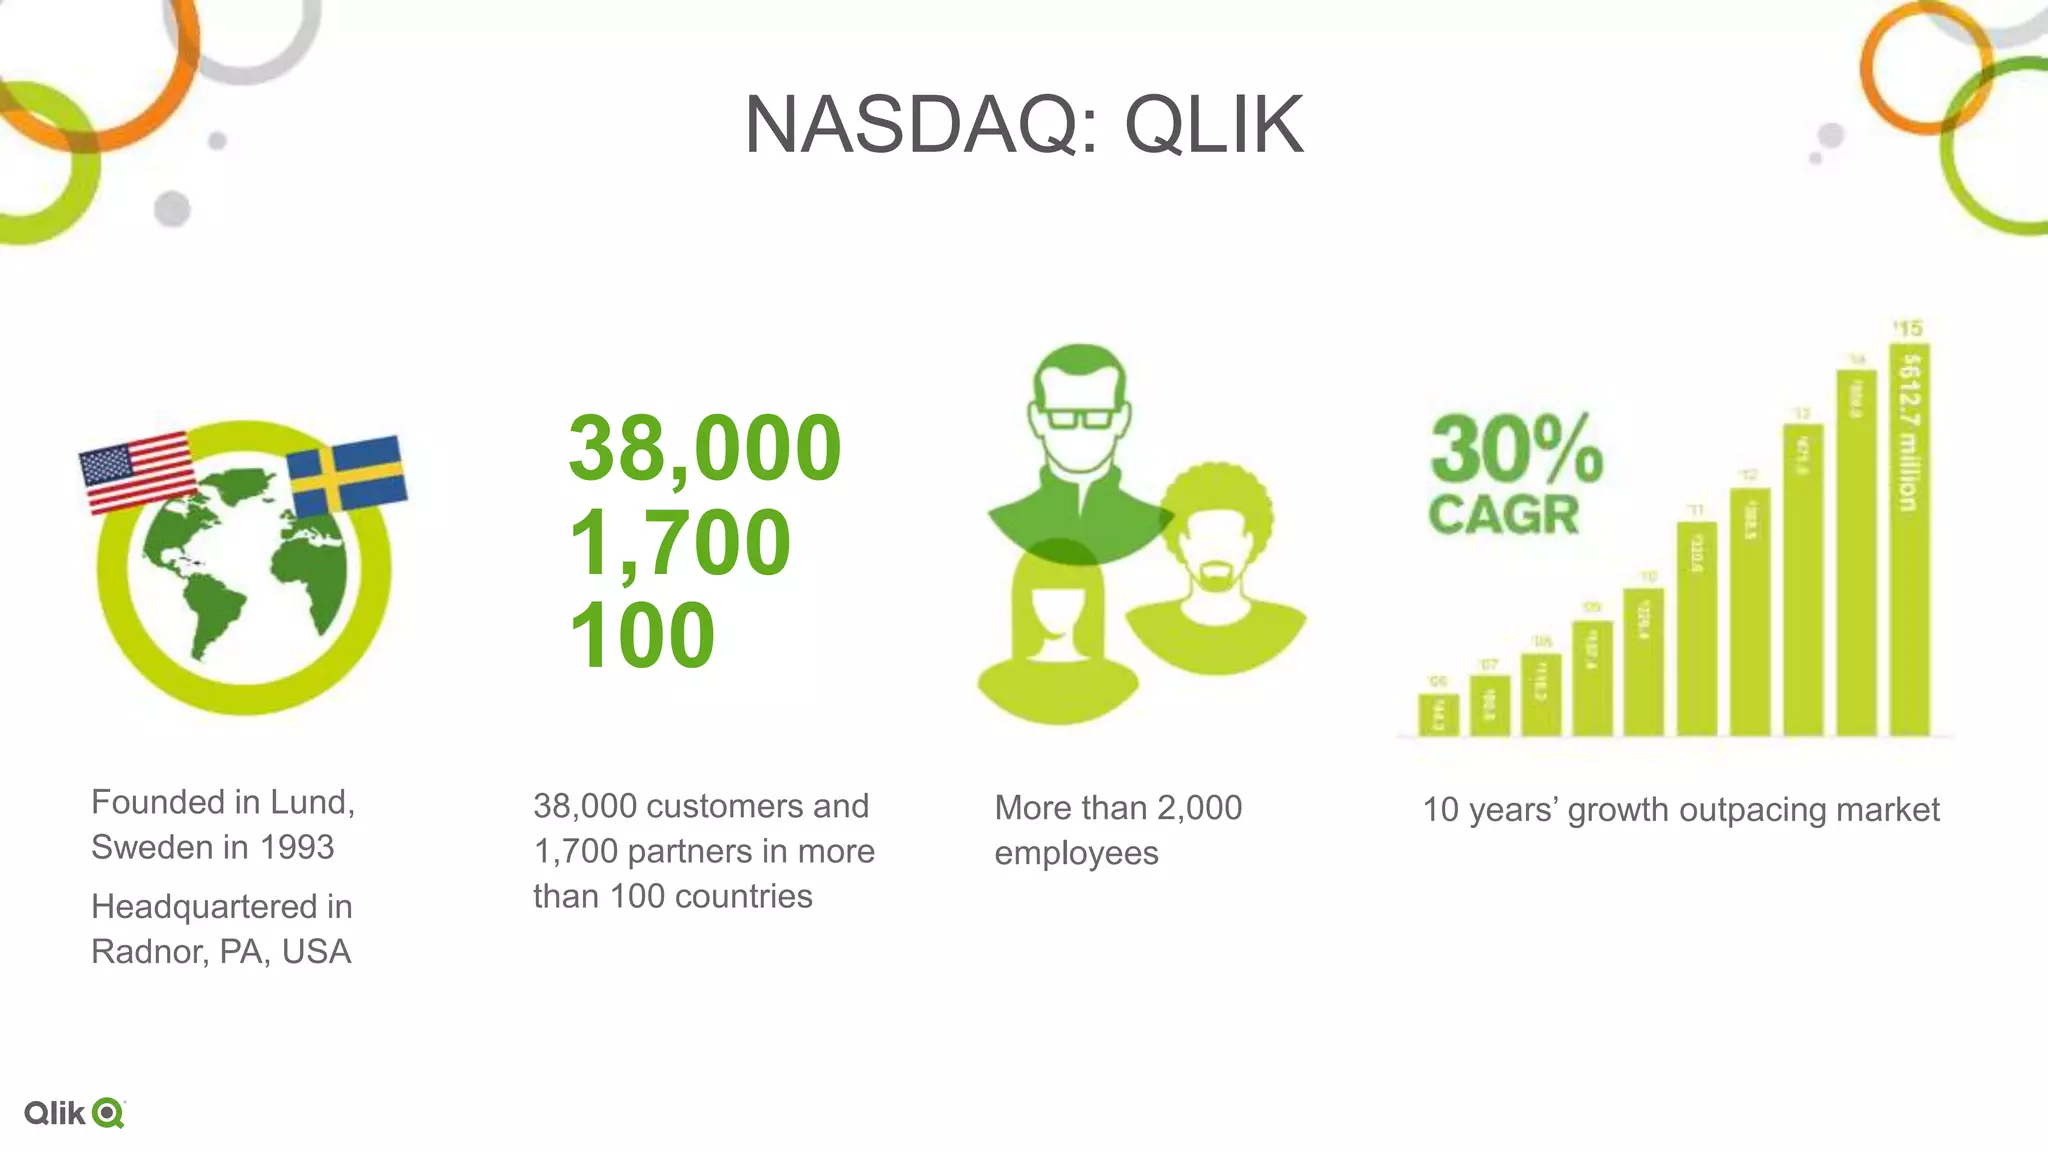
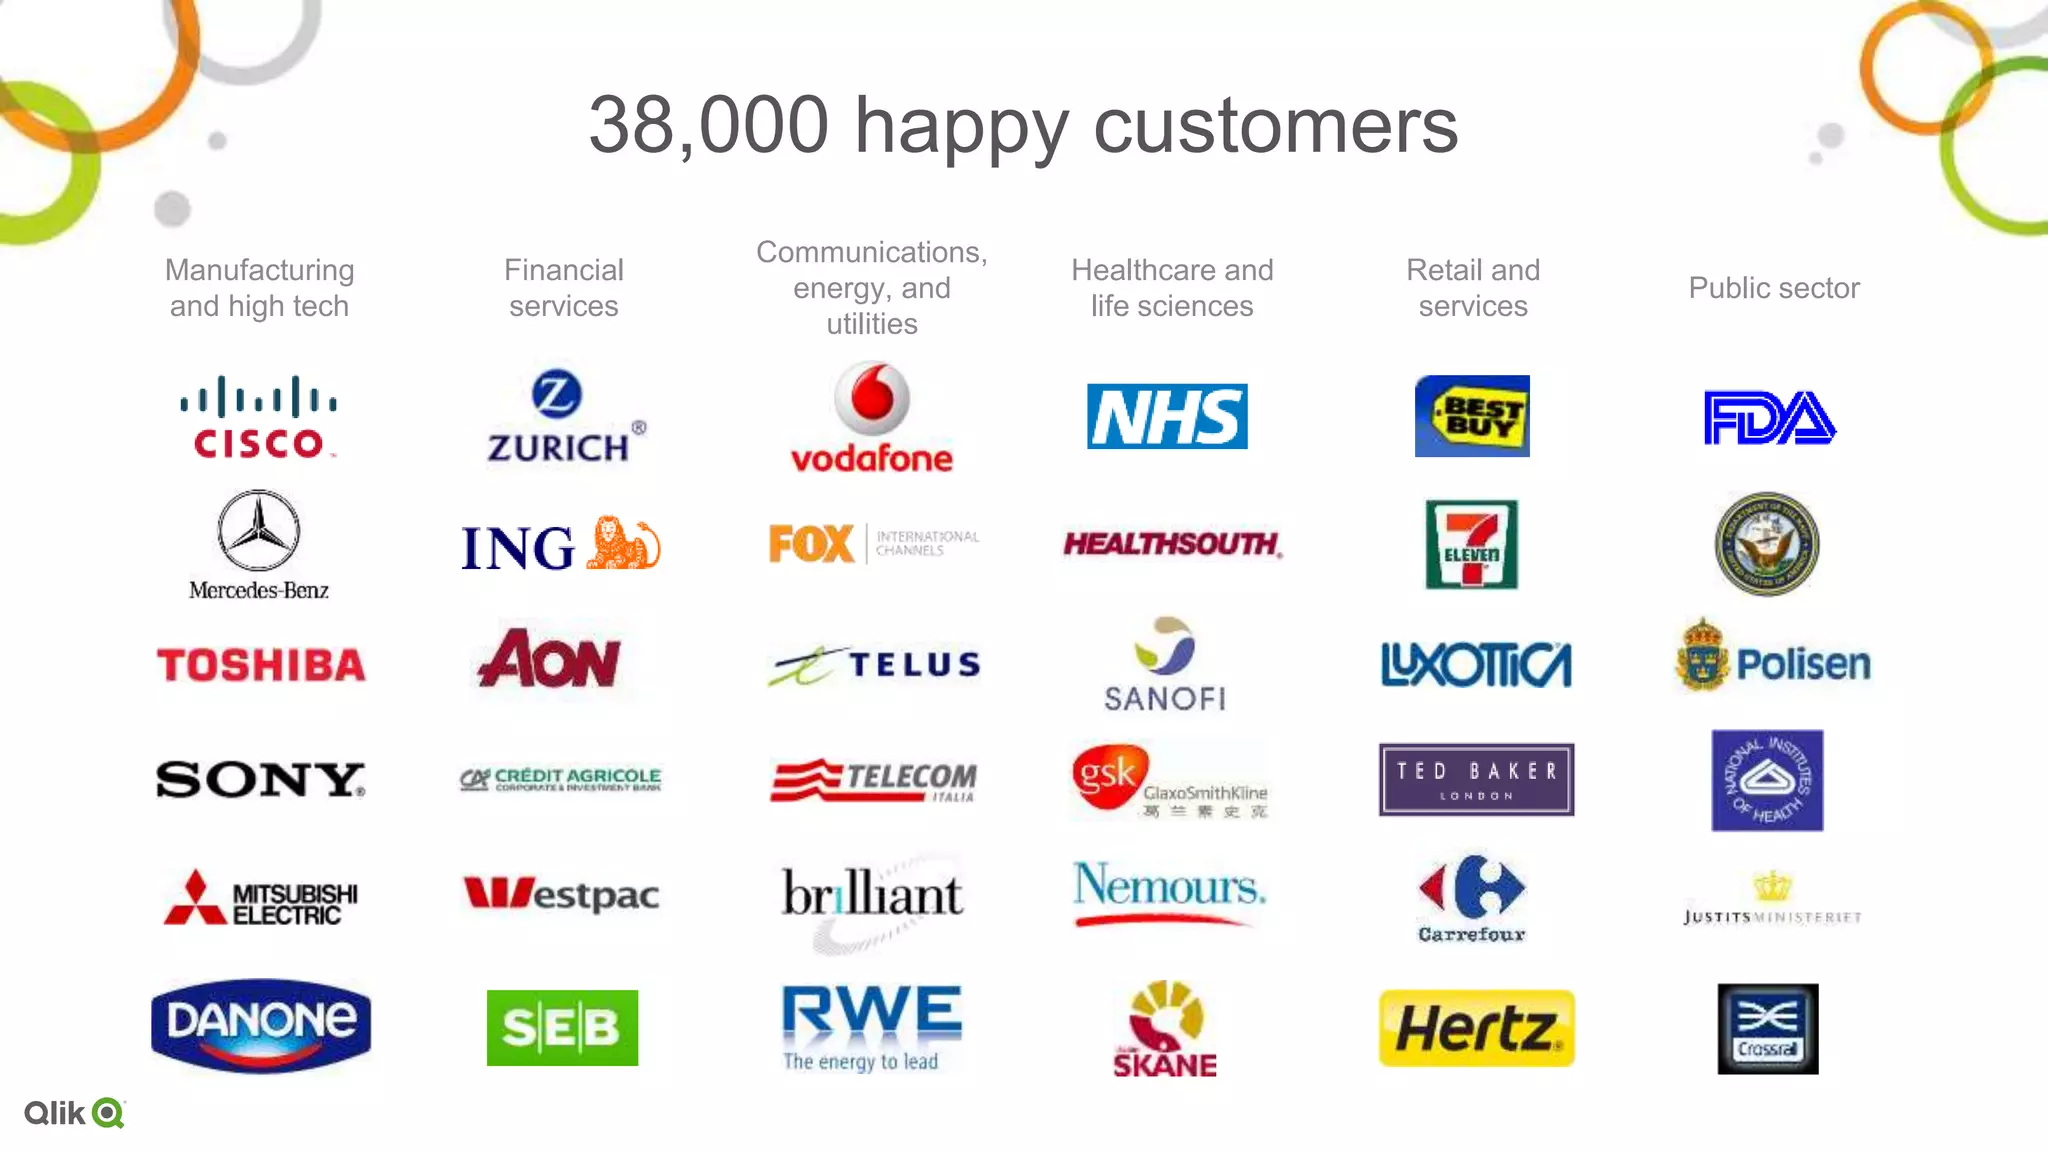
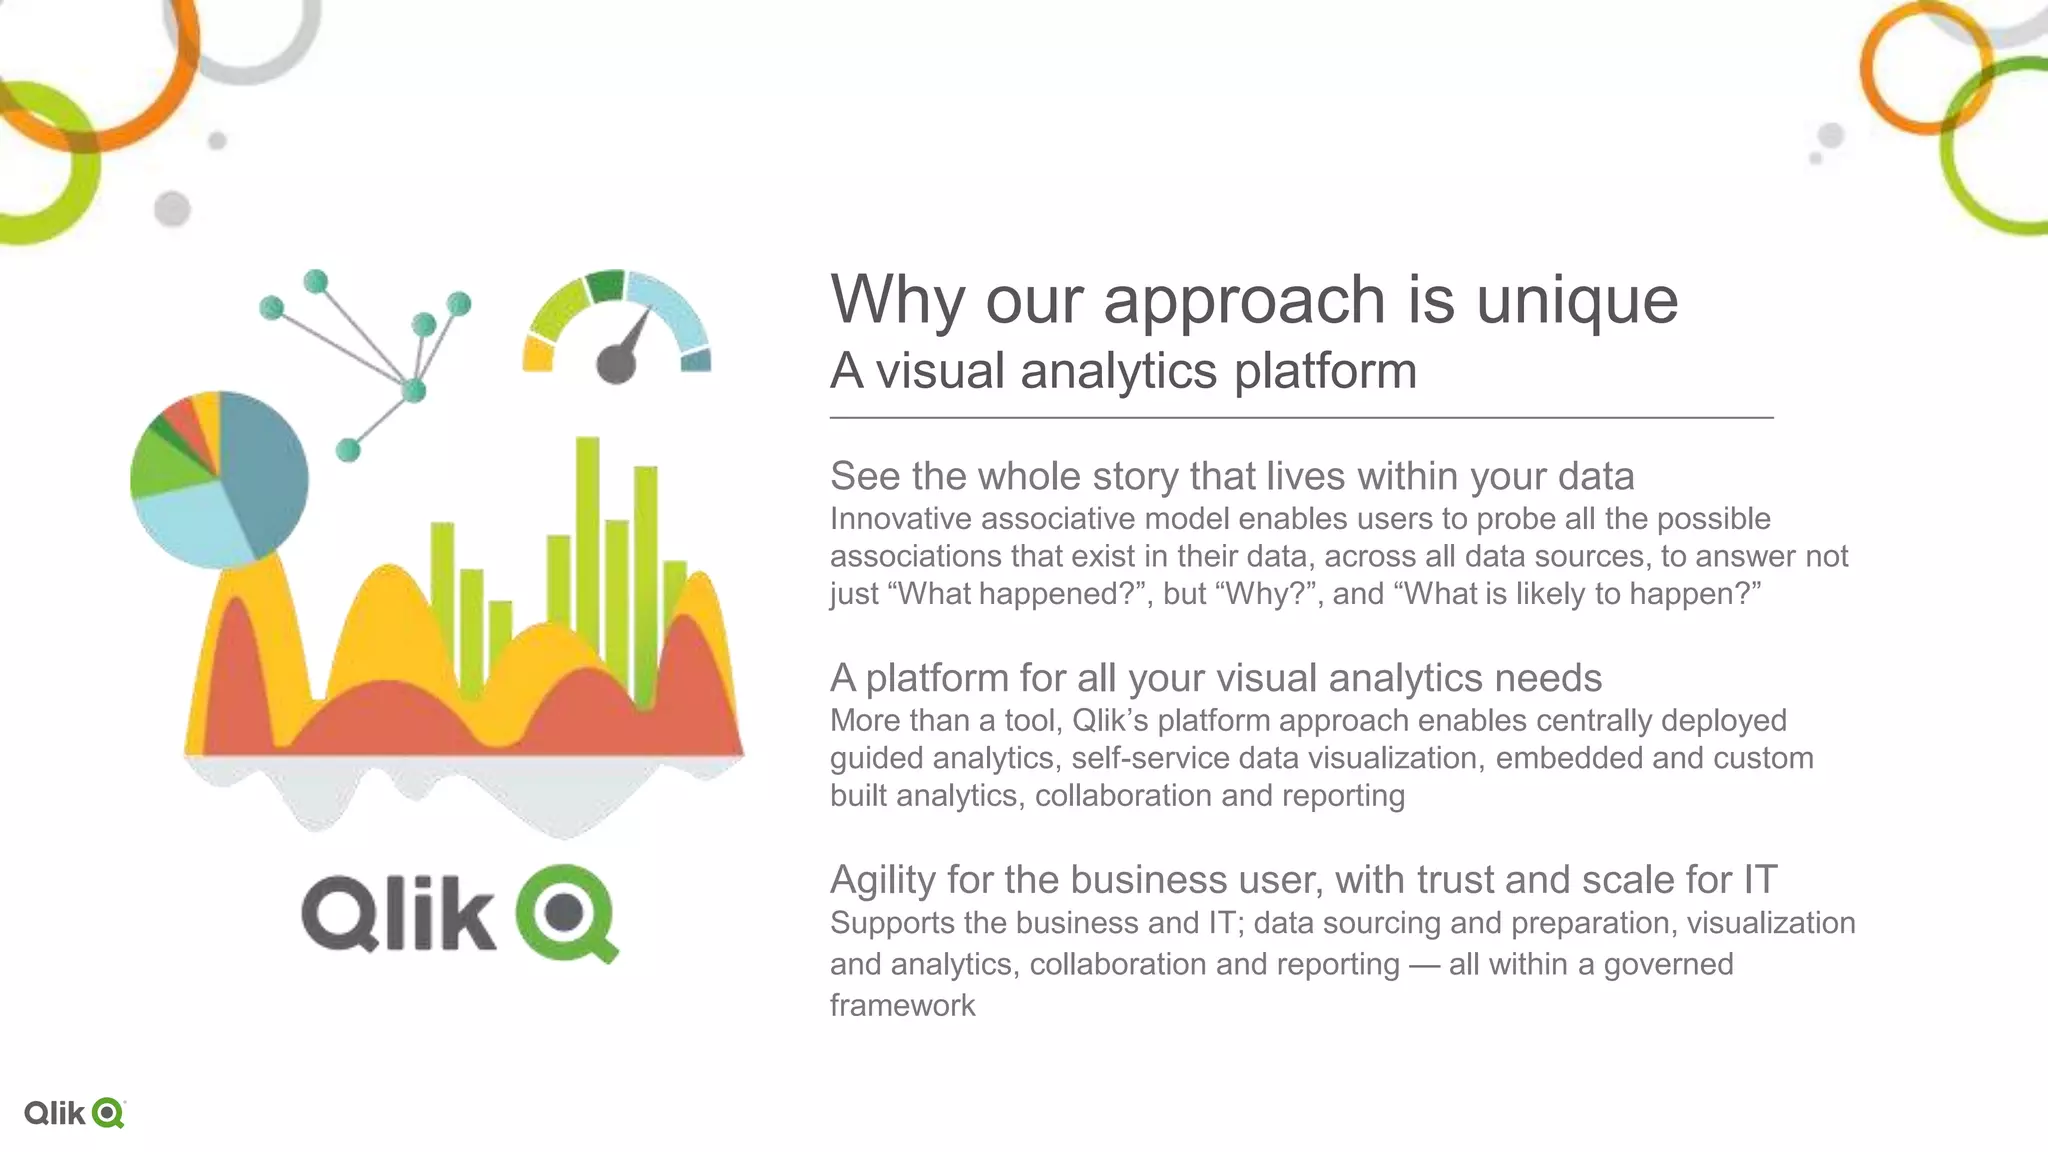
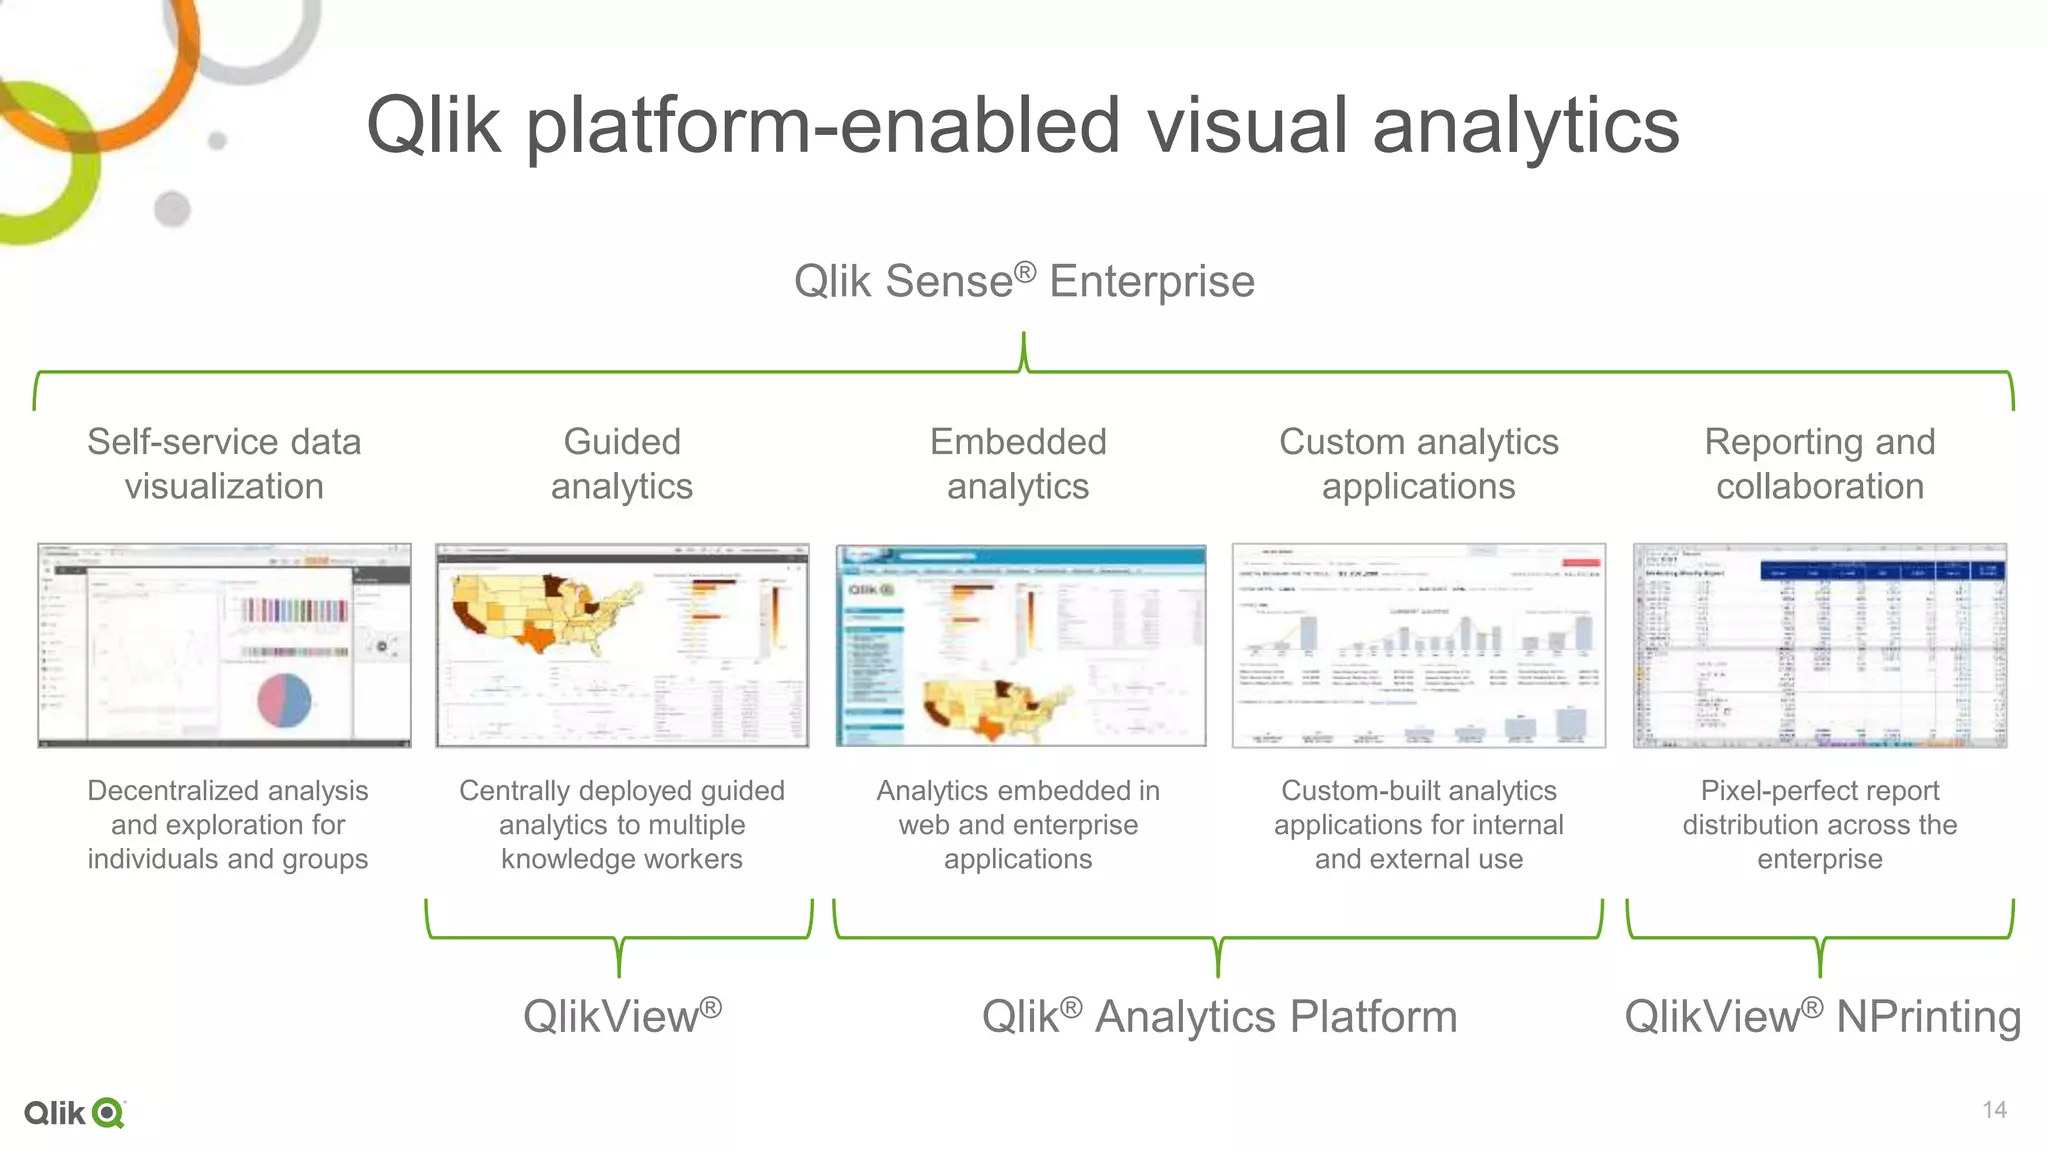
See the whole story
that lives within your data
NASDAQ: QLIK
Founded in Lund,
Sweden in 1993
Headquartered in
Radnor, PA, USA
38,000 customers and
1,700 partners in more
than 100 countries
10 years’ growth outpacing marketMore than 2,000
employees
38,000
1,700
100
38,000 happy customers
Communications,
energy, and
utilities
Manufacturing
and high tech
Financial
services
Healthcare and
life sciences
Retail and
services
Public sector
4
Today’s reality in the digital economy
It’s people who make decisions
It’s people who need to harness the data
Source: “The Digital Universe of Opportunities: Rich Data and the Increasing Value of the Internet of Things” – April 2014
Data is exploding
But data is just a source
5
Change is constant and rapid
Organizations who don’t adapt will die / But business intelligence is too slow
of business managers have
seen their decision window
shrink in the last 12 months
64%
of business professionals need
to make data-driven decisions
within one day
42%
Industry average deployment
Traditional BI: 18 months
18MONTHS
Time to build one report
Traditional BI: 6.3 weeks
6.3WEEKS
Source: “The Digital Universe of Opportunities: Rich Data and the Increasing Value of the Internet of Things” – April 2014
6
There is a broad spectrum of needs and analytics use cases across any
business, all of which are important
storage
automated
pre analysis
reporting
mobility
embedded
analytics
collaboration
and sharing
analytic
apps
high performance
databases
preparation
acquisition
VISUALIZATION
Visualization alone isn’t the answer
Source: “The Digital Universe of Opportunities: Rich Data and the Increasing Value of the Internet of Things” – April 2014
Maximizing analytic value
HIGH
LOW
Analytic
value
BUSINESS USERS DATA SCIENTISTS
Descriptive analytics
Reporting and viz tools
Diagnostic
analytics
Predictive
analytics
(Why did it happen?)
(What is likely
to happen?)
(What happened?)
Maximizing analytic value
HIGH
LOW
Analytic value
BUSINESS USERS
Descriptive, diagnostic and predictive analytics
(“What happened?”, “Why did it happen?” and “What is likely to happen?”
REMOVE GRAY LINEDescriptive, diagnostic, and predictive analytics
(“What happened?”, “Why did it happen?”, and “What is likely to happen?”
See the whole story that lives within your data
Innovative associative model enables users to probe all the possible
associations that exist in their data, across all data sources, to answer not
just “What happened?”, but “Why?”, and “What is likely to happen?”
A platform for all your visual analytics needs
More than a tool, Qlik’s platform approach enables centrally deployed
guided analytics, self-service data visualization, embedded and custom
built analytics, collaboration and reporting
Agility for the business user, with trust and scale for IT
Supports the business and IT; data sourcing and preparation, visualization
and analytics, collaboration and reporting — all within a governed
framework
Why our approach is unique
A visual analytics platform
See the whole story that lives
within your data
Example: Tell us all of the patients who had a hip replacement that cost more than $10,000; the
surgeons that treated those patients that have used different prosthetics for those hip replacements…
versus
Associative visual analyticsLinear data visualization
Result of the partial story: You reduce
the number of operations
Result of the whole story: You increase effectiveness
of procedures to maintain the number of operations
11
What constitutes a modern
analytics platform?
• Data integration and management to enable complex,
scalable analysis
• Data indexing to support freeform exploration and discovery
• Governance and security to protect data integrity
• Library of modern visualizations to visualize data
• Open and standard API access with full capability to extend
and embed
• Toolkits to accelerate and simplify development and creation
• Choice of on- and off-premise deployment models
• Broad ecosystem and community to inspire innovation
Governance is empowerment
Reusability
Security and
control
Manageability Performance and
scale
Multiple data sources
Agility for the business user, with trust and scale for IT
so you leave no data behind
Our modern BI portfolio
Foundation
QIX Associative Engine
EnterpriseCloudDesktop
Value-added
services
Applications
Services Ecosystem
14
Qlik platform-enabled visual analytics
Embedded
analytics
Custom analytics
applications
Self-service data
visualization
Qlik® Analytics Platform
Qlik Sense® Enterprise
Guided
analytics
Reporting and
collaboration
QlikView® NPrinting
Decentralized analysis
and exploration for
individuals and groups
Centrally deployed guided
analytics to multiple
knowledge workers
Analytics embedded in
web and enterprise
applications
Custom-built analytics
applications for internal
and external use
Pixel-perfect report
distribution across the
enterprise
QlikView®
What Qlik
®
delivers to you
See the whole story that lives within your data
• Decide with confidence
• Associative model, all your data
• An analytics platform for everyone
Agility through innovation
• Superior solutions that challenge the norm
• Leadership driven by ongoing innovation
• Accelerating agile, data-driven businesses
Partners in your success
• Industry- and solution-oriented services
• Our community, your success
• Experienced partners, delighted customers
experience it for yourself
Create an app
Qlik.com/download
Share an app
Qlikcloud.com
Try an app
Sense-demo.qlik.com
Test your skills
Qlik.com/us/services/training/skills-assessment
Thank
You
What’s new
39
What’s new @ Qlik®?
This presentation and Qlik‘s strategy and possible future developments are subject to change and may be changed by Qlik at any time for any reason without notice. This document is provided
without a warranty of any kind, either express or implied, including but not limited to, the implied warranties of merchantability, fitness for a particular purpose, or non-infringement.
Qlik Sense®
Enterprise 2.2
Advanced data
preparation
Alternate dimensions and
measures
Powerful new developer
APIs and tools
QlikView®
NPrinting 17
Next-generation reporting
and distribution
“Newsstand” self-service
portal
Enterprise scalability and
security
Qlik Sense Cloud
Plus
Sharing with unlimited
users
Expanded app and
storage sizes
Qlik DataMarket
essentials package
QlikView®
12
Second generation QIX
engine
Enhanced security and
scalability
Mobile touch
improvements
Qlik Sense® Enterprise 2.2
Advanced data preparation
• Automatic data profiling and handling
• Creation of calculated fields in smart load
• A newly redesigned data manager space
Alternate dimensions and measures
• Create visualizations with a number of alternate
dimensions and measures
• Users can “cycle” them using visual exploration
New developer APIs and tools
• New APIs for visualization and integration
• Many new developer capabilities such as an
IDE plugin for Visual Studio
Qlik Sense® Cloud Plus
Unlimited sharing
• Subscribers can share Qlik Sense visualizations with
other free or paid users without limit
Expanded app size and storage
• Max app size doubled to 50MB
• Storage increased to 10GB
Qlik DataMarket upgrade
• Access to Essentials package for
apps created in the cloud
Subscription based
QlikView® 12
Engine and user experience
• Upgraded, modernized QIX engine
• Improved touch interactions on mobile devices
Security and scalability
• Many enhancements to security and encryption
• Improved scalability supporting more nodes in a cluster
Data connectivity
• Native connector for RESTful API web sources
• Support for Qlik DataMarket
QlikView® NPrinting 17
This presentation and Qlik‘s strategy and possible future developments are subject to change and may be changed by Qlik at any time for any reason without notice. This document is provided
without a warranty of any kind, either express or implied, including but not limited to, the implied warranties of merchantability, fitness for a particular purpose, or non-infringement.
Next-generation reporting and distribution
• Office, pixel perfect, and web formats
• Managed report distribution
• New web-based architecture
“Newsstand” self-service portal
• Browse and explore reports, including archived versions
• Subscribe to report distributions in a self-service
manner
Enterprise scalability and security
• Multi-threaded, multi engine scalability
• Enhanced role-based security
Market model
77
Visual analytics market — shift in centricity
Business and personal
External data
Analysis-centric
Analytic platforms
Most “new” data is generated outside
the organization from diverse sources
From system centricity to business
unit and eventually personal centricity
Classic market disruption
Data
Centricity
Analytic
Centricity
Buyer
Centricity
Seller
Centricity
IT
Developer
Data Scientist
Business Analyst
Information Worker Descriptive
Diagnostic
Predictive
Prescriptive
Mainstream shifting from “report-centric
w/ some analysis” to “analysis-centric w/
some reporting”
Volume Velocity Variety
Stack Vendors
Specialist Tools
Analytic Platforms
78
A shift to external data
Data
Centricity
IT
Personal
LoB
CloudOn-premise
• “Half of the organizations access external
data sources”
• Increasingly data is born in the cloud,
especially for mid-market and down
• No clear leader in Cloud BI
─ 7% of total BI market spend
─ 25% of new 2016 spend
─ 40% planning on adopting 2016
• Data connectivity, both on- and off-premise,
key to capture market share
79
A shift to analysis
Analytic
Centricity
Backward
looking
Forward
looking
• “Half of new buying is data discovery-driven”
• Also driven by analytic applications and
embedded analytics
• Reporting is still important, but increasingly a
commodity (and key to stack replacement)
• Significant rise in competition
─ Tableau, Microsoft Power BI, SAP Lumira, Microstrategy
Analytics Desktop, IBM Watson, Domo…
• Battle today is analytics but tomorrow will be
Smart Data Discovery with prediction and
prescription
80
A shift to business driven
Buyer
Centricity
IT
Business
Personal
• “Half of buying will be driven from the
business”
• Central IT to business IT to personal
• Users demand the control of analysis centric
BI: usability, speed, context, time to value
• Critical advantage to those that make the
data supply chain easy to consume
• From traditional BI to big data and visual
analytics
81
A shift to analytic platforms
Seller
Centricity
High Governance Low
LowAgilityHigh
• “Majority of BI vendors made data discovery
their prime BI platform offering.”
• Enterprise IT = low agility but high
governance
• Desktop/small workgroup = high agility but
low integration
• Dominant design will emerge from a business
unit-centric approach providing, agility for the
business but strength and trust for IT
• Enterprise readiness will be key to long-term
success
CSR at Qlik
83
Qlik corporate social responsibility
Change Our World
• Leveraging our people, products, and
culture to make a difference
• Touching a billion lives
84
Change Our World
• Corporate charity partners
─ WeSeeHope
─ Medair
• Support for other charities
─ Local and global
• Software grant program
─ Benefitting more than 200
charities
─ United Nations
─ The Clinton Global Initiative
• Volunteering
• Environment

Qlik-16x9-CorpExecutive-Presentation_Mar2016

  • 1.
    See the wholestory that lives within your data
  • 2.
    NASDAQ: QLIK Founded inLund, Sweden in 1993 Headquartered in Radnor, PA, USA 38,000 customers and 1,700 partners in more than 100 countries 10 years’ growth outpacing marketMore than 2,000 employees 38,000 1,700 100
  • 3.
    38,000 happy customers Communications, energy,and utilities Manufacturing and high tech Financial services Healthcare and life sciences Retail and services Public sector
  • 4.
    4 Today’s reality inthe digital economy It’s people who make decisions It’s people who need to harness the data Source: “The Digital Universe of Opportunities: Rich Data and the Increasing Value of the Internet of Things” – April 2014 Data is exploding But data is just a source
  • 5.
    5 Change is constantand rapid Organizations who don’t adapt will die / But business intelligence is too slow of business managers have seen their decision window shrink in the last 12 months 64% of business professionals need to make data-driven decisions within one day 42% Industry average deployment Traditional BI: 18 months 18MONTHS Time to build one report Traditional BI: 6.3 weeks 6.3WEEKS Source: “The Digital Universe of Opportunities: Rich Data and the Increasing Value of the Internet of Things” – April 2014
  • 6.
    6 There is abroad spectrum of needs and analytics use cases across any business, all of which are important storage automated pre analysis reporting mobility embedded analytics collaboration and sharing analytic apps high performance databases preparation acquisition VISUALIZATION Visualization alone isn’t the answer Source: “The Digital Universe of Opportunities: Rich Data and the Increasing Value of the Internet of Things” – April 2014
  • 7.
    Maximizing analytic value HIGH LOW Analytic value BUSINESSUSERS DATA SCIENTISTS Descriptive analytics Reporting and viz tools Diagnostic analytics Predictive analytics (Why did it happen?) (What is likely to happen?) (What happened?)
  • 8.
    Maximizing analytic value HIGH LOW Analyticvalue BUSINESS USERS Descriptive, diagnostic and predictive analytics (“What happened?”, “Why did it happen?” and “What is likely to happen?” REMOVE GRAY LINEDescriptive, diagnostic, and predictive analytics (“What happened?”, “Why did it happen?”, and “What is likely to happen?”
  • 9.
    See the wholestory that lives within your data Innovative associative model enables users to probe all the possible associations that exist in their data, across all data sources, to answer not just “What happened?”, but “Why?”, and “What is likely to happen?” A platform for all your visual analytics needs More than a tool, Qlik’s platform approach enables centrally deployed guided analytics, self-service data visualization, embedded and custom built analytics, collaboration and reporting Agility for the business user, with trust and scale for IT Supports the business and IT; data sourcing and preparation, visualization and analytics, collaboration and reporting — all within a governed framework Why our approach is unique A visual analytics platform
  • 10.
    See the wholestory that lives within your data Example: Tell us all of the patients who had a hip replacement that cost more than $10,000; the surgeons that treated those patients that have used different prosthetics for those hip replacements… versus Associative visual analyticsLinear data visualization Result of the partial story: You reduce the number of operations Result of the whole story: You increase effectiveness of procedures to maintain the number of operations
  • 11.
    11 What constitutes amodern analytics platform? • Data integration and management to enable complex, scalable analysis • Data indexing to support freeform exploration and discovery • Governance and security to protect data integrity • Library of modern visualizations to visualize data • Open and standard API access with full capability to extend and embed • Toolkits to accelerate and simplify development and creation • Choice of on- and off-premise deployment models • Broad ecosystem and community to inspire innovation
  • 12.
    Governance is empowerment Reusability Securityand control Manageability Performance and scale Multiple data sources Agility for the business user, with trust and scale for IT so you leave no data behind
  • 13.
    Our modern BIportfolio Foundation QIX Associative Engine EnterpriseCloudDesktop Value-added services Applications Services Ecosystem
  • 14.
    14 Qlik platform-enabled visualanalytics Embedded analytics Custom analytics applications Self-service data visualization Qlik® Analytics Platform Qlik Sense® Enterprise Guided analytics Reporting and collaboration QlikView® NPrinting Decentralized analysis and exploration for individuals and groups Centrally deployed guided analytics to multiple knowledge workers Analytics embedded in web and enterprise applications Custom-built analytics applications for internal and external use Pixel-perfect report distribution across the enterprise QlikView®
  • 15.
    What Qlik ® delivers toyou See the whole story that lives within your data • Decide with confidence • Associative model, all your data • An analytics platform for everyone Agility through innovation • Superior solutions that challenge the norm • Leadership driven by ongoing innovation • Accelerating agile, data-driven businesses Partners in your success • Industry- and solution-oriented services • Our community, your success • Experienced partners, delighted customers
  • 16.
    experience it foryourself Create an app Qlik.com/download Share an app Qlikcloud.com Try an app Sense-demo.qlik.com Test your skills Qlik.com/us/services/training/skills-assessment
  • 17.
  • 18.
  • 19.
    39 What’s new @Qlik®? This presentation and Qlik‘s strategy and possible future developments are subject to change and may be changed by Qlik at any time for any reason without notice. This document is provided without a warranty of any kind, either express or implied, including but not limited to, the implied warranties of merchantability, fitness for a particular purpose, or non-infringement. Qlik Sense® Enterprise 2.2 Advanced data preparation Alternate dimensions and measures Powerful new developer APIs and tools QlikView® NPrinting 17 Next-generation reporting and distribution “Newsstand” self-service portal Enterprise scalability and security Qlik Sense Cloud Plus Sharing with unlimited users Expanded app and storage sizes Qlik DataMarket essentials package QlikView® 12 Second generation QIX engine Enhanced security and scalability Mobile touch improvements
  • 20.
    Qlik Sense® Enterprise2.2 Advanced data preparation • Automatic data profiling and handling • Creation of calculated fields in smart load • A newly redesigned data manager space Alternate dimensions and measures • Create visualizations with a number of alternate dimensions and measures • Users can “cycle” them using visual exploration New developer APIs and tools • New APIs for visualization and integration • Many new developer capabilities such as an IDE plugin for Visual Studio
  • 21.
    Qlik Sense® CloudPlus Unlimited sharing • Subscribers can share Qlik Sense visualizations with other free or paid users without limit Expanded app size and storage • Max app size doubled to 50MB • Storage increased to 10GB Qlik DataMarket upgrade • Access to Essentials package for apps created in the cloud Subscription based
  • 22.
    QlikView® 12 Engine anduser experience • Upgraded, modernized QIX engine • Improved touch interactions on mobile devices Security and scalability • Many enhancements to security and encryption • Improved scalability supporting more nodes in a cluster Data connectivity • Native connector for RESTful API web sources • Support for Qlik DataMarket
  • 23.
    QlikView® NPrinting 17 Thispresentation and Qlik‘s strategy and possible future developments are subject to change and may be changed by Qlik at any time for any reason without notice. This document is provided without a warranty of any kind, either express or implied, including but not limited to, the implied warranties of merchantability, fitness for a particular purpose, or non-infringement. Next-generation reporting and distribution • Office, pixel perfect, and web formats • Managed report distribution • New web-based architecture “Newsstand” self-service portal • Browse and explore reports, including archived versions • Subscribe to report distributions in a self-service manner Enterprise scalability and security • Multi-threaded, multi engine scalability • Enhanced role-based security
  • 24.
  • 25.
    77 Visual analytics market— shift in centricity Business and personal External data Analysis-centric Analytic platforms Most “new” data is generated outside the organization from diverse sources From system centricity to business unit and eventually personal centricity Classic market disruption Data Centricity Analytic Centricity Buyer Centricity Seller Centricity IT Developer Data Scientist Business Analyst Information Worker Descriptive Diagnostic Predictive Prescriptive Mainstream shifting from “report-centric w/ some analysis” to “analysis-centric w/ some reporting” Volume Velocity Variety Stack Vendors Specialist Tools Analytic Platforms
  • 26.
    78 A shift toexternal data Data Centricity IT Personal LoB CloudOn-premise • “Half of the organizations access external data sources” • Increasingly data is born in the cloud, especially for mid-market and down • No clear leader in Cloud BI ─ 7% of total BI market spend ─ 25% of new 2016 spend ─ 40% planning on adopting 2016 • Data connectivity, both on- and off-premise, key to capture market share
  • 27.
    79 A shift toanalysis Analytic Centricity Backward looking Forward looking • “Half of new buying is data discovery-driven” • Also driven by analytic applications and embedded analytics • Reporting is still important, but increasingly a commodity (and key to stack replacement) • Significant rise in competition ─ Tableau, Microsoft Power BI, SAP Lumira, Microstrategy Analytics Desktop, IBM Watson, Domo… • Battle today is analytics but tomorrow will be Smart Data Discovery with prediction and prescription
  • 28.
    80 A shift tobusiness driven Buyer Centricity IT Business Personal • “Half of buying will be driven from the business” • Central IT to business IT to personal • Users demand the control of analysis centric BI: usability, speed, context, time to value • Critical advantage to those that make the data supply chain easy to consume • From traditional BI to big data and visual analytics
  • 29.
    81 A shift toanalytic platforms Seller Centricity High Governance Low LowAgilityHigh • “Majority of BI vendors made data discovery their prime BI platform offering.” • Enterprise IT = low agility but high governance • Desktop/small workgroup = high agility but low integration • Dominant design will emerge from a business unit-centric approach providing, agility for the business but strength and trust for IT • Enterprise readiness will be key to long-term success
  • 30.
  • 31.
    83 Qlik corporate socialresponsibility Change Our World • Leveraging our people, products, and culture to make a difference • Touching a billion lives
  • 32.
    84 Change Our World •Corporate charity partners ─ WeSeeHope ─ Medair • Support for other charities ─ Local and global • Software grant program ─ Benefitting more than 200 charities ─ United Nations ─ The Clinton Global Initiative • Volunteering • Environment