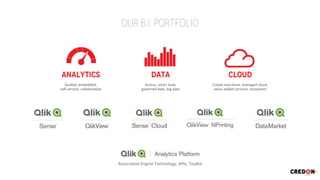
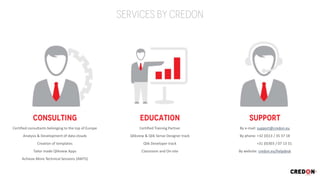
This document discusses data analytics and the value of associative data. It summarizes that while data is growing exponentially, the value comes from making connections between different data sources. It promotes an associative engine technology that allows users to explore data freely and dynamically understand how all data relates, providing a more complete picture. This approach increases effectiveness over only looking at partial views that consider predefined relationships. The document then discusses Credon, a company that provides data analytics platforms and services to help customers achieve more with their data.
QlikView is considered to be the most flexible business intelligence platforms for data visualization that business analysts and business intelligence (BI) developers can use to create advanced BI apps. It is not only fast to deploy and easy to learn, but also improves data vizualization practices. Several companies across the globe today like banking conglomerate, e-commerce, consulting or manufacturing companies have been using Qlikview and benefiting from it. It is a single application platform for all BI needs which is helping companies across the globe with unprecedented business insights.
QlikView Tutorial For Beginners | What Is QlikView | Qlikview Tutorial | Qlik...Edureka!
This tutorial gives you an introduction to QlikView & how is it used for data discovery and data visualization. You will also learn briefly about Business Intelligence and understand Qlikview with a demonstration.
New Dynamics 365 Implementation Guide - Available for downloadDynamics Square
Almost 700 pages of insights and guidance around strategy, initiation, implementation, preparation and operation, Contact us for Dynamics 365 Implementation: https://www.dynamicssquare.com.au/dynamics-365/
The cloud is all the rage. Does it live up to its hype? What are the benefits of the cloud? Join me as I discuss the reasons so many companies are moving to the cloud and demo how to get up and running with a VM (IaaS) and a database (PaaS) in Azure. See why the ability to scale easily, the quickness that you can create a VM, and the built-in redundancy are just some of the reasons that moving to the cloud a “no brainer”. And if you have an on-prem datacenter, learn how to get out of the air-conditioning business!
Introduction to Power BI to make smart decisionsVIVEK GURURANI
Power BI: Business intelligence like never before!
Power BI is a tool that allows accounting and finance managers and professionals to have relevant information at the right time to make strategic decisions in a flexible, centralized, and secure way. Transform your business with predictive analytics, data visualization, and information in real-time, thanks to Power BI.
Presentation Agenda:
1. Introduction to Power BI
2. Why would your business need Power BI?
3. Power BI Architecture
4. Data Sanitization & Cleansing Capabilities
5. Analytical Insights
6. Generating Department Wise Reports & Visualizations
7. Latest & Upcoming Power BI features
8. Live Q&A
The migration of legacy applications and databases to the cloud is always a challenging activity. However, with the right strategy and meticulous execution, workload migration can be made seamless.
At CCS Technologies, we manage all technical, service, and commercial aspects of migrating your legacy systems to the cloud. Our team of experts offers guidance on suitable migration strategies for moving data and applications from on-premise to the cloud, or for moving from one cloud service provider to another. We take care of every aspect of migration and leave you with a hassle-free optimized setup on the cloud with zero downtime.
Know more: https://ccs-technologies.com/infra-cloud-services/#ics_cs
Webinar: Implementation of 10 Integration Patterns on iPaaS PlatformAPPSeCONNECT
We recently had a #Webinar on Integration Patterns for iPaaS Platform. The key points discussed over the webinar were:
1. Understanding the best practices that should be followed to correctly utilize an iPaaS platform.
2. Some of the best use cases of the iPaaS platform.
3. A walkthrough of APPSeCONNECT Integration Platform to feature the scenarios of an iPaaS platform.
#iPaaS #IntegrationPlatform
Integrate your business applications under one single platform: https://www.appseconnect.com/integrations/
Qlik Sense for Beginners - www.techstuffy.com - QlikView Next GenerationPractical QlikView
Learn Qlik Sense Desktop the Easy and Fast way with Qlik Sense for Beginners (QS4B) - Sample
If you'd like to analyse your data so you can make informed decisions that help you reach your goals read on.
Qlik Sense can be used for all sorts of goals. For example in business that goal might be to make more profit, whereas for the personal user that goal might be to find where they are spending all their money.
Qlik Sense for Beginners (QS4B) will :
· Teach you how to create Qlik Sense apps from scratch in easy to understand steps with plenty of screenshots.
· Explain how to get data into a Qlik Sense apps from a variety of sources such as Excel, text files, access and sql databases.
· Show you how to create various charts and tables Qlik Sense for example bar, gauges,line,combo,treemaps and scatter plots.
· How to manage the Qlik Sense data model using joins, grouping, inline tables, link tables and dimensions.
Once you have mastered the basics some of the other topics we will cover are:
· Development Tips - Migrating from QlikView to Qlik Sense User.
· Development Techniques - subroutines and external scripts, crosstables.
· Advanced Functions such as Class, Intervalmatch, Dual and more.
· Set analysis
· QVDs and incremental loads
· Bookmarks
· Storytelling feature
· Qlik Sense Extensions
And much more...
Qlik Sense Desktop is a FREE product.
Examples are using Qlik Sense Desktop version 0.96
Qlik Sense Desktop has recently been release.
Buy with confidence on the Kindle knowing that you will get UPDATES to the book automatically.
Other books:
Practical QlikView
Practical QlikView 2 - Beyond Basic QlikView
Practical Sql: Microsoft Sql Server T-SQL for Beginners
https://www.youtube.com/user/practicalqlik
https://twitter.com/practicalqlik
http://www.techstuffy.com
Retail Analytics and BI with Looker, BigQuery, GCP & Leigha JarettDaniel Zivkovic
Leigha Jarett of GCP explains how to bring Cloud "superpowers" to your Data and modernize your Business Intelligence with Looker, BigQuery and Google Cloud services on an example of Cymbal Direct - one of Google Cloud's demo brands. The meetup recording with TOC for easy navigation is at https://youtu.be/BpzJU_S40ic.
P.S. For more interactive lectures like this, go to http://youtube.serverlesstoronto.org/ or sign up for our upcoming live events at https://www.meetup.com/Serverless-Toronto/events/
This presentation is for those of you who are interested in moving your on-prem SQL Server databases and servers to Azure virtual machines (VM’s) in the cloud so you can take advantage of all the benefits of being in the cloud. This is commonly referred to as a “lift and shift” as part of an Infrastructure-as-a-service (IaaS) solution. I will discuss the various Azure VM sizes and options, migration strategies, storage options, high availability (HA) and disaster recovery (DR) solutions, and best practices.
This presentation is row of demos that introduce how to use Application Insights, how it works and how to build your own application telemetry on top of it. Two surprise demos show audience some case studies how to use Application Insights to plan hosting of global web site and how to support sales and logistics departments in real-time.
There are options beyond a straight forward lift and shift into Azure IaaS. What are your options? Learn how Azure helps modernize applications faster with containers and how you can use serverless to add additional functionality while keeping your production codebase 'clean'. We'll also learn how to incorporate DevOps throughout your apps lifecycle and take advantage of data-driven intelligence. Demo intensive session integrating the likes of Service Fabric, AKS VSTS and more.
Customer migration to azure sql database from on-premises SQL, for a SaaS app...George Walters
Why would someone take a working on-premises SaaS infrastructure, and migrate it to Azure? We review the technology decisions behind this conversion, and business choices behind migrating to Azure. The SQL 2012 infrastructure and application was migrated to PaaS Services. Finally, how would we do this architecture in 2019.
Introduction to Oracle Cloud Infrastructure ServicesKnoldus Inc.
Oracle Cloud Infrastructure is a set of complementary cloud services that enable you to build and run a wide range of applications and services in a highly available hosted environment. Oracle Cloud Infrastructure (OCI) offers high-performance compute capabilities (as physical hardware instances) and storage capacity in a flexible overlay virtual network that is securely accessible from your on-premises network.
Vuoden toinen tapahtuma sarjassa Business Insight pidettiin 17.3.2016. Jyri Peltoniemi, Lead Enterprise Architect (Finance development), Tieto Oyj aloitti puheenvuorollaan Event Driven Business Planning. Miten suunnitella konkreettiset liiketoiminnan toimenpiteet, joilla päästään strategiassa asetettuun tavoitetilaan? Kuule miten Tieto teki kolmivuotissuunnitelman, jossa jokaisen suunnitellun toimenpiteen vaikutus mallinnetaan ja arvioidaan ennen suunnitelmaan mukaan ottamista. Adaptiven joustavuus tuki mallin kehitystä ja helppokäyttöisyys loppukäyttöä.
Vuoden kolmannessa Business Insight –tapahtumasarjan tapahtumassamme rantauduimme Pohjanmaalle ja annoimme esimerkkejä ja vinkkejä siitä, miten sekä isot että pienemmät organisaatiot johtavat parhaiten hallitulla tiedolla hyödyntäen viimeisintä teknologiaa.
Modern analytics platform, designed to perform multidimensional analysis. These include Business Intelligence solutions, allowing you to make quick and accurate decisions.
Stand out by collaborative, advanced visualization, integration of data from multiple sources, as well as the option of using mobile devices. Simple and intuitive operation allows the end user to create their own ad-hoc analysis based on real data.
BPX group is an authorized partner of QlikTech – one of the leading business intelligence solutions. We have the QlikView Solution Provider and OEM status.
Case Tamro: Pilvipohjaisella järjestelmällä tarkkuutta ja nopeutta talouden s...eCraft Referre
Torstaina 25.8.2016 Business Insight -tapahtumasarja jatkui Adaptive Insights -tapahtumalla Hotel Kämpissä. Varsinaisen ohjelman jälkeen tilaisuus jatkui vielä vilkkaalla pyöreän pöydän keskustelulla. Henri Yli-Ristaniemi (Head of Reporting and Financial Controlling) kertoi miten Tamrolla on saatu pilvipohjaisella järjestelmällä tarkkuutta ja nopeutta talouden suunnitteluun. Yli-Ristaniemi kehui käyttöönottoprojektia, joka mahdollisti että parissa kuukaudessa oli käyttövalmis järjestelmä, ja oli yllättynyt siitä että se oli järjestelmäprojekti joka pysyi budjettiraamien sisällä ajallisesti ja taloudellisesti!
Customer case Kiinteistömaailma: Tiedolla johtamineneCraft Referre
Esitys eCraft Referren järjestämässä Business Insight -tapahtumasarjassa. Kiinteistömaailman toimitusjohtaja Erkki Heikkinen ja talousjohtaja Marina Salenius keskustelevat ketjuliiketoiminnan johtamisen haasteista ja ratkaisuista Kiinteistömaailma-ketjussa. Keskustelussa käydään myös läpi, miten niitä on onnistuttu QlikViewn kanssa muuttamaan ja mitä hyötyjä on saavutettu.
Torstaina 25.8.2016 Business Insight -tapahtumasarja jatkui Adaptive Insights -tapahtumalla Hotel Kämpissä. Varsinaisen ohjelman jälkeen tilaisuus jatkui vielä vilkkaalla pyöreän pöydän keskustelulla, jossa osallistujat pääsivät juttelemaan konsulttien ja muiden käyttäjien kanssa.
eCraft Referren Business Insight konsultti Otto Hintikka näytti live demon ratkaisusta.
Esitys eCraft Referren järjestämässä Business Insight -tapahtumasarjassa. Palveluliiketoiminnan yleiset haasteet raportoinnin ja johtamisen näkökulmasta, Jari Laakkonen, Managing Partner ja Rami Jahkonen, Partner, eCraft Referre. Mistä johtamisessa on kyse ja miten se pitäisi nivoutua mukaan raportointiin? Minkälaisiin ongelmiin tyypillisesti on törmätty ja miten niitä on onnistuttu ratkaisemaan? Esimerkein ja keskustellen läpi kokemuksiamme eri asiakkaissa.
Adaptive Insights - Liiketoiminnan suunnittelu pilvestäeCraft Referre
Vuoden toinen osa tapahtumasarjassa Business Insight pidettiin 17.3.2016. Tapahtuman avauksessa eCraft Referren Partner Rami Jahkonen kertoi tuoreimmat kuulumiset ja avasi näkemystään hallitusta tiedolla johtamisesta ja sen edellytyksistä.
The future and trends in corporate performance managementeCraft Referre
The second part of the program series Business Insight was held 17.3.2016. Robert S. Hull, Founder and Chairman of Adaptive Insights, started by sharing his view on the future and trends in corporate performance management.
Vuoden kolmas tapahtuma sarjassa Business Insight pidettiin 26.5.2016. Pasi Niskanen (Consulting Manager, QlikTech Finland) piti puheenvuoron aiheesta Suurten Qlik ympäristöjen hallinta. Agendalla oli Käyttäjä- ja lisenssinhallinta, applikaatioiden käyttö, palvelimen resurssit, valvontatyökalut sekä isojen ympäristöjen kehitys ja tuotannointi.
The QlikView Business Discovery platform bridges the gap between traditional business intelligence (BI) solutions and standalone office productivity applications, enabling users to forge new paths and make new discoveries. QlikView works with what you already have and infuses a broad set of new capabilities into BI. It brings a whole new level of analysis, insight, and value to existing data stores with user interfaces that are clean, simple, and straightforward.
Liiketoimintalähtöinen suunnittelu konsernissaeCraft Referre
Vuoden toinen tapahtuma sarjassa Business Insight pidettiin 17.3.2016. Tomi Koistinen, Head of Business Controlling, Snellman Group lopetti puheenvuorolla Liiketoimintalähtöinen suunnittelu konsernissa.
Miten tehdä myynnin suunnittelu mahdollisimman helpoksi ja yhdenmukaiseksi konsernitason mallissa? Kuule miten Snellman mallinsi eritasoiset hinnoittelumallit ja tuotteiden reseptien kautta saatavat standardikustannukset mahdollisimman automatisoiduksi työkaluksi myynnin suunnitteluun. Miten myyntisuunnitelma jalostetaan edelleen tuotantoennusteen pohjaksi tarkemman viikkotason suunnittelun kampanjasuunnittelun avulla.
This presentation reviews Qlik and Tableau capabilities. It provides a summary of what the business intelligence experts say about each products pros and cons. It touches the surface on what each company provides and how much each product may cost.
Vuoden kolmas tapahtuma sarjassa Business Insight pidettiin 26.5.2016. Agendalla oli Business Intelligense ja Tiedolla johtaminen Enterprise -ympäristöissä. Miten tuetaan kaikkien yksittäisten käyttäjien tarpeita tehdä parempia päätöksiä, nojautuen yhteiseen ja hallittuun tiedolla johtamisen ratkaisuun?
Torstaina 25.8.2016 Business Insight -tapahtumasarja jatkui Adaptive Insights -tapahtumalla Hotel Kämpissä. Varsinaisen ohjelman jälkeen tilaisuus jatkui vielä vilkkaalla pyöreän pöydän keskustelulla. eCraft Referren Manager Mikko Kupiainen aloitti päivän kertomalla liiketoiminnan suunnittelujärjestelmien markkinasta ja trendeistä 2016.
See the Whole Story: The Case for a Visualization PlatformEric Kavanagh
Seeing is believing, which is why data visualization continues to play a major role in helping businesses understand their data. But there's more than meets the eye. Underneath that stimulating surface layer, some data environments are much more organized -- and thus reliable -- than others. The key to success? Taking a platform approach to address the entire end-to-end process of delivering governed, scalable analytics.
Register for this episode of The Briefing Room to hear veteran Analyst Dr. Robin Bloor explain why a platform approach to visual analytics enables the kind of governance that today's organizations need. He'll be briefed by Dan Brault of Qlik, who will showcase his company's analytics platform which was built from the ground up with the design point of delivering analytics to everyone in an organization. He'll stress the importance of governance, trust and scalability.
Benchmarking Digital Readiness: Moving at the Speed of the MarketApigee | Google Cloud
Moving at the new speed of the market: benchmarking your digital readiness with real-world data
Companies are under pressure to move at the speed of digital natives. Benchmark your organization against empirical data and real-world case studies to see where you stand and what you can do to jumpstart your digital readiness.
Digital Transformation and Innovation on http://denreymer.com
- Merging the Real World and the Virtual World
- Intelligence Everywhere
- The New IT Reality Emerges
http://www.gartner.com//it/content/2940400/2940420/january_15_top_10_technology_trends_2015_dcearley.pdf
Markus Stückler (Hewlett Packard Enterprise)Praxistage
Herausforderungen auf dem Weg der Digitalen Transformation. Beispiele und Lösungsansätze aus den Bereichen Cloud, Big Data und Mobilität. - Markus Stückler (Hewlett Packard Enterprise)
Digitalization: A Challenge and An Opportunity for BanksJérôme Kehrli
Today’s banking industry era is strongly defined by a word - digital. The urgency to act is only getting severe each day. Banks using digital technologies to automate processes, improve regulatory compliance, and transform the customer experience may realize a profit upside of 40% or more, while laggards that resist digital innovation will be punished by customers, financial markets, regulators, and may see up to 35% of net profit eroded, according to a McKinsey analysis.
The vital question to answer is, do we get digitalization right? Why is it getting extremely urgent to digitize?
Once you’ve made the decision to leverage AI and/or machine learning, now you need to figure out how you will source the training data that is necessary for a fully functioning algorithm. Depending on your use case, you might need a significant amount of training data, and you’ll want to consider how that is labeled and annotated too.
View Applause's webinar with Cognilytica principal analysts Ronald Schmelzer and Kathleen Walch, alongside Kristin Simonini, Applause’s Vice President of Product, as they tackle the modern challenges that today’s companies face with sourcing training data.
Unleash the power of your data and gain instant insights without additional investments in IT infrastructure. We review the state of data analytics, discuss the differences in long-term, medium-term and (near) real-time data and how companies can leverage it with PowerBI.
What is an ITaaS catalog and why is it a necessity?Gravitant, Inc.
Creating a service catalog is a critical first step in delivering cloud services and enabling users to order and consume IT services directly. Though a service catalog appears as a list of services to the users, to IT it represents a supply chain of services across various service types, levels, and providers. Organizations must consider a catalog solution that can be flexible to the needs of the business and grow with IT as they adapt to the cloud era.
Join Gravitant as they outline characteristics and considerations for developing a service catalog. We will walk through what you need to consider when looking for a service catalog solution: automation, flexibility, contract pricing and dynamic catalog options.
Falcon stands out as a top-tier P2P Invoice Discounting platform in India, bridging esteemed blue-chip companies and eager investors. Our goal is to transform the investment landscape in India by establishing a comprehensive destination for borrowers and investors with diverse profiles and needs, all while minimizing risk. What sets Falcon apart is the elimination of intermediaries such as commercial banks and depository institutions, allowing investors to enjoy higher yields.
Putting the SPARK into Virtual Training.pptxCynthia Clay
This 60-minute webinar, sponsored by Adobe, was delivered for the Training Mag Network. It explored the five elements of SPARK: Storytelling, Purpose, Action, Relationships, and Kudos. Knowing how to tell a well-structured story is key to building long-term memory. Stating a clear purpose that doesn't take away from the discovery learning process is critical. Ensuring that people move from theory to practical application is imperative. Creating strong social learning is the key to commitment and engagement. Validating and affirming participants' comments is the way to create a positive learning environment.
LA HUG - Video Testimonials with Chynna Morgan - June 2024Lital Barkan
Have you ever heard that user-generated content or video testimonials can take your brand to the next level? We will explore how you can effectively use video testimonials to leverage and boost your sales, content strategy, and increase your CRM data.🤯
We will dig deeper into:
1. How to capture video testimonials that convert from your audience 🎥
2. How to leverage your testimonials to boost your sales 💲
3. How you can capture more CRM data to understand your audience better through video testimonials. 📊
Digital Transformation and IT Strategy Toolkit and TemplatesAurelien Domont, MBA
This Digital Transformation and IT Strategy Toolkit was created by ex-McKinsey, Deloitte and BCG Management Consultants, after more than 5,000 hours of work. It is considered the world's best & most comprehensive Digital Transformation and IT Strategy Toolkit. It includes all the Frameworks, Best Practices & Templates required to successfully undertake the Digital Transformation of your organization and define a robust IT Strategy.
Editable Toolkit to help you reuse our content: 700 Powerpoint slides | 35 Excel sheets | 84 minutes of Video training
This PowerPoint presentation is only a small preview of our Toolkits. For more details, visit www.domontconsulting.com
The world of search engine optimization (SEO) is buzzing with discussions after Google confirmed that around 2,500 leaked internal documents related to its Search feature are indeed authentic. The revelation has sparked significant concerns within the SEO community. The leaked documents were initially reported by SEO experts Rand Fishkin and Mike King, igniting widespread analysis and discourse. For More Info:- https://news.arihantwebtech.com/search-disrupted-googles-leaked-documents-rock-the-seo-world/
Unveiling the Secrets How Does Generative AI Work.pdfSam H
At its core, generative artificial intelligence relies on the concept of generative models, which serve as engines that churn out entirely new data resembling their training data. It is like a sculptor who has studied so many forms found in nature and then uses this knowledge to create sculptures from his imagination that have never been seen before anywhere else. If taken to cyberspace, gans work almost the same way.
Personal Brand Statement:
As an Army veteran dedicated to lifelong learning, I bring a disciplined, strategic mindset to my pursuits. I am constantly expanding my knowledge to innovate and lead effectively. My journey is driven by a commitment to excellence, and to make a meaningful impact in the world.
Implicitly or explicitly all competing businesses employ a strategy to select a mix
of marketing resources. Formulating such competitive strategies fundamentally
involves recognizing relationships between elements of the marketing mix (e.g.,
price and product quality), as well as assessing competitive and market conditions
(i.e., industry structure in the language of economics).
What are the main advantages of using HR recruiter services.pdfHumanResourceDimensi1
HR recruiter services offer top talents to companies according to their specific needs. They handle all recruitment tasks from job posting to onboarding and help companies concentrate on their business growth. With their expertise and years of experience, they streamline the hiring process and save time and resources for the company.
8. Source: “The digital universe of opportunities: Rich data and the increasing value of the internet of things” – April 2014
Data is exploding
But data is just a source
9. Source: “The digital universe of opportunities: Rich data and the increasing value of the internet of things” – April 2014
10. Source: “The digital universe of opportunities: Rich data and the increasing value of the internet of things” – April 2014
11. See the whole story A platform for all your visual analytical needs Agility for the business user,
with trust and scale for IT
12.
13. • Pre-defined joins
• Pre-aggregated hierarchies
• Pre-conceived notions of how data should be related
• Only part of the story
• Dynamic associations
• Explore freely in any direction
• Understand how data is actually related
• The whole story
14. Result of the partial story: You reduce
the number of operations
Result of the whole story: You increase effectiveness
of procedures to maintain the number of operations
Find all of the patients who had a hip replacement that cost more than $10,000; Sort by the surgeons that treated those
patients that have used different prosthetics for those hip replacements.
Patients
Patient ID
Hospital Bill
Payment History
Patients
Prosthetics
Hip Replacements
Surgeons
$10k
15. Create and share, managed cloud,
value-added services, ecosystem
Guided, embedded,
self-service, collaborative
Access, smart load,
governed data, big data
Associative Engine Technology, APIs, Toolkit
18. Certified consultants belonging to the top of Europe
Analysis & Development of data-clouds
Creation of templates
Tailor made Qlikview Apps
Achieve More Technical Sessions (AMTS)
Certified Training Partner
Qlikview & Qlik Sense Designer track
Qlik Developer track
Classroom and On-site
By e-mail: support@credon.eu
By phone: +32 (0)13 / 35 37 18
By phone: +31 (0)303 / 07 13 31
By website: credon.eu/helpdesk
First let me start by telling you a little about Qlik…
Founded in Lund, Sweden and now headquartered in Radnor, PA, USA we now support over 36,000 customers, work with 1700 plus partners across more than 100 countries. We have over 2,000 employees.
Perhaps more critical is Qlik place in the market. Today Qlik is the largest Data Discovery and Visual Analytics vendor in the market, and in 2014 our revenue exceeded $556m. Our growth, over the last 10 years, 37% CAGR, exceeds that of the overall BI market, which is growing at roughly 8-9% per year. This essentially means Qlik is taking market share from the rest of the market and we are doing this by continuing to invest and innovate, and continuing to disrupt the market. Qlik Sense, and our unique ability to let our customers see the whole story that lies within their data is today at the heart of that growth strategy.
In this keynote I want to explain how…
Before I get into the detail on our solutions its first important to show why we are making this investment. Quite simply Qlik believes in putting its customers first and that is why we focus on supporting customers of all sizes, in all locations and across all industries. For example:
• 10 of the top 10 Pharmaceutical companies are Qlik customers, as well as 44 of the Top 50
• 7 of the top 10 Retail and Wholesale companies are Qlik customers, including 4 of the Top 5
• 7 of the top 10 Securities and Investment companies are Qlik customers, as well as 40 of the Top 50
• 7 of the top 10 Manufacturing companies are Qlik customers
• 6 of the top 10 U.S. Hospitals are Qlik customers
• 9 of the top 10 Banks are Qlik customers, as well as 40 of the top 50
• 8 of the top 10 Insurers are Qlik customers, as well as 32 of the top 50
We are focused on delivering first class products and a first class service to our customers and this is why we have one highest net promotor scores of all vendors in our market and lead in many of the major analyst reports including:
Gartner
Leader in the MQ for BI
Over 60% of the customers surveyed pointed to Qlik as their BI standard, across the enterprise
BARC (Business Application Research Center)
Ranked #1 in Performance and Product satisfaction, leading to our #1 position in overall Customer Satisfaction.
Also ranked #1 in Visual Discovery, demonstrating our simple and intuitive approach to visual analytics.
First let me start by telling you a little about Qlik…
Founded in Lund, Sweden and now headquartered in Radnor, PA, USA we now support over 36,000 customers, work with 1700 plus partners across more than 100 countries. We have over 2,000 employees.
Perhaps more critical is Qlik place in the market. Today Qlik is the largest Data Discovery and Visual Analytics vendor in the market, and in 2014 our revenue exceeded $556m. Our growth, over the last 10 years, 37% CAGR, exceeds that of the overall BI market, which is growing at roughly 8-9% per year. This essentially means Qlik is taking market share from the rest of the market and we are doing this by continuing to invest and innovate, and continuing to disrupt the market. Qlik Sense, and our unique ability to let our customers see the whole story that lies within their data is today at the heart of that growth strategy.
In this keynote I want to explain how…
One cannot deny that in today’s world, data will be at the core of informed decision-making.
Data is exploding around us, from multiple sources, in multiple formats, in multiple locations (on and off premise)
This is fueling a fundamental shift in the application paradigm
From Big App, small data
To small app, Big Data as the core paradigm
Why?
If data is the key to informed decision-making, and people make decisions on a routine basis while operating within applications, then applications themselves must become data-centric.
Analytics will be built into almost every application we use in the future.
But lets not forget, data is just a source, its people who make decisions, its people that harness the value of data.
Intent of Slide:
As previously stated on the title slide, we are digitizing everything! We are increasingly surrounded by data, and we have to do something with it to turn it from 1’s and 0’s into opportunities and value. This means that we are also at a tipping point where the application paradigm will shift dramatically. Just like we saw all applications become web-enabled in the late 90’s, we will now see a growing trend that all applications will become data-centric, and thus analytic-enabled. That’s how we are going to transform data into value to support decisions wherever they are being made, and to empower individuals with knowledge and understanding of the environment (whether personal or business) around them. We are looking at dramatic changes in how we will handle and leverage data. Remind everyone in the room that in the end though, data is just a source that needs to be translated into information, insights, and knowledge. And that action is driven by people, because people are the ones that are still making the vast majority of decisions in the environment around them. Therefore, this tipping point is not just about technology, but also about how people will interact with data and the technology to find the story, to find the truth in the data, that will then help them make a more confident and informed decision. And that has huge implications on how we approach modern analytics.
However, people are being asked to make those decisions quicker than ever before. And its critical to support the agility and data-driven decision-making required to compete in today’s fast-paced, global economy. Organizations that can’t or won’t adapt to a data-driven environment will die. Here are the facts: 64% of business managers have seen their decision window shrink in the last 12 months. Today 42% of business professionals need to make data-driven decisions within 24 hours.
The problem is traditional analytics products available in the market today simply are not up to the task and too slow to respond. Using traditional BI, the industry average time-to-deploy is 18 months and it takes 6.3 weeks to build one report.
Intent of Slide:
Position older stack and traditional BI vendors as slow to respond and expensive to maintain, particularly in the context of supporting the pace of decision making that is required in todays competitive market. This slide also serves to set up the next slide which is to show the other side of the coin, how rapid deployment and data viz only is also not the answer.
….However….visualization alone is not the answer.
Turning data into pretty pictures quickly is not enough. To solve real business problems you need to poke and prod and dig deeper into the data to see how the parts are related to the whole. Simple visualization tools can’t do that.
Yes, visualizations are important, just not sufficient. But they are just one step in the journey of data exploration and discovery. Customers need more.
Intent of Slide:
Now it’s time to broaden the discussion beyond a single use-case of self-service visualization and analysis. I.e., this is one of many applications of analytics that any organization will need, and it should be part of a broader solution, not the only solution. The key phrase here is that it is “necessary and important, but not sufficient.”
Let briefly look in a bit more detail ad what Qlik’s story is, why our approach is unique and why is this important and how does our platform approach deliver this?
Firstly and put simply Qlik brings a completely different perspective to the BI market, first with Qlik View, then with Qlik Sense, and today through a unique and innovative platform approach, giving everyone the ability to answer not just ‘what happened’, but ‘why’ and ‘what is likely to will happen’. Our unique associative model is the foundation of our offering and what allows users to probe all the associations that exist in their data, across all data sources so they can see the whole story that lives within their data.
Secondly, and again simply put Qlik is a platform to meet all your visual analytics needs. Much more than just a tool, it is underpinned by the Qlik Analytics Platform, Qlik solutions supports a full spectrum of business intelligence and analytics use cases from centrally deployed guided analytics, to self-service data discovery, reporting and to embedded analytics in any enterprise or web application.
Finally, Qlik provides agility for the business user, with trust and scale for IT. This is critical as we provide agility for the business from upstream data sourcing and preparation, through to visualization and advanced analytics, and on to downstream collaboration and reporting but importantly, all within a governed framework that drives enterprise scalability and trust for IT.
Only Qlik can deliver these three things. IT centric platform vendors lack the visualization capabilities and the agility so therefore the trust of the business user, pure play data visualization vendors ignore governance and scalability, and they ignore the developer community. The result is that only Qlik can deliver visual analytics at the point of decision because only Qlik can span the gap that exists in the market to deliver on next generation BI.
Companies need the ability to progress in their analytics journey -- not just in pockets, but across the entire business. Companies typically start with the basics – just trying to understand and report what happened in the business. That level of understanding typically extends across the entire organization. It’s a start.
Next they need to figure out why it happened.
And then they reach the next level of maturity to fully embrace diagnostic analysis.
The problem is, all too often we see companies relegating this task to a few, expensive, hard-to-find data scientists. This often prevents the business from getting the answers when and where they need them.
Of course, many companies haven’t even fathomed getting to predictive analytics. That is, what is likely to happen in the future, and how can we influence it to our advantage?
The sad truth is that most popular tools used by business users today aren’t really capable of fulfilling this important need.
Intent of Slide:
Set the scene for a wide range of analytics needs in the company, across a range of users and differing levels of maturity. This is designed to further show that single point solutions cannot meet the real wider needs of the enterprise.
So how do we do that? The core of the platform, and quite frankly the secret sauce, is the QIX engine. QIX is an in-memory, associative data indexing engine.
What does that mean?
Instead of a hierarchical query based approach, QIX enables you to pull all that data, from multiple sources, into the engine, and it does the job of automatically finding and managing all the possible relationships in the data. That includes finding things that are not related!
Most tools force you to pre-conceive the type of analysis and questions that will be asked of the data, so that you can prep and integrate the data into a single hierarchical dataset. Or even a single table. That’s incredibly limiting, keeping people from truly exploring their data. And, the data left behind might be the data that tells the most interesting story, leaving you in the dark.
It also means speed. At Qlik, we’re used to working with large data sets. Some of our customers are working with datasets that number over 100 m rows.
Of course that doesn’t mean it has to be in-memory. With our Direct Discovery capability, we can go against the source directly as well.
In short - Qlik’s associative model enables users to probe all the possible associations that exist in their data, across all of their data sources. This means the user is not limited by predefined hierarchies or preconceived notions of how data should be related, but can finally understand and explore how it truly is related. The result is that you can see the whole story that lives within your data…And the whole story is critical, if you only see part of the story, you will likely not make the right business decision.
Lets look at some examples…
Intent of Slide:
Our platform is based on our patented, in-memory, associative data indexing engine, QIX. This slide needs to be talked to as a compare and contrast approach to how you load-up data for analysis. On the left-side, the traditional data visualization tools depend on arranging all the data into a single hierarchical structure, or table, that can then be queried against in order to visualize the resulting data set. That’s incredibly restrictive, because you can only query against what the resulting single data model consists of, and how it is structured. This is very different than Qlik’s approach, which is to not force you to pre-join all your data into a single structure, but to instead load-up the data from multiple sources, then let the engine find and maintain the relationships, or associations, between the various data elements. By not pre-constraining the data model, the engine can adapt on the fly to support any path of questions the user may choose to follow. The result is that our customers tend to find the full story in the data, since they are empowered to use all the data, not just a subset, and to explore it freely vs. down a specific path. This approach often tends to lead to hidden insights that they wouldn’t have found in the left-side approach, that can have a dramatic impact on their business. This core difference is what our customers will say adds the most value to their organization, because we shed the light on the real story.
The second example looks at Healthcare…
The partial story
Under the old linear data visualization structure, the appropriate pathway for analysis must be predetermined by the IT staff. This frequently requires multiple iterations between clinicians and IT. Not only is this inefficient, but data exploration is then in the hands of non-clinicians. Valuable trends go unrecognized.
With the whole story
All of the data is visible to end-users, revealing relationships not previously seen. The user has a complete view of relevant data through the associative engine. The engine allows relationships and interdependencies to be clearly displayed. The resulting insight allows end-users to see the true relationships between the data and develop an understanding where opportunities to improve exist.
Qlik has as a result of our expanded vision broadened our portfolio from single product, to multiple product and ultimately a platform strategy. And a big part of our strength and story relates to our ability to drive agility through innovation and help our customers become data driven enterprises. At Qlik we are now driving increasing transparency into our innovation strategy and subsequent roadmap. Our innovation is essentially driven across 3 pillars – Analytics, Data and Cloud.
Analytics includes everything we do to support guided analytics, self-services data visualization, and reporting and collaborative analytics.
Data covers access and connectivity, self-services data preparation with Smart Load and Governed Load, big data and more.
Cloud spans everything we do in the cloud including our SaaS offering to create and share in the cloud with Qlik Sense Cloud, our managed cloud offerings through partners, the wider cloud ecosystem and infrastructure and our cloud based value added services like Qlik DataMarket.
These three buckets of innovation drive value into each of our solutions – QV, QS, QSCloud, NPrinting and DataMarket and ultimately down into our underlying platform which powers all our solutions. A platform that as you will soon see, we are so confident in that we now offer the platform packaged specifically for developers to build on. But let me come to that on the next slide…
Intent of Slide:
This slide simply illustrates that we have a portfolio of visual analytics solutions built on our platform and powerful QIX engine, including cloud services for creating and sharing analysis, as well as accessing 3rd party data.
Qlik brings a completely different perspective to the BI market that delivers analytics to everyone in an organization, not just to a limited number of data experts, allowing you to see the whole story that lives within your data. Delivered within a governed framework that drives enterprise scalability and trust for IT, individuals and the entire organization can make decisions with confidence. Qlik’s associative model, delivered through our patented data indexing technology, enables users to probe all the possible associations that exist in their data, across all of their data sources. This means the user is not limited by predefined hierarchies or preconceived notions of how data should be related, but can finally understand and explore how it truly is related. The result: you see the whole story that lives within your data. With our platform approach, Qlik supports a full spectrum of business intelligence and analytics use cases with centrally deployed guided analytics, self-service data discovery and embedded analytics in any enterprise or web application.
All too often, Business Intelligence systems limit agility. Agility and speed permit individuals to constantly adapt to changing environments by delivering solutions that are needed now. This is why Qlik has focused so much innovation on a platform that keeps pace with and adapts to every individuals’ - and organizations’ - line of thinking. It is this innovation that pioneered the market for Data Discovery, and today, Qlik continues to be the leader in this segment as validated by 3rd parties such as Gartner, BARC, Forrester and others. Our heritage of innovation continues to deliver exceptional capabilities to users in areas such as smart search, smart visualizations, responsive mobile design, data security and governance. Our investments in innovation has translated into tens of thousands of customers that have become more agile, data-driven businesses that harness the power of collective human intelligence.
However, technology is only one aspect of the story. Our commitment to customer success runs deep in our company. Qlik brings to market specific industry and functional-level experience, delivering exactly what the customer needs to address their challenges. Our extended ecosystem includes a global user community of over 100,000 participants and a marketplace for sharing applications, data and knowledge. And with over 1,700 committed, experienced partners around the globe, and over 35,000 delighted customers, Qlik regularly ranks at the top of independent surveys on customer satisfaction and value derived from the solutions it provides.
You can further develop and add value to your Qlik Sense deployment with our specific new offerings for Qlik Sense from Qlik’s global services team.
Qlik Sense Fast Start ensures that your teams deliver your first Qlik Sense applications on a scalable analytics platform.
Project initiation and UX workshops
Data modelling and ETL scripting
1-2 very rapid development sprints
Application platform deployment
Production support and documentation
Qlik Continuous Classroom is a new and innovative way to learn that allows you to:
Choose what you want to learn
Choose how you want to learn
Choose when you want to learn
Finally let me close by saying that the best way to learn about Qlik Sense solutions is to experience it yourself…
Try an app by visiting our demo store – both business and fun applications showcasing our portfolio and solutions.
Create your own app by downloading Qlik Sense Desktop today – get started with a range of videos on our community pages.
Once you have built an app share it with friends and colleagues for free via Qlik Sense Cloud. Don’t forget you can also create and share apps directly in the cloud as well.
And finally test your Qlik skills with our unique skills assessment which highlights new learning opportunities to help you put visual analytics at the point of your decisions.