Downloaded 17 times


![Swiss Re Financial repression: The unintended consequences 13
Impact on private households
The prevailing low interest rate environment and the strong performance of
financial assets due to loose monetary policy have a profound impact on savers and
institutional investors’ portfolio returns. Some regard this as another example of
financial repression. Reinhart and Sbrancia (2011) summarise it thus as: “unlike
income, consumption, or sales taxes, the ‘repression’ tax rate […] may be a more
politically palatable alternative to authorities.”
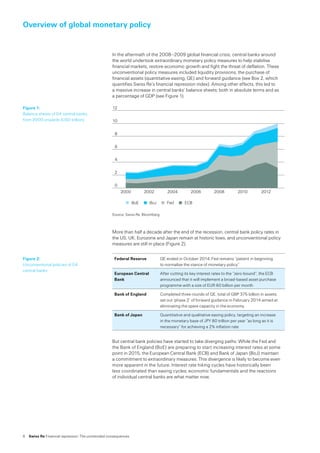
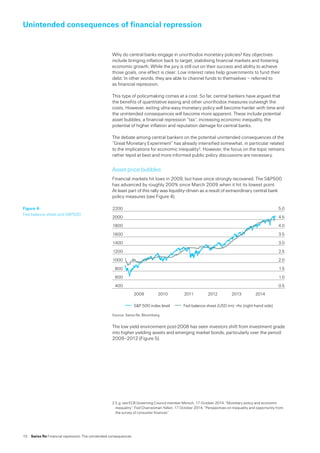
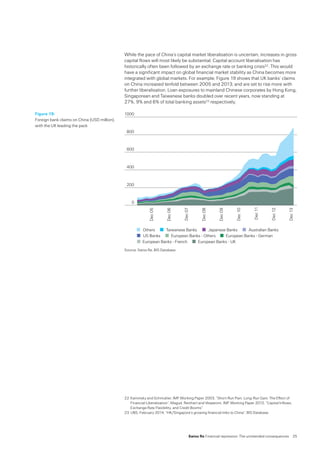
Unconventional central bank policies not only affect the interest-bearing assets of
households (accounting for roughly 30% of household wealth), but other investments
such as equity (~40% of household wealth, including mutual funds) and real estate
(25% of household wealth) – see Figure 8.
Source: Swiss Re, US Federal Reserve
Households are being ‘taxed’ as they do not earn interest on their deposits that they
otherwise would. In case of negative real interest rates, they even experience a
devaluation of their savings in real terms. Had the Fed followed a simple Taylor rule5,
the policy target rate would have been roughly 1.7 percentage points higher on
average in the period 2008–2013.
Assuming the lower rate had been passed on to depositors, the foregone annual
interest earnings from savings accounts amount to USD 14 000 per adult for the top
1% wealthiest; and USD 160 for the bottom 90%. For pension and life insurance
assets, with 10-year US bond yields having traded roughly 1.2 percentage points
below their ‘fair value’6 on average since 2008, foregone interest for the top 1%
amounts to roughly USD 9 000 per adult. Clearly, low interest rates also reduce debt
costs; with lower mortgage rates providing the bulk of the relief7. On a net basis,
the foregone interest earnings amount to roughly 0.3% of total financial assets for
both the top 1% and top 10% wealthiest adults (see Figure 9). For the remaining,
the significant advantage of lower debt costs (mainly mortgages) translates into
a ‘subsidy’ of 0.3% of financial assets. Since the financial crisis, the total cumulative
Figure 8:
US household wealth asset allocation
0%
10%
20%
30%
40%
50%
60%
70%
80%
90%
100%
Other
Fixed income
Equity
Currency and deposits
Mutual funds
Life insurance and pension
Real Estate
2013201220112010200920082007
USD trn
77 66 68 72 73 79 88
5 Taylor-rule rate = Neutral real policy rate + core CPI + 0.5*(Inflation target – core CPI) + 0.5*
(NAIRU – unemployment rate)
6 “Fair value“ computed as potential GDP growth rate + inflation target of 2%. Note: this analysis ignores
any realised gains or losses on the fixed income holdings, taking a pure running investment income view
7 As for pension and life insurance assets, the assumption is that debt costs have been 1.2% lower than
“fair value“, on average](https://image.slidesharecdn.com/financialrepression-150719164610-lva1-app6892/85/Financial-Repression-15-320.jpg)


![Swiss Re Financial repression: The unintended consequences 17
Impact on institutional investors
Institutional investors such as re/insurers and pension funds hold a significant part
of their assets in fixed income securities given their business need to match long-
term liabilities. As such, their investment income has been significantly impacted by
prevailing low interest rates. Life insurers in particular struggle to meet their
guaranteed rates. Although the guaranteed life insurance credit rate has declined in
recent years, it is still significantly above the respective 10-year government bond
yield (around 2.5% vs ~1% typical European 10-year bond yield13).
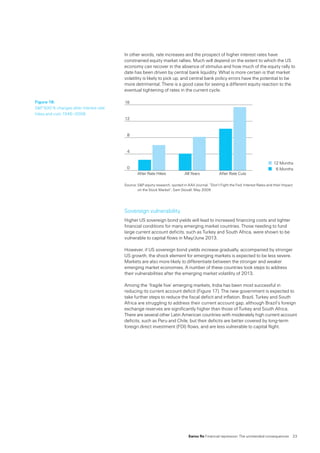
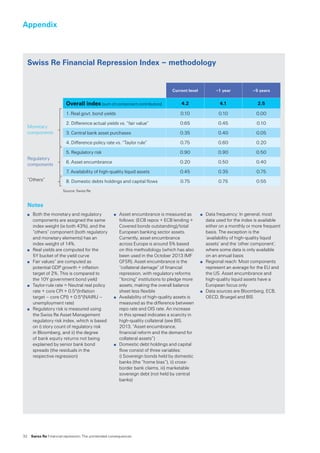
Re/insurers’ running yields14 have declined over recent years, following a similar path
as 30 year US Treasury yields (see Figure 13). Had US Treasuries (or German Bunds)
been trading closer to their ‘fair value’ (implied by potential GDP growth and an inflation
target of 2%), running yields would have been roughly 0.5–1 percentage points
higher on average for the 2008–2013 period15. Given re/insurers’ allocation to fixed
income assets of 50–60%16, this would have translated into roughly USD 20–40
billion additional income overall for both US and European insurers. A sensitivity
analysis of insurers’ running investment income to additional running yield is shown
in Figure 14. For pension funds, the impact of 1 percentage point of additional
running yield would be similar – a total additional income of USD 40–50 billion per
annum. The pension industry’s asset base is somewhat larger, but the average
allocation to fixed income is smaller than in the insurance sector.
Source: Swiss Re, Bloomberg, OECD Database, Insurance Europe, 2014, “European Insurance in Figures“
Figure 13:
US insurers’ running yields vs. 30 year
Treasuries
2%
3%
4%
5%
6%
7%
30yr UST yield (%)
US PC running yield
US LH running yield
Q4/01 Q4/03 Q4/05 Q4/07 Q4/09 Q4/11 Q4/13
Figure 14:
Insurers‘ investment income as a function of
additional running yield
0
10
20
30
40
50
60
70
80
European insurers
US insurers
0.10.30.50.70.91.11.31.5
USD bn
Additional running yield
13 EIOPA Financial Stability Report, May 2014
14 Annualised investment return based on average invested assets. Excludes realised gains/losses
15 Computed as actual 30Y government bond yield – [“fair value“ (which is assumed to hold for
10Y government bonds) + historical 30Y–10Y term premium of ~50bps]
16 Insurance Europe, 2014, “European Insurance in Figures“ and OECD Database. Note that the fixed
income allocation might be understated due to OECD classification of “miscellaneous assets“, mutual
funds, unit trusts, money market fund shares etc.](https://image.slidesharecdn.com/financialrepression-150719164610-lva1-app6892/85/Financial-Repression-19-320.jpg)


The document discusses the significant costs and unintended consequences of unconventional monetary policies, particularly financial repression, which have emerged in the aftermath of the financial crisis. While these policies have supported government debt financing and stabilized financial markets, they also contribute to asset price bubbles, economic inequality, and damaged credit intermediation channels. The publication aims to highlight these issues and advocate for addressing structural reforms and enhancing private capital market activities.


