Download as PDF, PPTX
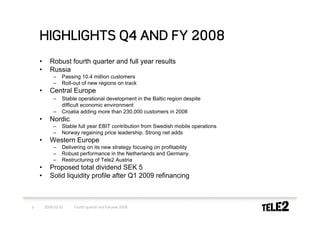
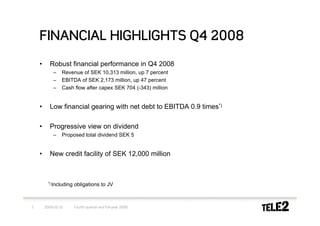
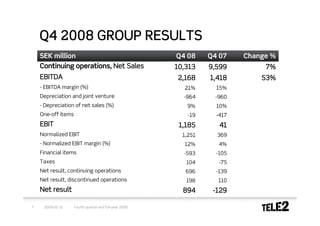
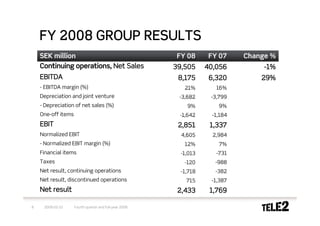
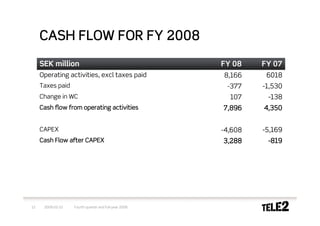
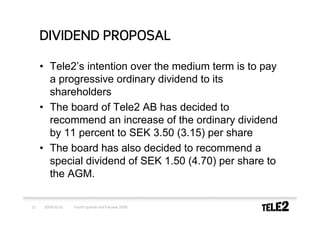
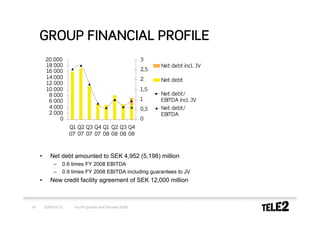
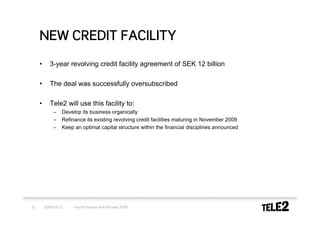
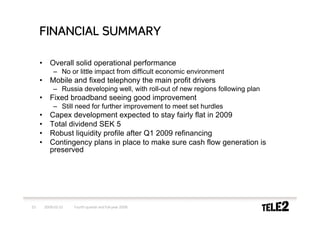


Tele2 reported robust fourth quarter and full-year 2008 results with revenue growth and improved profitability. Key highlights included strong growth in Russia and Croatia, stable performance in the Nordic region, and a focus on profitability in Western Europe. Tele2 is well positioned financially and operationally to deal with potential economic impacts in 2009, with contingency plans to preserve cash flow. The company proposed an increased dividend and secured a new credit facility, maintaining a strong liquidity profile.


