Download as PDF, PPTX


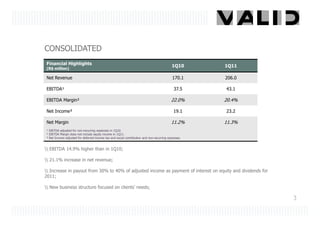
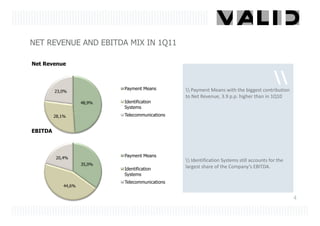
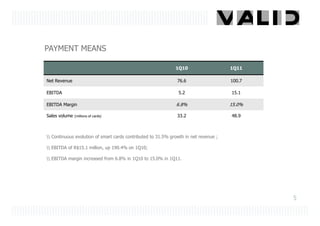
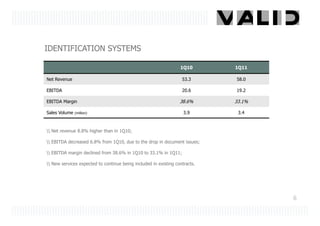
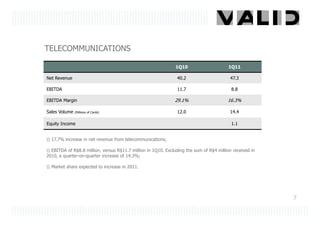
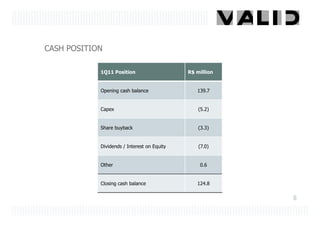
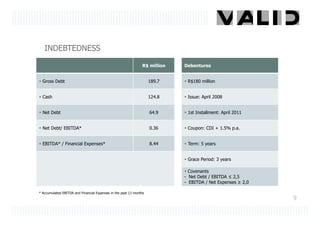


This document summarizes Valid's financial results for the first quarter of 2011. It shows that EBITDA increased 14.9% compared to the first quarter of 2010. Net revenue grew 21.1% while net income increased 22.1%. Payment means was the largest contributor to revenue and saw significant growth in revenue and EBITDA. Identification systems remained the largest contributor to EBITDA but margins declined. Telecommunications also saw revenue growth. The company maintains a strong cash position and low debt levels. Valid expects continued growth across its business segments in 2011.


