This document outlines key concepts for learning Python, including:
1. How to import common packages like NumPy, Pandas, and Matplotlib for numerical processing, data analysis, and visualization.
2. The basics of Python data structures like lists, arrays, and functions.
3. Intermediate topics such as date/time handling, dictionaries, if/else statements, and loops.
4. How to work with Pandas DataFrames for reading, manipulating, and analyzing data.
5. Importing and managing financial data from sources like CSV, Excel, Google Finance, and the Federal Reserve.
6. Performing financial analysis and backtesting trading strategies using packages like TA-Lib and backtrader.


![The basics
• List: first item has an index value of 0
• Slicing: includes the start & up to (but not include) the end, can slice with step (must be integer)
• Mylist [startAt : endBefore : step]
• Methods: .sort(), .append(), .extend(), .index(x), .min(), .max()
• Array: faster in reading, storing, calculating items
• Create array: np.array()
• Functions: .shape, .size, .mean, np.std(), np.arange(start, end, step), np.transpose()
• Can subset array using Boolean array
• Visualistion: use matplotlib.pyplot or seaborn packages
• Boxplot for quantiles and outliers: sns.boxplot(x= ,y= , data= )
• Line plot: plt.plot()
• Scatter plot: plt.scatter()
• Histogram: plt.hist(x = , bins = ); normed = 1 to use %
• Plt.show() to show graphs, plt.legend() to show legends
• Miscellaneous: color = , linestyle = ’ ‘, legend =‘ ‘, subplot = True, plt.xlabel(’ ‘), plt.ylabel(‘ ‘)
• Add a vertical line on chart: ax.axvline()
• Other plot types ( kind = ‘ ‘): bar, barh, hist, box, kde, density, area, pie, scatter, hexbin](https://image.slidesharecdn.com/pythonpresentation-211118075258/85/Python-presentation-3-320.jpg)
![Intermediate Python
• Representing time: use datetime package
• Convert datetime from string, from string to datetime
• Formatting time: consult materials. Example: %A, %B $d,
%Y
• datetime.now (), .datetime(year, month, day, hour,
minute)
• Attributes: .year, .month, .day, .hour,…
• Time delta: how much time between 2
timestamps
• Create relative datetime using timedelta()
• Dictionary: store and lookup values using keys
• Create dictionary: {‘key 1’:’value 1’, ’key 2’:’value 2’, ‘key
3’:’value 3’}
• Add new keys: dictionary [‘key’] = ‘value’
• Access values: dictionary [‘key’] or use get method
• Delete: del(dictionary[‘key’])
• Comparison operators: ==, !=, >, <, <=, =>
• Boolean operators: and,, or, not
• If statements:
• If <expression/control statement> :
Statement 1
Statement 2
Statement 3
• Else: excute code when the control statement is False
• Elif: only excute when initial statement is False and the
Elif statement is satisfied
• Loops:
• For <variable> in <sequence>:
Statement
• While <expression>:
Statement
• Skipping loop: if <expression> :
continue
• Stopping loop: if <expression> :
break](https://image.slidesharecdn.com/pythonpresentation-211118075258/85/Python-presentation-4-320.jpg)
![Intermediate Python
• DataFrames: using pandas package, similar to
spreadsheets or tables
• Can create DataFrames from dictionary or list of lists
• Reading data: pd.read_<file type> (’ file name or
path to file’)
• File type: excel, csv, json, html, pickle, sql
• Access column:
• Use [] brackets, dot
• Or list of name for multiple columns
• Access rows:
• Use slicing []
• List of booleans
• Access columns and rows in small dataset:
• iloc (by name)
• loc (by index)
• Methods: .count(), .min(), .max(), .first(), .last(), .sum(),
.prod(), .mean(), .median(), .std(), .var(), .quantiles()
• Note: method runs across rows by default, run across
columns if axis = 1
• Manipulating data:
• Remove column: .drop(columns=[ ], axis = 1, inplace = True)
• Remove row: .drop() remove rows by default
• Add multiple rows: .append() or .concat()
• Operations on DataFrames:
• apply directly to column
• .map: apply the defined operation to the selected columns
• .apply: across rows and columns
• Checking data:
• .info(): to view data structure
• .head(): display first 5 rows
• .tail(): display last 5 rows
• .describe(): summary stats
• Include = …
• Percentiles = [.1, .5, .9]
• Exclude = …
• Filtering data:
• Apply comparison expression on selected column
result: Boolean values for each row in that column
• .loc [boolean_result] to filter values that satisfy the
comparison expression](https://image.slidesharecdn.com/pythonpresentation-211118075258/85/Python-presentation-5-320.jpg)
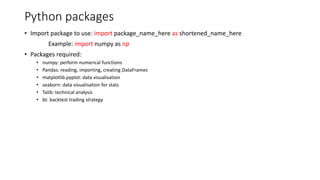
![Importing and managing financial data
• Import and inspecting data:
• CSV: pd.read_csv(‘file_name.csv’, na_values=‘n/a’,
parse_dates =[‘label of the column containing date info’])
• Excel: pd.read_excel( )
• Import an entire worksheet or just 1 or 2 sheets
• Combine data from multiple worksheets:
pd.concat()
• Combine vertically and combine data based on columns
• Note: a reference column is needed
• Google Finance:
• 1st step is importing datetime functionality define
start and end date using date ()
• Data source: ‘google’
• E.g. stock_date = DataReader(ticker, data_source, start, end)
• Fed Researve:
• Series code: available on the website
• E.g. data = DataReader (series_code, data_source, start)
• Dealing with missing values:
• Drop rows with missing values: .dropa (inplace = True)
• Replace missng value with mean: .filla
• Useful methods:
• .sort_values (‘column’, ascending = False)
• .set_index: assign a different data type/values to the index
• .idxmax(): find index of max value
• .unique(): unique values as numpy array
• .div(): divide the whole column
• . nlargest(n = ): find n largest values
• .index.to.list(): convert index to list
• .panel.to_frame(): convert panel to frame
• Why? 2D multiIndex is easier to work with than panel
• .unstack(): unstack data, move from a long format to wide
format
• Methods for categorical data
• .nunique(): identify unique values or categories
• .value_count(): how many times each value occurs
• .groupby(): group data
• .agg(): pass a list with names of stats metric](https://image.slidesharecdn.com/pythonpresentation-211118075258/85/Python-presentation-6-320.jpg)
![Financial Trading
• Packages needed: ta-lib and bt
• Plot interactive candle sticks:
• Use plotly.graph_objects package
• go.Candlestick(x=, open=, high= , low= ,close=)
• Resample data: hourly to daily, daily to weekly
• Important calculations:
• Daily return: .pct_change()*100
(calculate % change from preceding row by default)
• SMA: .rolling(window = n).mean()
talib.SMA(data, time period)
• EMA: talib.EMA(data, time period)
• ADX: talib.EDX(high, low, close, timeperiod)
• RSI: talib.RSI(data, time period)
• Bollinger Band: talib.BBANDS(data, nbdevup = , nddevdn
= , time period)
Construct trading signal:
1. Get historical price: bt.get(‘ticker’,start=,end=)
2. Calculate indicators
3. Create signal DataFrame
signal=indicator_long.copy()
signal=[indicator_long.isnull()]=0
Define strategy:
Signal[condition 1] = 1 (long signal)
Signal[condition 2] = -1 (short signal)
Plot signal, prices and indicators: create a combined dataframe
using bt.merge
4. Define signal-based strategy
Bt_strategy = bt.Strategy(‘strategy_name’,
[bt.algos.SelectWhere( condition),
bt.algos.WeighEqually(),
bt.algos.Rebalance()])
Or
Bt_strategy=bt.Strategy(‘strategy_name’,
[bt.algos.WeighTarget(signal),
bt.algos.Rebalance()])](https://image.slidesharecdn.com/pythonpresentation-211118075258/85/Python-presentation-7-320.jpg)
![Financial Trading
Backtest
Bt_backtest = bt.Backtest (bt_strategy, price_data)
Bt_result = bt.run(bt_backtest)
Plot the backtest PnL:
bt_result,plot(title= )
Strategy optimization: try a range of input
parameter values
Define function (to save time, don’t have to repeat code)
Def signal_strategy (ticker,period,name,start =,end = )
<get historical values, calculate indicators, define signal, define
signal-based strategy>
Return bt.Backtest(bt_strattegy, price_data)
Can call this function several times, run backtest to find the
optimal input
Benchmarking: can compared active trading
strategy with buy and hold strategy
Def buy_and_hold (ticker,name,start=,end=)
<get historical data>
bt_strategy = bt.Strategy(name,
[bt.algos.RunOnce(),
bt.algos.SelectAll(),
bt.algos.WeighEqually(),
bt.algos.Rebalance()])
return bt.Backtest (bt_strategy, price_data)
Run backtest on strategies and benchmark and compare
Strategy return analysis:
• Backtest stats: resInfo = bt_result.stats
• View all stats index: print(resInfo.index)
• Stats: rate of returns, cagr, max drawdown, calmar
ratio, share ratio, sortino ratio (yearly, monthly, daily
data)
E.g. print(‘Compound annual growth rate: %.4f’% resInfo.loc[‘cagr’])
• Compare multiple strategy returns:
lookback_results = bt_result.display_lookback_returns()
print(lookback_result)](https://image.slidesharecdn.com/pythonpresentation-211118075258/85/Python-presentation-8-320.jpg)