
Recommended
More Related Content
Similar to p-values9.pdf
Similar to p-values9.pdf (20)
Recently uploaded
Recently uploaded (20)
p-values9.pdf
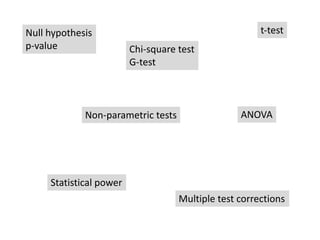
- 1. Null hypothesis p-value Chi-square test G-test t-test ANOVA Non-parametric tests Statistical power Multiple test corrections
- 2. Null hypothesis p-value Chi-square test G-test t-test ANOVA Non-parametric tests Statistical power Multiple test corrections WRONG WRONG
- 3. 1,000 tests real effect in 10% 100 tests no effect in 90% 900 tests Pr(real) = 0.1 power = 80% significance level = 5% 80% detected 80 true positives 20% not detected 20 false negatives 95% tested negative 855 true negatives 5% “detected” 45 false positives False discovery rate 𝐹𝐷𝑅 = false positives discoveries 𝐹𝐷𝑅 = 45 45 + 80 = 0.36 Colquhoun D., 2014, “An investigation of the false discovery rate and the misinterpretation of p-values”, R. Soc. open sci. 1: 140216. False positive rate 𝐹𝑃𝑅 = false positives no effect 𝐹𝑃𝑅 = 45 900 = 0.05
- 4. If you publish a 𝑝 < 0.05 result, you have a 36% chance of making a fool of yourself Colquhoun D., 2014, “An investigation of the false discovery rate and the misinterpretation of p-values”, R. Soc. open sci. 1: 140216. 1,000 tests real effect in 10% 100 tests no effect in 90% 900 tests Pr(real) = 0.1 power = 80% significance level = 5% 80% detected 80 true positives 20% not detected 20 false negatives 95% tested negative 855 true negatives 5% “detected” 45 false positives
- 5. What’s wrong with p-values? Hand-outs available at http://is.gd/statlec Marek Gierliński Division of Computational Biology
- 6. ❌ ❌ ❌
- 7. Statistical testing Statistical model Null hypothesis H0: no effect All other assumptions Significance level 𝛼 = 0.05 p-value: probability that the observed effect is random 𝑝 < 𝛼 Reject H0 (at your own risk) Effect is real 𝑝 ≥ 𝛼 Insufficient evidence Statistical test against H0 Data
- 8. p-value: Given that H0 is true, the probability of observed, or more extreme, data It is not the probability that H0 is true
- 9. P-value is the degree to which the data are embarrassed by the null hypothesis Nicholas Maxwell
- 10. “All other assumptions” Null hypothesis H0: no effect Significance level 𝛼 = 0.05 𝑝 < 𝛼 Reject H0 𝑝 ≥ 𝛼 Do not reject H0 Experimental protocols followed Instruments calibrated Data collected correctly All other assumptions about biology are correct No other effects No other effects 𝑝 < 𝛼 Reject H0 No silly misakes
- 11. 1 p-values test not only the null hypothesis, but everything else in the experiment
- 12. 𝐹𝐷𝑅 = 45 45 + 80 = 0.36 1,000 tests real effect in 10% 100 tests no effect in 90% 900 tests Pr(real) = 0.1 power = 80% significance level = 5% 80% detected 80 true positives 20% not detected 20 false negatives 95% tested negative 855 true negatives 5% “detected” 45 false positives Why large false discovery rate?
- 13. Simulated population of mice 13 No effect (97%) 𝜇C = 20 g 𝜎 = 5 g Real effect (3%) 𝜇F = 30 g 𝜎 = 5 g Power analysis effect size Δ𝑚 = 10 g power 𝒫 = 0.9 significance level 𝛼 = 0.05 sample size 𝑛 = 5 Null hypothesis H0: 𝜇 = 20 g one-sample t-test
- 14. Gedankenexperiment: distribution of p-values 14 𝛼 = 0.05 positives
- 15. Gedankenexperiment: “significant” p-values 15 No effect Real effect True positives False positives 𝐹𝐷𝑅 = 𝐹𝑃 𝐹𝑃 + 𝑇𝑃 ≈ 0.63 𝛼 = 0.05 positives
- 16. Small 𝛼 doesn’t help 16 True positives False positives 𝐹𝐷𝑅 = 𝐹𝑃 𝐹𝑃 + 𝑇𝑃 ≈ 0.20 No effect Real effect positives 𝛼 = 0.001
- 17. 2 The chance of making a fool of yourself is much larger than 𝛼 = 0.05
- 18. FDR depends on the probability of real effect 18 True positives False positives 𝛼 = 0.05 𝐹𝐷𝑅 ≈ 0.05 No effect (50%) Real effect (50%)
- 19. 3 When the effect is rare, you are screwed
- 20. What does a p-value ~ 0.05 really mean? 20 True positives False positives 𝛼 ~ 0.05 𝐹𝐷𝑅 = 0.21
- 21. Bayesian approach: consider all prior distributions 21 Berger & Selke (Bayesian approach) 𝑝 ~ 0.05 ⇒ 𝐹𝐷𝑅 ≥ 0.3 3-sigma approach 𝑝 ~ 0.003 ⇒ 𝐹𝐷𝑅 ≥ 0.04 Berger J.O, Selke T., “Testing a point null hypothesis: the irreconcilability of P values and evidence”, 1987, JASA, 82, 112- 122 Simulation
- 22. 4 When you get a 𝑝 ~ 0.05, you are screwed
- 23. Gedankenexperiment: reliability of p-values 23 Normal population, 100% real effect One-sample t-test p-values can be unreliable Sample size = 3, power = 0.18 Sample size = 10, power = 0.80
- 24. Underpowered studies lead to unreliable p-values
- 25. Inflation of the effect size 25 real mean effect size = 5 g estimated mean effect size = 7.3 g
- 26. Underpowered studies lead to unreliable p-values Underpowered studies lead to overestimated effect size
- 27. 5 When your experiment is underpowered, you are screwed
- 28. Neuroscience: most studies underpowered Button et al. (2013) “Power failure: why small sample size undermines the reliability of neuroscience”, Nature Reviews Neuroscience 14, 365-376
- 29. The effect size 𝑝 = 0.004
- 30. The effect size With sample size large enough everything is “significant” Effect size is more important Looking at whole data is even more important 𝑝 = 0.004 𝑛F = 775 𝑛Q = 392
- 31. 6 When you have lots of replicates, p-values are useless
- 32. 7 Statistical significance does not imply biological relevance
- 33. Multiple test corrections can be tricky 10,000 genes 10,000 tests Benjamini-Hochberg correction RESULT
- 34. Multiple test corrections can be tricky 10,000 genes 10,000 tests Benjamini-Hochberg correction RESULT Complex experiment Multi-dimensional data Searching... Nothing Searching... Nothing Searching... Nothing Searching... RESULT Batch effects? No
- 35. 8 It is not always obvious how to correct p-values
- 36. What’s wrong with p-values? P-values test not only the targeted null hypothesis, but everything else in the experiment The chance of making a fool of yourself is much larger than 𝛼 = 0.05 When you get a 𝑝 ~ 0.05, you are screwed When your experiment is underpowered, you are screwed Multiple test corrections are tricky A lot, because statistics When the effect is rare, you are screwed Statistical significance does not imply biological relevance When you have lots of replicates, p-values are useless P-values test not only the targeted null hypothesis, but everything else in the experiment When the effect is rare, you are screwed When you get a 𝑝 ~ 0.05, you are screwed When your experiment is underpowered, you are screwed Statistical significance does not imply biological relevance When you have lots of replicates, p-values are useless Multiple test corrections are tricky The chance of making a fool of yourself is much larger than 𝛼 = 0.05
- 38. The plain fact is that 70 years ago Ronald Fisher gave scientists a mathematical machine for turning baloney into breakthroughs, and flukes into funding. It is time to pull the plug. Robert Matthews, Sunday Telegraph, 13 September 1998. Null hypothesis significance testing is a potent but sterile intellectual rake who leaves in his merry path a long train of ravished maidens but no viable scientific offspring. Paul Meehl, 1967, Philosophy of Science, 34, 103-115 The widespread use of “statistical significance” as a license for making a claim of a scientific finding leads to considerable distortion of the scientific process. ASA statement on statistical significance and p-values (2016)
- 39. By Jim Borgman, first published by the Cincinnati Inquirer 27 April 1997
- 40. What’s wrong with us?
- 41. Journal of the American Statistical Association, Vol. 54, No. 285 (Mar., 1959), pp. 30-34 “There is some evidence that [...] research which yields nonsigificant results is not published. Such research being unknown to other investigators may be repeated independently until eventually by chance a significant result occurs [...] The possibility thus arises that the literature [...] consists in substantial part of false conclusions [...].”
- 42. Canonization of false facts Nissen S.B., et al., “Research: Publication bias and the canonization of false facts”, eLife 2016;5:e21451
- 43. Canonization of false facts Negative publication rate Probability of canonizing false claim as fact Nissen S.B., et al., “Research: Publication bias and the canonization of false facts”, eLife 2016;5:e21451 0 0.2 0.4 0.6 0.8 1 0 0.2 0.4 0.6 0.8 1 𝛼 = 0.05 Power = 0.8
- 44. If you don’t publish negative results, science is screwed but... there is a thin line between “negative result” and “no result”
- 45. Data dredging, p-hacking Searching until you find the result you were looking for Massaging data Post-hoc hypothesis Unaccounted multiple experiments/tests 𝑝 = 0.06? Let’s try again Ignoring confounding effects Not reporting non- significant results
- 46. Evidence of p-hacking 46 Head M.L., et al. “The Extent and Consequences of P-Hacking in Science”, PLoS Biol 13(3) Distribution of p-values reported in publications Evidence of p-hacking 𝑛F 𝑛Q H0: 𝑛F = 𝑛Q
- 47. Reproducibility crisis Open Science Collaboration, “Estimating the reproducibility of psychological science”, Science, 349 (2015) Managed to reproduce only 39% results
- 48. Reproducibility crisis Nature's survey of 1,576 researchers
- 50. The great reproducibility experiment
- 51. Are referees more likely to give red cards to black players? 51 • one data set • 29 teams • 61 scientists • task: find odds ratio Silberzahn et al., “Many analysts, one dataset: Making transparent how variations in analytical choices affect results”, https://osf.io/j5v8f
- 52. 52
- 53. P-values are broken We are broken
- 54. What do we do? What the hell do we do?
- 55. Before you do the experiment talk to us The Data Analysis Group http://www.compbio.dundee.ac.uk/dag.html
- 56. Specify the null hypothesis Design the experiment • randomization • statistical power Quality control some crap comes out in statistics We assumed the null hypothesis Never, ever say that large 𝑝 supports H0 Ditch the 𝜶 limit use p-values as a continuous measure of data incompatibility with H0 𝑝 ~ 0.05 only means ‘worth a look’ Reporting a discovery based only on 𝑝 < 0.05 is wrong Use the three-sigma rule that is 𝑝 < 0.003, to demonstrate a discovery Reporting • Always report the effect size and its confidence limits • Show data (not dynamite plots) • Don’t use the word ‘significant’ • Don’t use asterisks to mark ‘significant’ results in figures Validation Follow-up experiments to confirm discoveries Publication Publish negative results
- 57. ASA Statement on Statistical Significance and P-Values 1. P-values can indicate how incompatible the data are with a specified statistical model 2. P-values do not measure the probability that the studied hypothesis is true, or the probability that the data were produced by random chance alone 3. Scientific conclusions and business or policy decisions should not be based only on whether a p-value passes a specific threshold 4. Proper inference requires full reporting and transparency 5. A p-value, or statistical significance, does not measure the size of an effect or the importance of a result 6. By itself, a p-value does not provide a good measure of evidence regarding a model or hypothesis https://is.gd/asa_stat