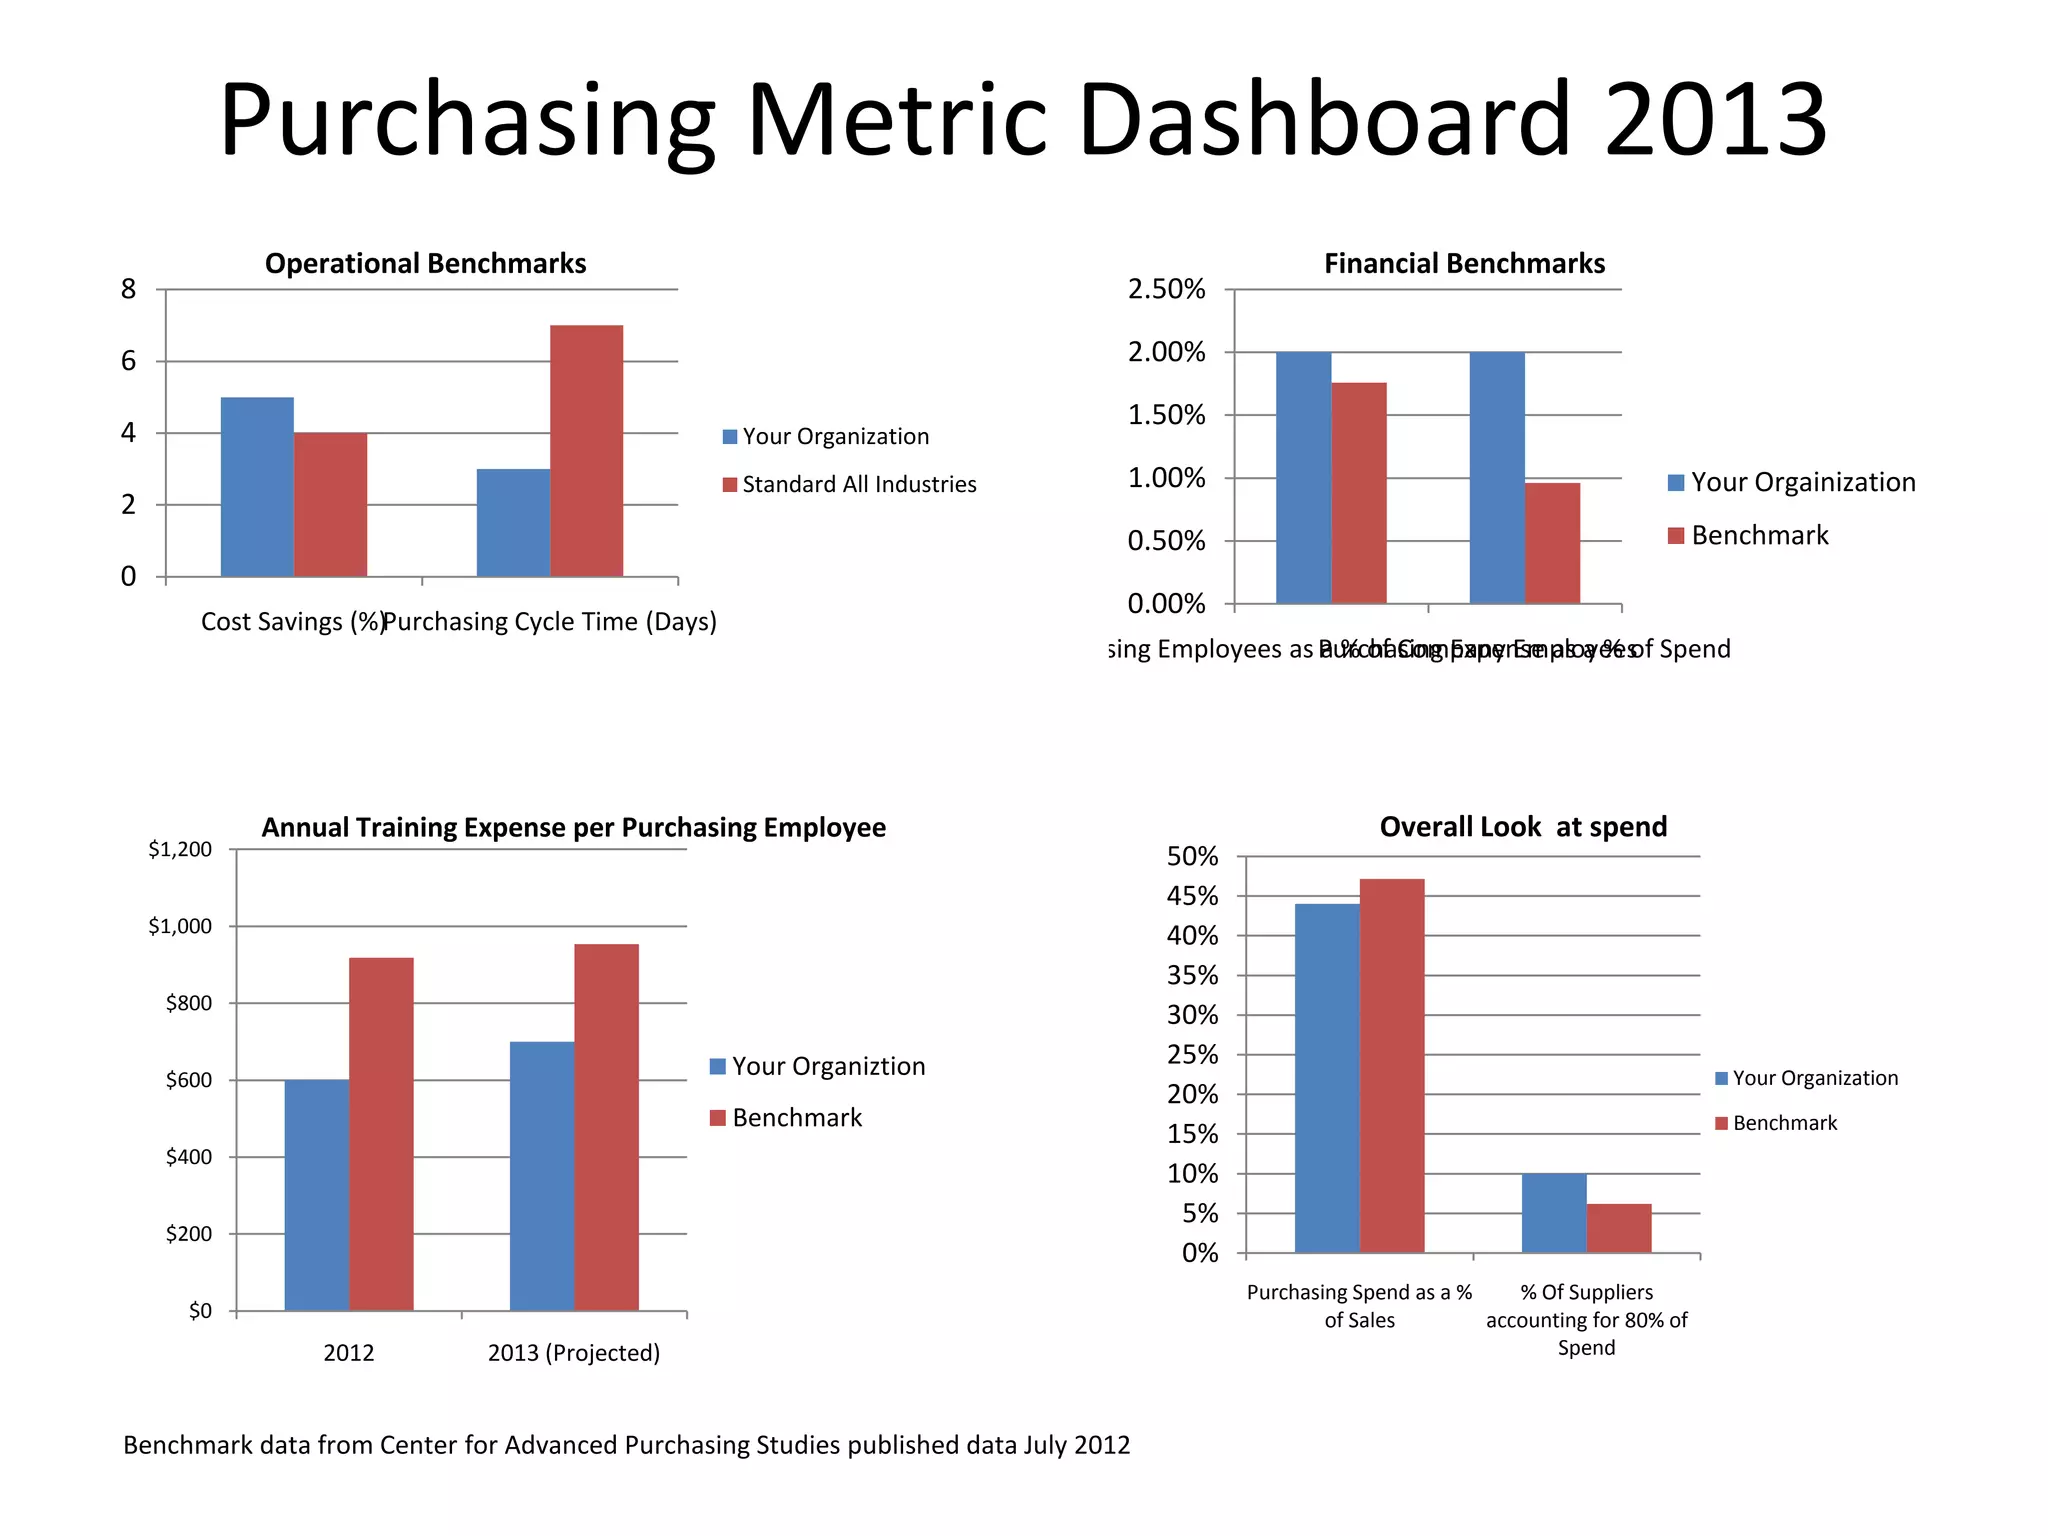
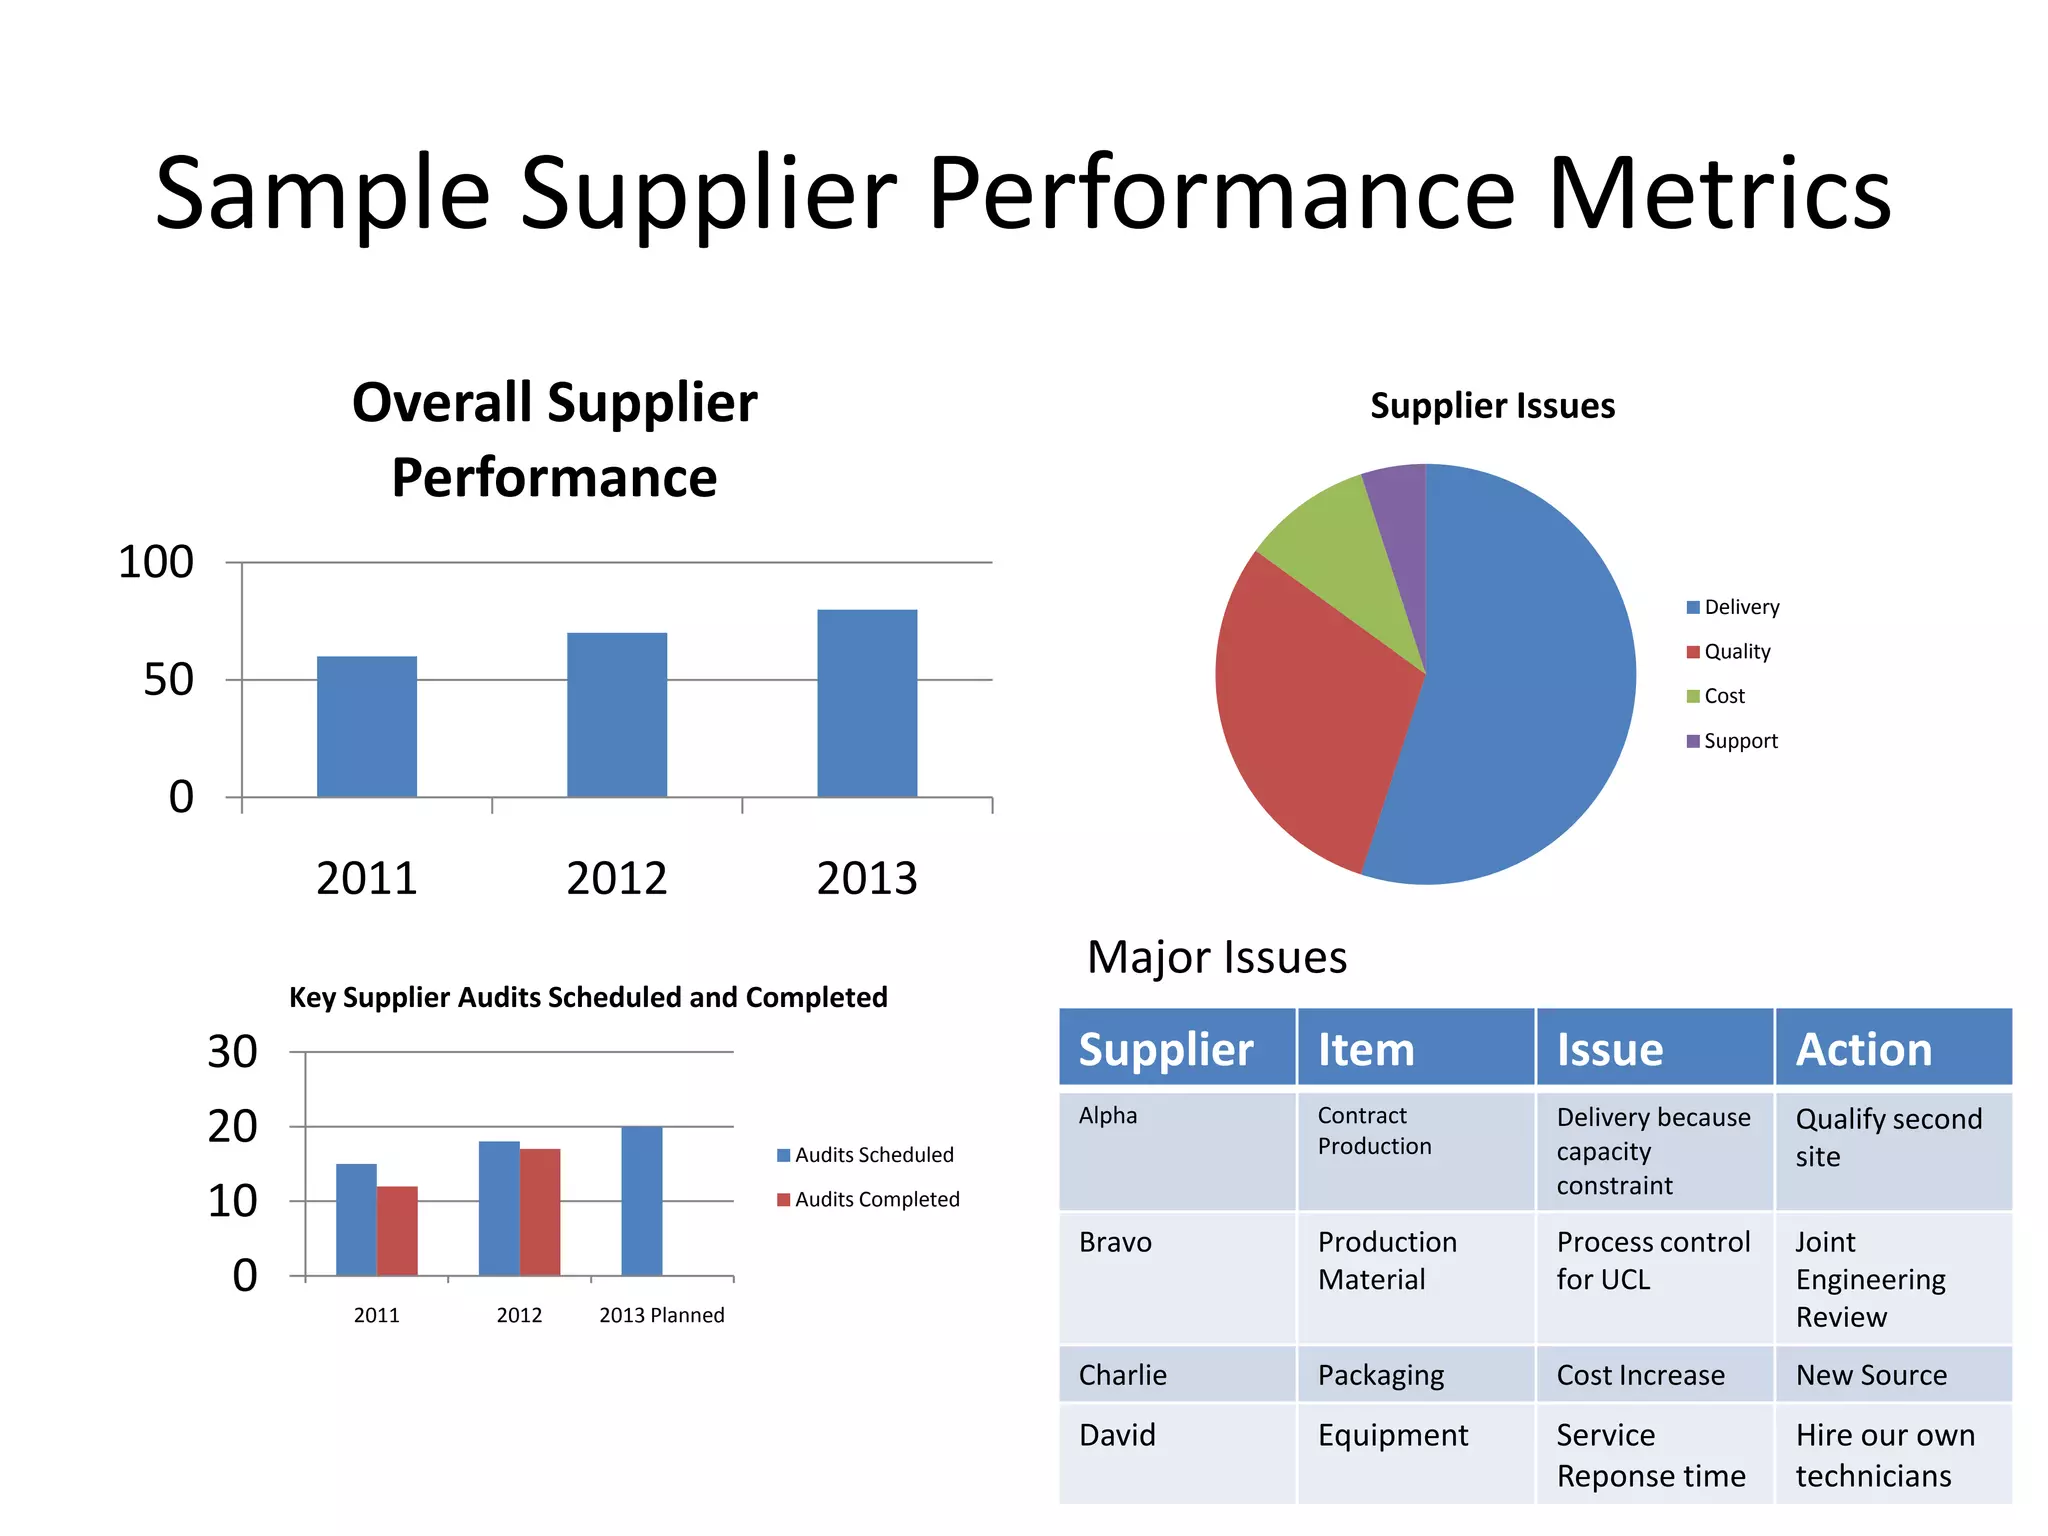
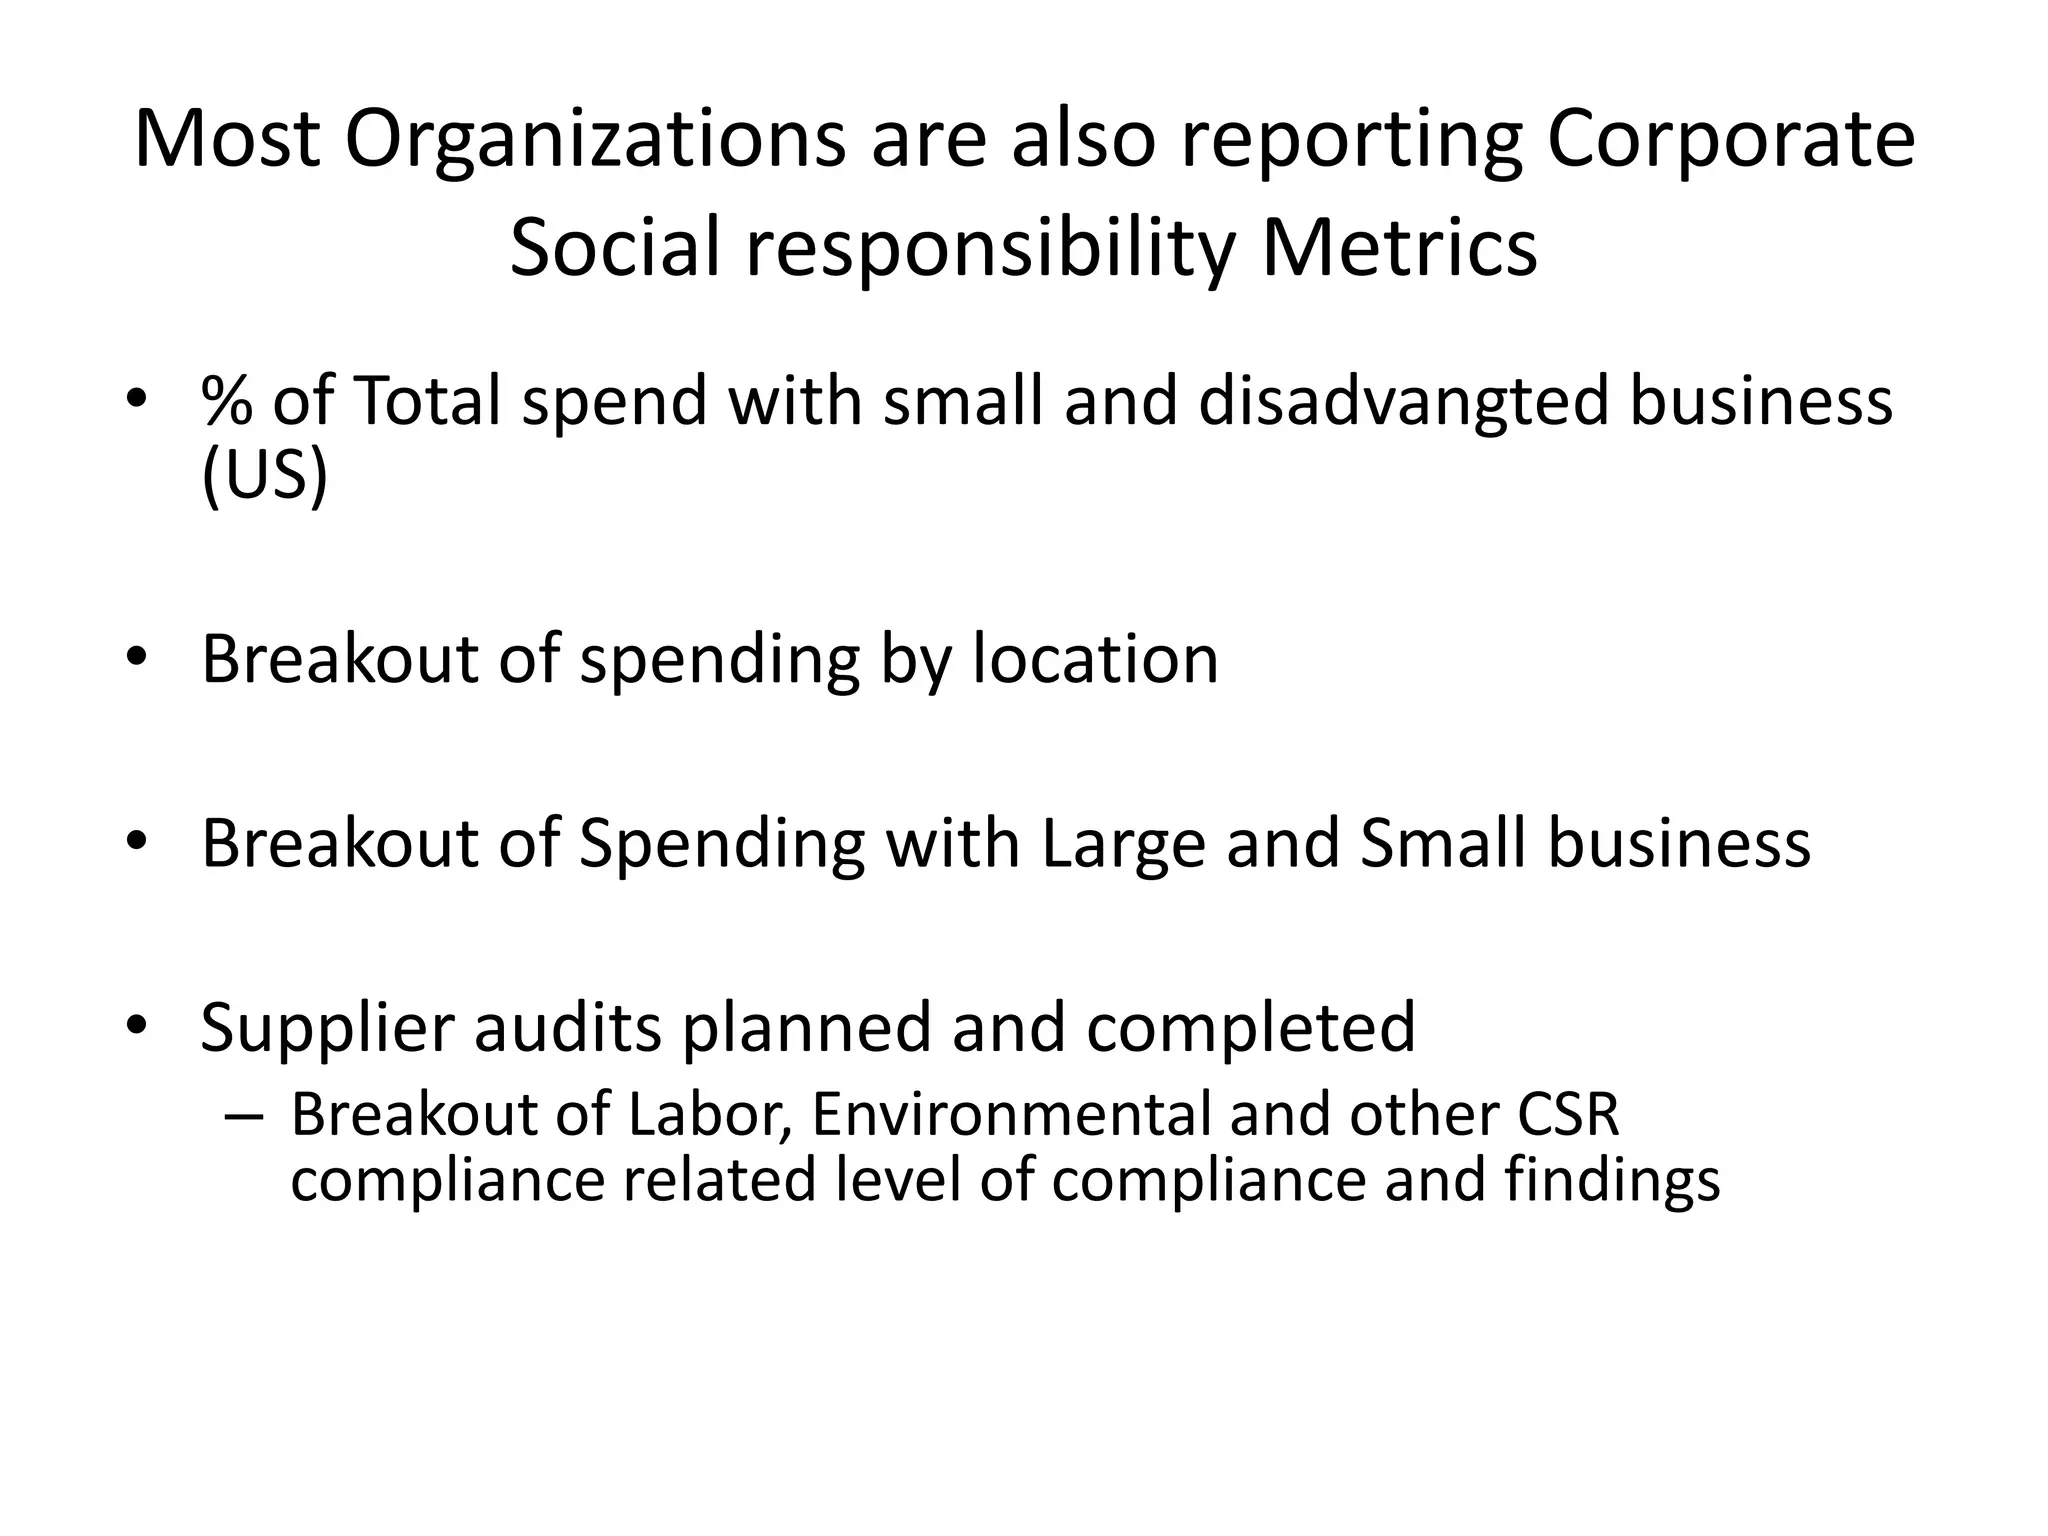
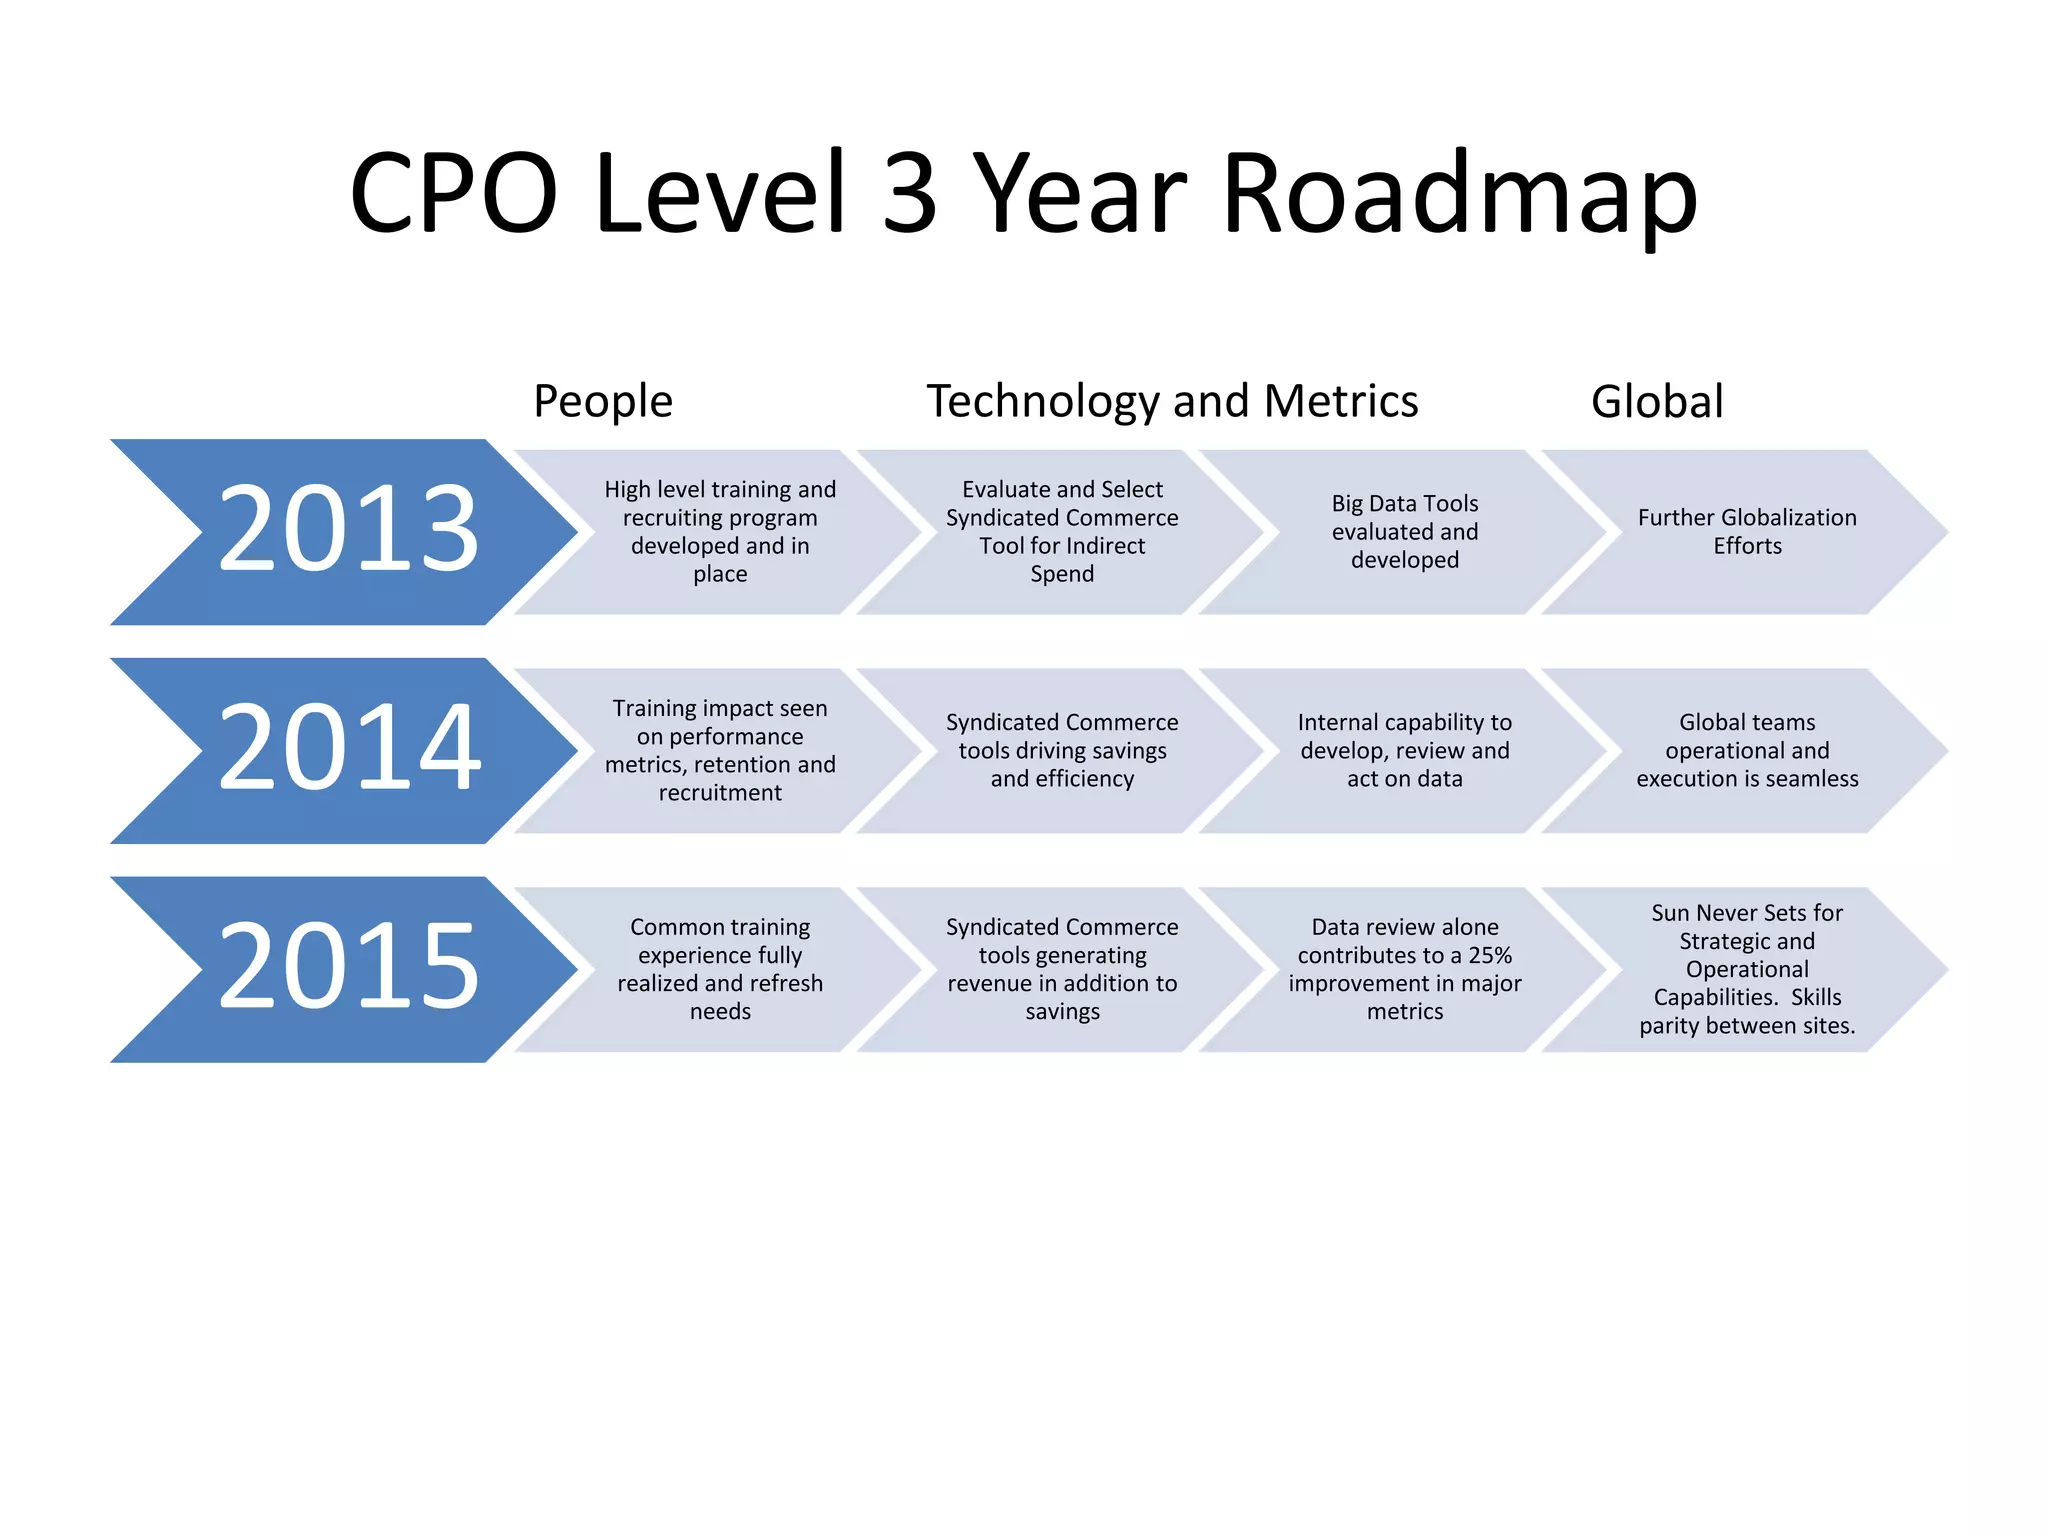
Purchasing Metrics Dashboard

 Prepared Formats for 2013 Planning
       and Quarterly Updates
               Bill Kohnen
Introduction
• Sample Purchasing metrics format with benchmark data. For 2013
  planning as well as regular reporting. Presentation is not locked so
  can modify for your organizations reporting needs.

• Includes general reporting for key supplier performance. These
  metrics probably most effective at Divisional level or organization
  up to 5 Billion in Revenue

• Reference to types of Supply Chain Corporate Social Responsibility
  Metrics being used. For more detailed example refer to
  multinational corporations such as Apple, Chevron etc. which report
  this publically in a separate annual report type format.

• Chief Purchasing Officer or VP Purchasing 3 year Strategic Road
  Map Example
Purchasing Metric Dashboard 2013
             Operational Benchmarks                                                                       Financial Benchmarks
8                                                                                        2.50%

6                                                                                        2.00%

                                                                                         1.50%
4                                                      Your Organization
                                                       Standard All Industries           1.00%                                                     Your Orgainization
2
                                                                                         0.50%                                                     Benchmark
0
                                                                                         0.00%
        Cost Savings (%)Purchasing Cycle Time (Days)
                                                                                 Purchasing Employees as Purchasing Expense as a % of Spend
                                                                                                         a % of Company Employees


             Annual Training Expense per Purchasing Employee                                                    Overall Look at spend
    $1,200                                                                                  50%
                                                                                            45%
    $1,000
                                                                                            40%
                                                                                            35%
     $800
                                                                                            30%
                                                       Your Organiztion                     25%
     $600                                                                                                                                             Your Organization
                                                                                            20%
                                                       Benchmark                                                                                      Benchmark
                                                                                            15%
     $400
                                                                                            10%
                                                                                             5%
     $200
                                                                                             0%
                                                                                                   Purchasing Spend as a %    % Of Suppliers
       $0                                                                                                  of Sales        accounting for 80% of
                  2012          2013 (Projected)                                                                                  Spend


Benchmark data from Center for Advanced Purchasing Studies published data July 2012
Sample Supplier Performance Metrics
               Overall Supplier                                                   Supplier Issues
                Performance
100
                                                                                                         Delivery
                                                                                                         Quality
50                                                                                                       Cost
                                                                                                         Support

 0
            2011                2012              2013
                                                                   Major Issues
           Key Supplier Audits Scheduled and Completed
      30                                                           Supplier   Item           Issue                  Action
      20                                        Audits Scheduled
                                                                   Alpha      Contract
                                                                              Production
                                                                                             Delivery because
                                                                                             capacity
                                                                                                                    Qualify second
                                                                                                                    site
                                                                                             constraint
      10                                        Audits Completed
                                                                   Bravo      Production     Process control        Joint
       0                                                                      Material       for UCL                Engineering
               2011      2012    2013 Planned                                                                       Review
                                                                   Charlie    Packaging      Cost Increase          New Source
                                                                   David      Equipment      Service                Hire our own
                                                                                             Reponse time           technicians
Most Organizations are also reporting Corporate
         Social responsibility Metrics
• % of Total spend with small and disadvangted business
  (US)

• Breakout of spending by location

• Breakout of Spending with Large and Small business

• Supplier audits planned and completed
   – Breakout of Labor, Environmental and other CSR
     compliance related level of compliance and findings
CPO Level 3 Year Roadmap
       People                       Technology and Metrics                            Global

2013
          High level training and    Evaluate and Select
                                                                Big Data Tools
           recruiting program       Syndicated Commerce                                 Further Globalization
                                                                evaluated and
            developed and in           Tool for Indirect                                       Efforts
                                                                  developed
                  place                     Spend


2014
          Training impact seen
                                    Syndicated Commerce      Internal capability to         Global teams
            on performance
                                     tools driving savings   develop, review and          operational and
          metrics, retention and
                                        and efficiency            act on data           execution is seamless
               recruitment


                                                                                         Sun Never Sets for


2015
            Common training         Syndicated Commerce        Data review alone
                                                                                            Strategic and
             experience fully          tools generating       contributes to a 25%
                                                                                             Operational
           realized and refresh     revenue in addition to   improvement in major
                                                                                         Capabilities. Skills
                  needs                     savings                  metrics
                                                                                        parity between sites.

Purchasing Metrics Dashboard - Bill Kohnen

  • 1.
    Purchasing Metrics Dashboard Prepared Formats for 2013 Planning and Quarterly Updates Bill Kohnen
  • 2.
    Introduction • Sample Purchasingmetrics format with benchmark data. For 2013 planning as well as regular reporting. Presentation is not locked so can modify for your organizations reporting needs. • Includes general reporting for key supplier performance. These metrics probably most effective at Divisional level or organization up to 5 Billion in Revenue • Reference to types of Supply Chain Corporate Social Responsibility Metrics being used. For more detailed example refer to multinational corporations such as Apple, Chevron etc. which report this publically in a separate annual report type format. • Chief Purchasing Officer or VP Purchasing 3 year Strategic Road Map Example
  • 3.
    Purchasing Metric Dashboard2013 Operational Benchmarks Financial Benchmarks 8 2.50% 6 2.00% 1.50% 4 Your Organization Standard All Industries 1.00% Your Orgainization 2 0.50% Benchmark 0 0.00% Cost Savings (%)Purchasing Cycle Time (Days) Purchasing Employees as Purchasing Expense as a % of Spend a % of Company Employees Annual Training Expense per Purchasing Employee Overall Look at spend $1,200 50% 45% $1,000 40% 35% $800 30% Your Organiztion 25% $600 Your Organization 20% Benchmark Benchmark 15% $400 10% 5% $200 0% Purchasing Spend as a % % Of Suppliers $0 of Sales accounting for 80% of 2012 2013 (Projected) Spend Benchmark data from Center for Advanced Purchasing Studies published data July 2012
  • 4.
    Sample Supplier PerformanceMetrics Overall Supplier Supplier Issues Performance 100 Delivery Quality 50 Cost Support 0 2011 2012 2013 Major Issues Key Supplier Audits Scheduled and Completed 30 Supplier Item Issue Action 20 Audits Scheduled Alpha Contract Production Delivery because capacity Qualify second site constraint 10 Audits Completed Bravo Production Process control Joint 0 Material for UCL Engineering 2011 2012 2013 Planned Review Charlie Packaging Cost Increase New Source David Equipment Service Hire our own Reponse time technicians
  • 5.
    Most Organizations arealso reporting Corporate Social responsibility Metrics • % of Total spend with small and disadvangted business (US) • Breakout of spending by location • Breakout of Spending with Large and Small business • Supplier audits planned and completed – Breakout of Labor, Environmental and other CSR compliance related level of compliance and findings
  • 6.
    CPO Level 3Year Roadmap People Technology and Metrics Global 2013 High level training and Evaluate and Select Big Data Tools recruiting program Syndicated Commerce Further Globalization evaluated and developed and in Tool for Indirect Efforts developed place Spend 2014 Training impact seen Syndicated Commerce Internal capability to Global teams on performance tools driving savings develop, review and operational and metrics, retention and and efficiency act on data execution is seamless recruitment Sun Never Sets for 2015 Common training Syndicated Commerce Data review alone Strategic and experience fully tools generating contributes to a 25% Operational realized and refresh revenue in addition to improvement in major Capabilities. Skills needs savings metrics parity between sites.