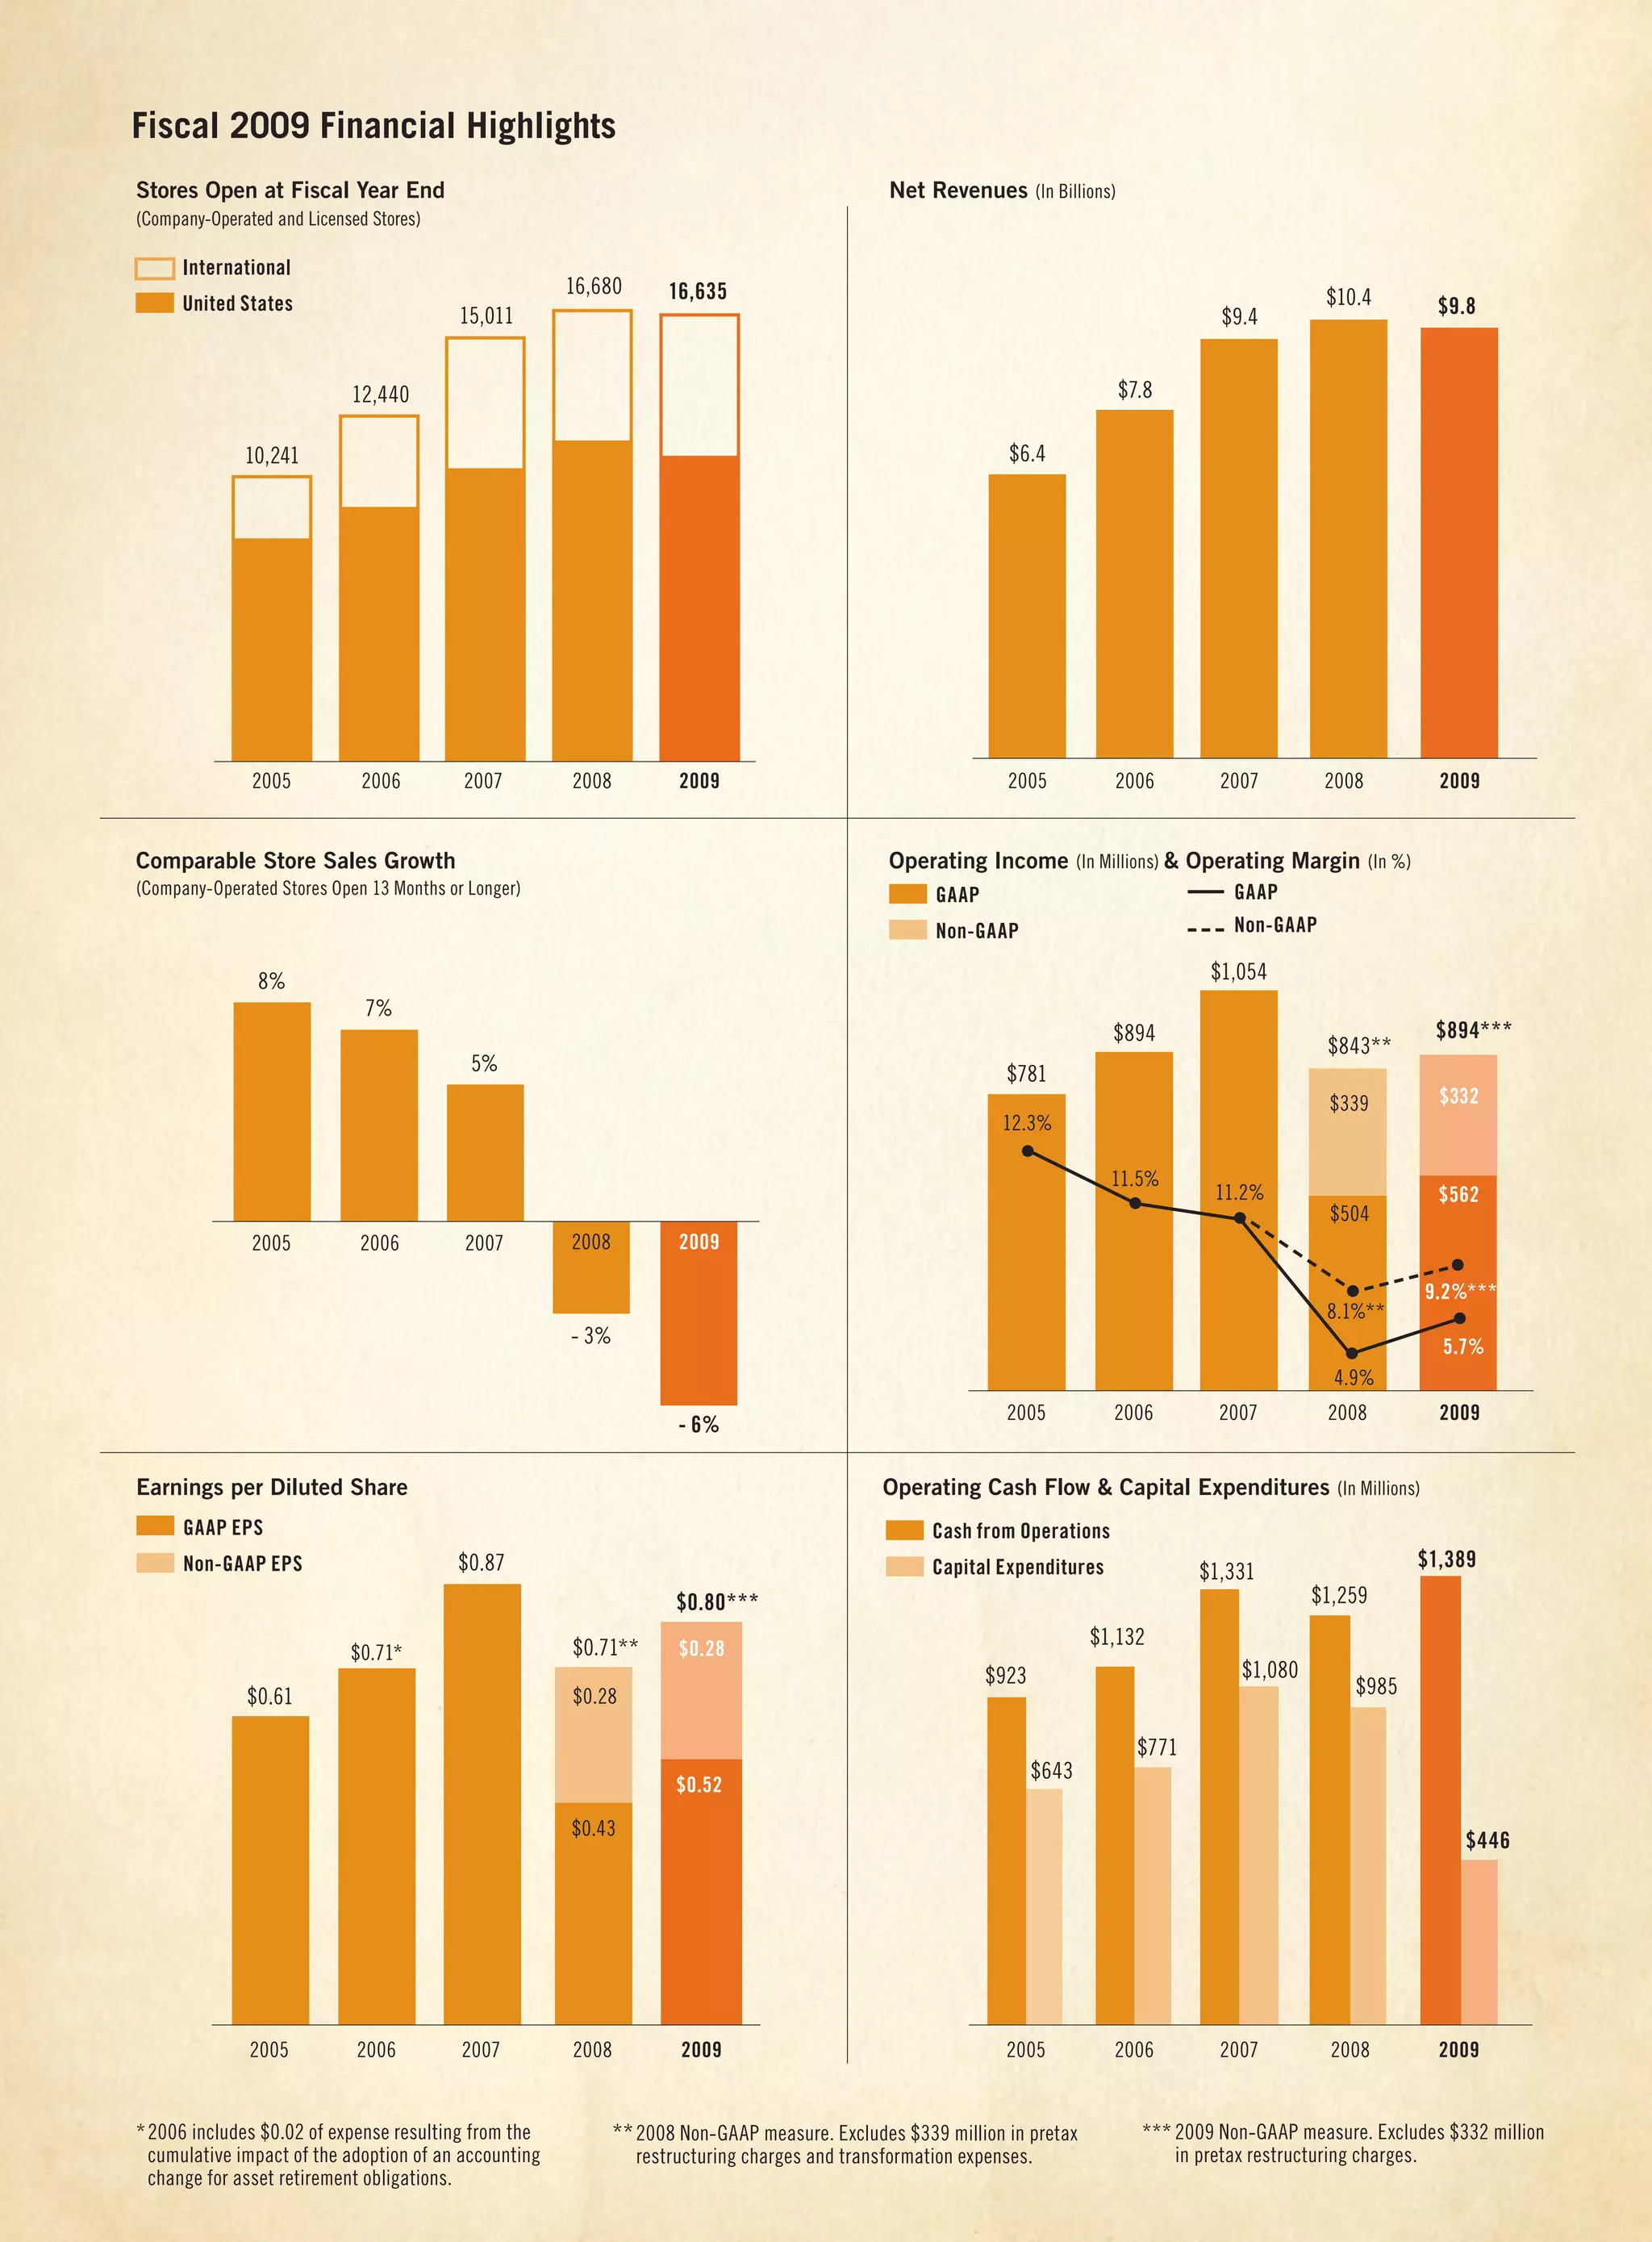
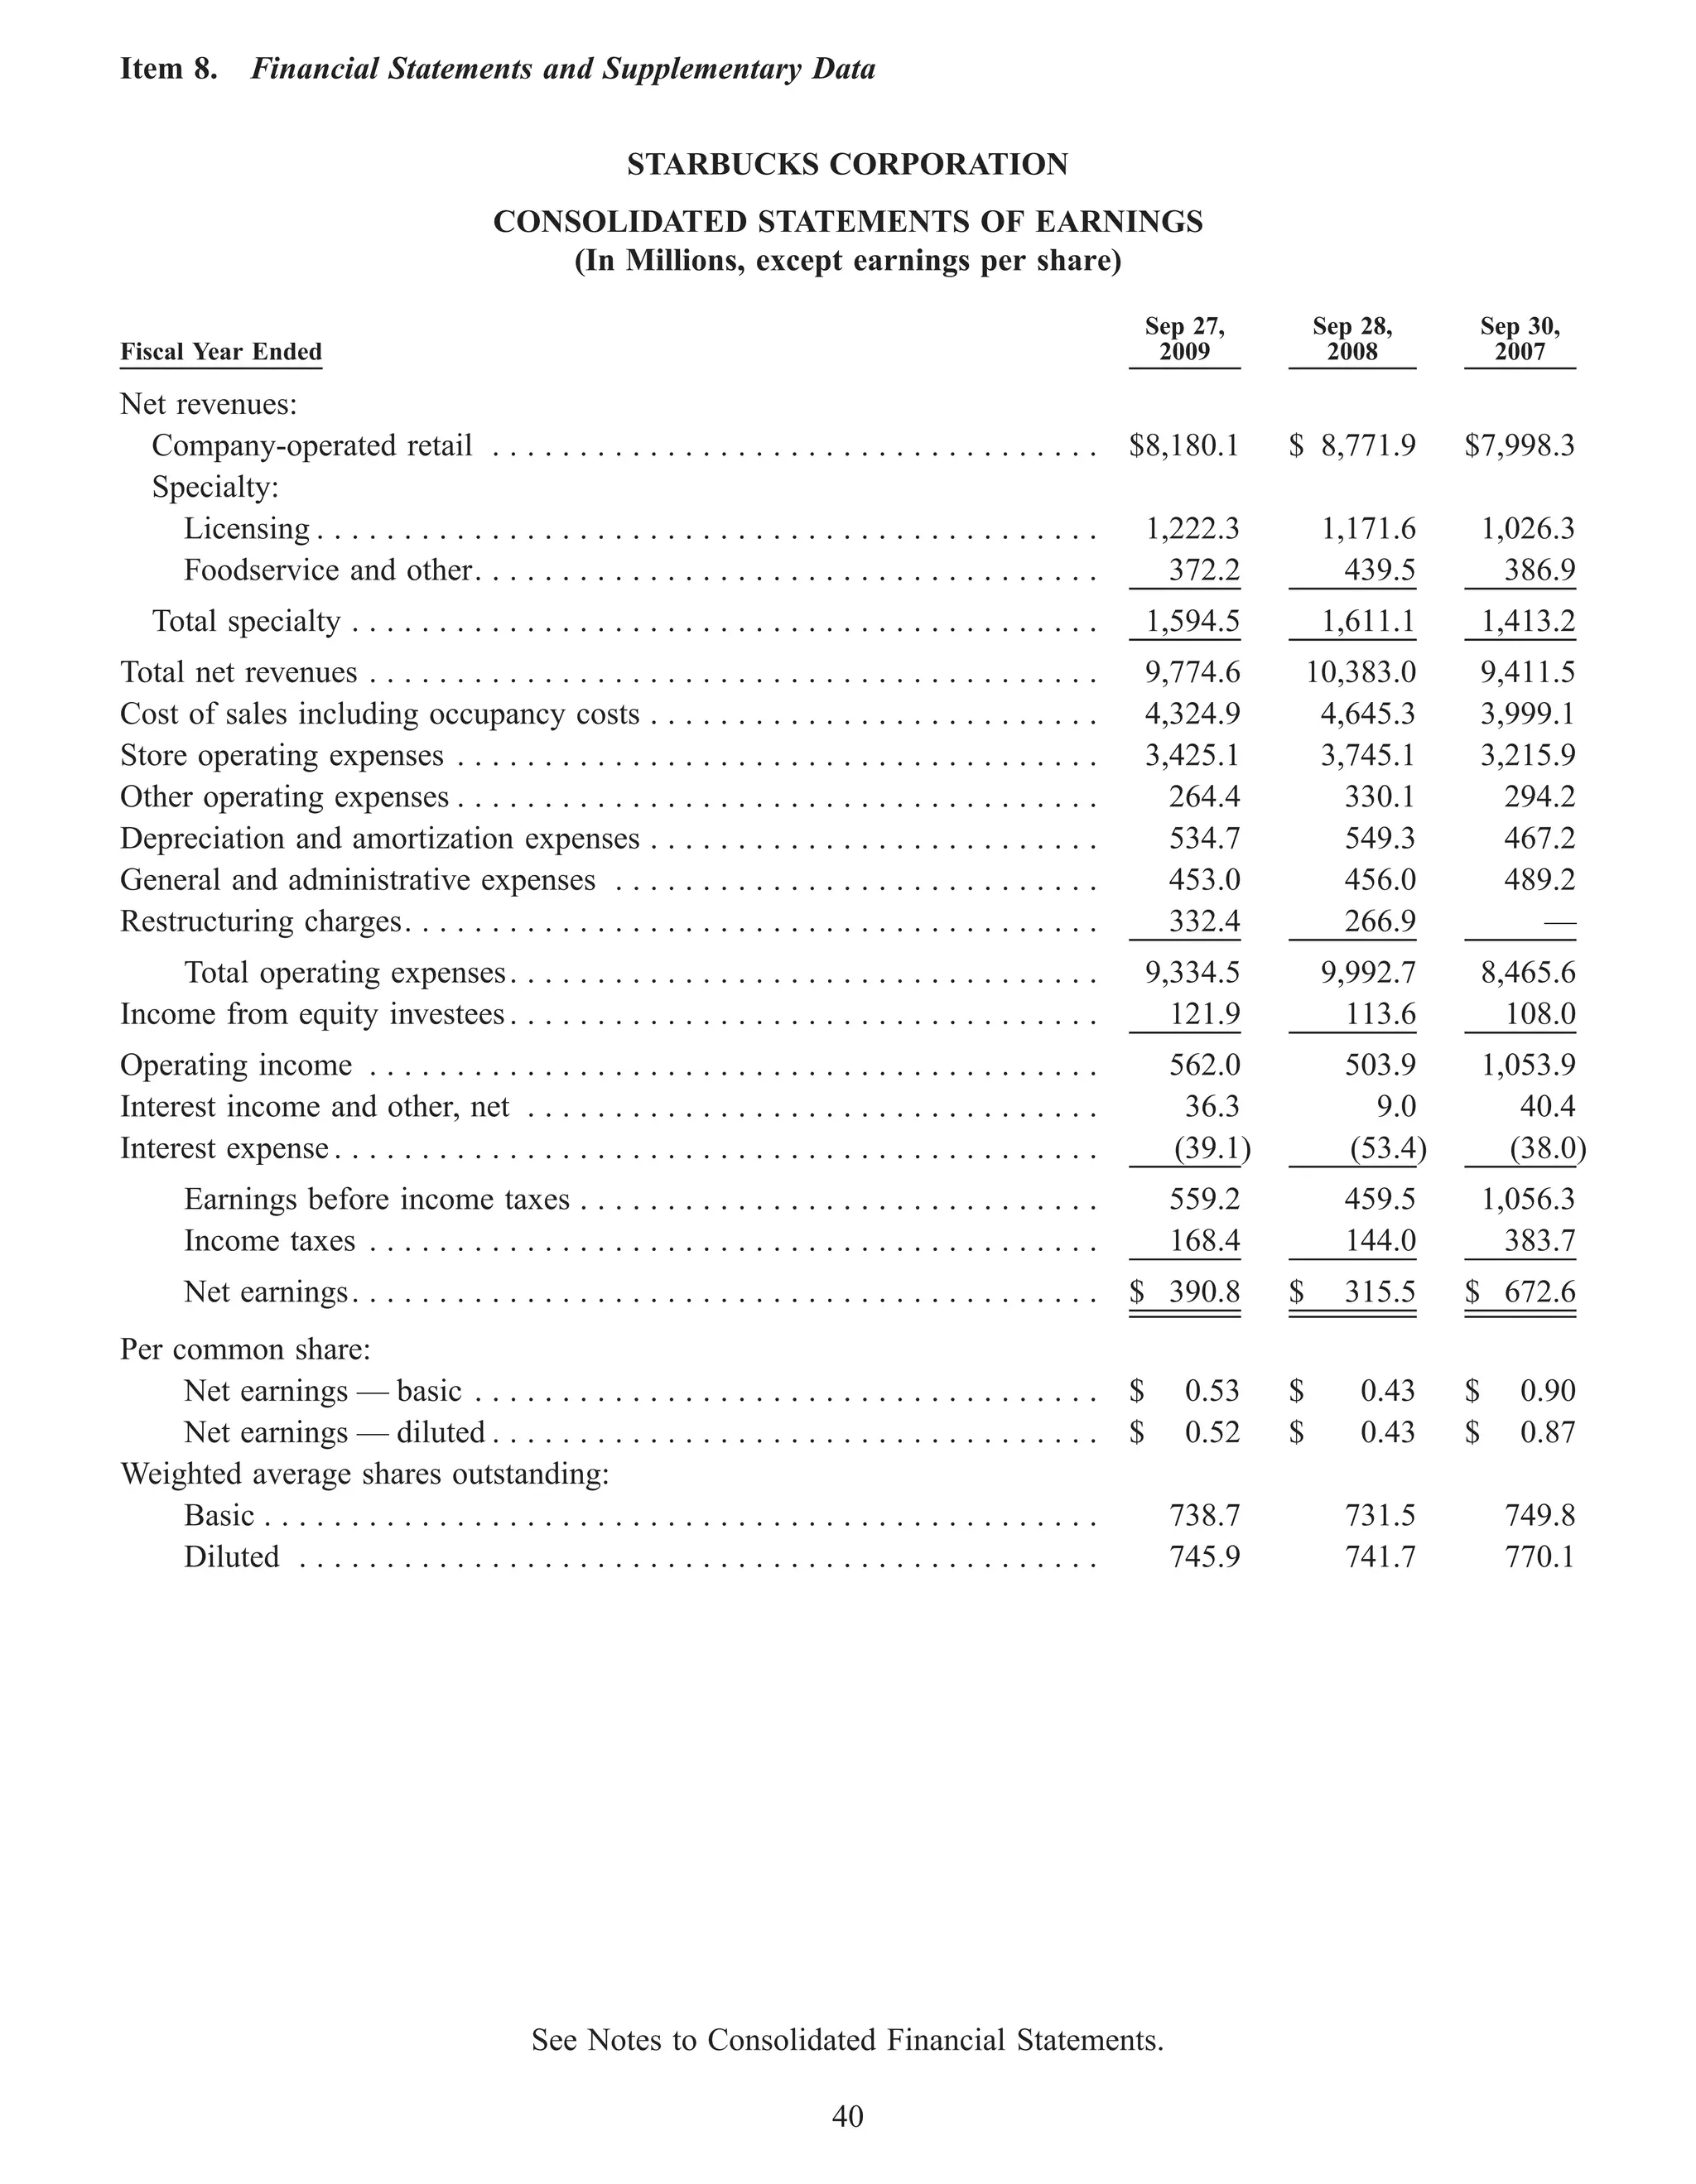
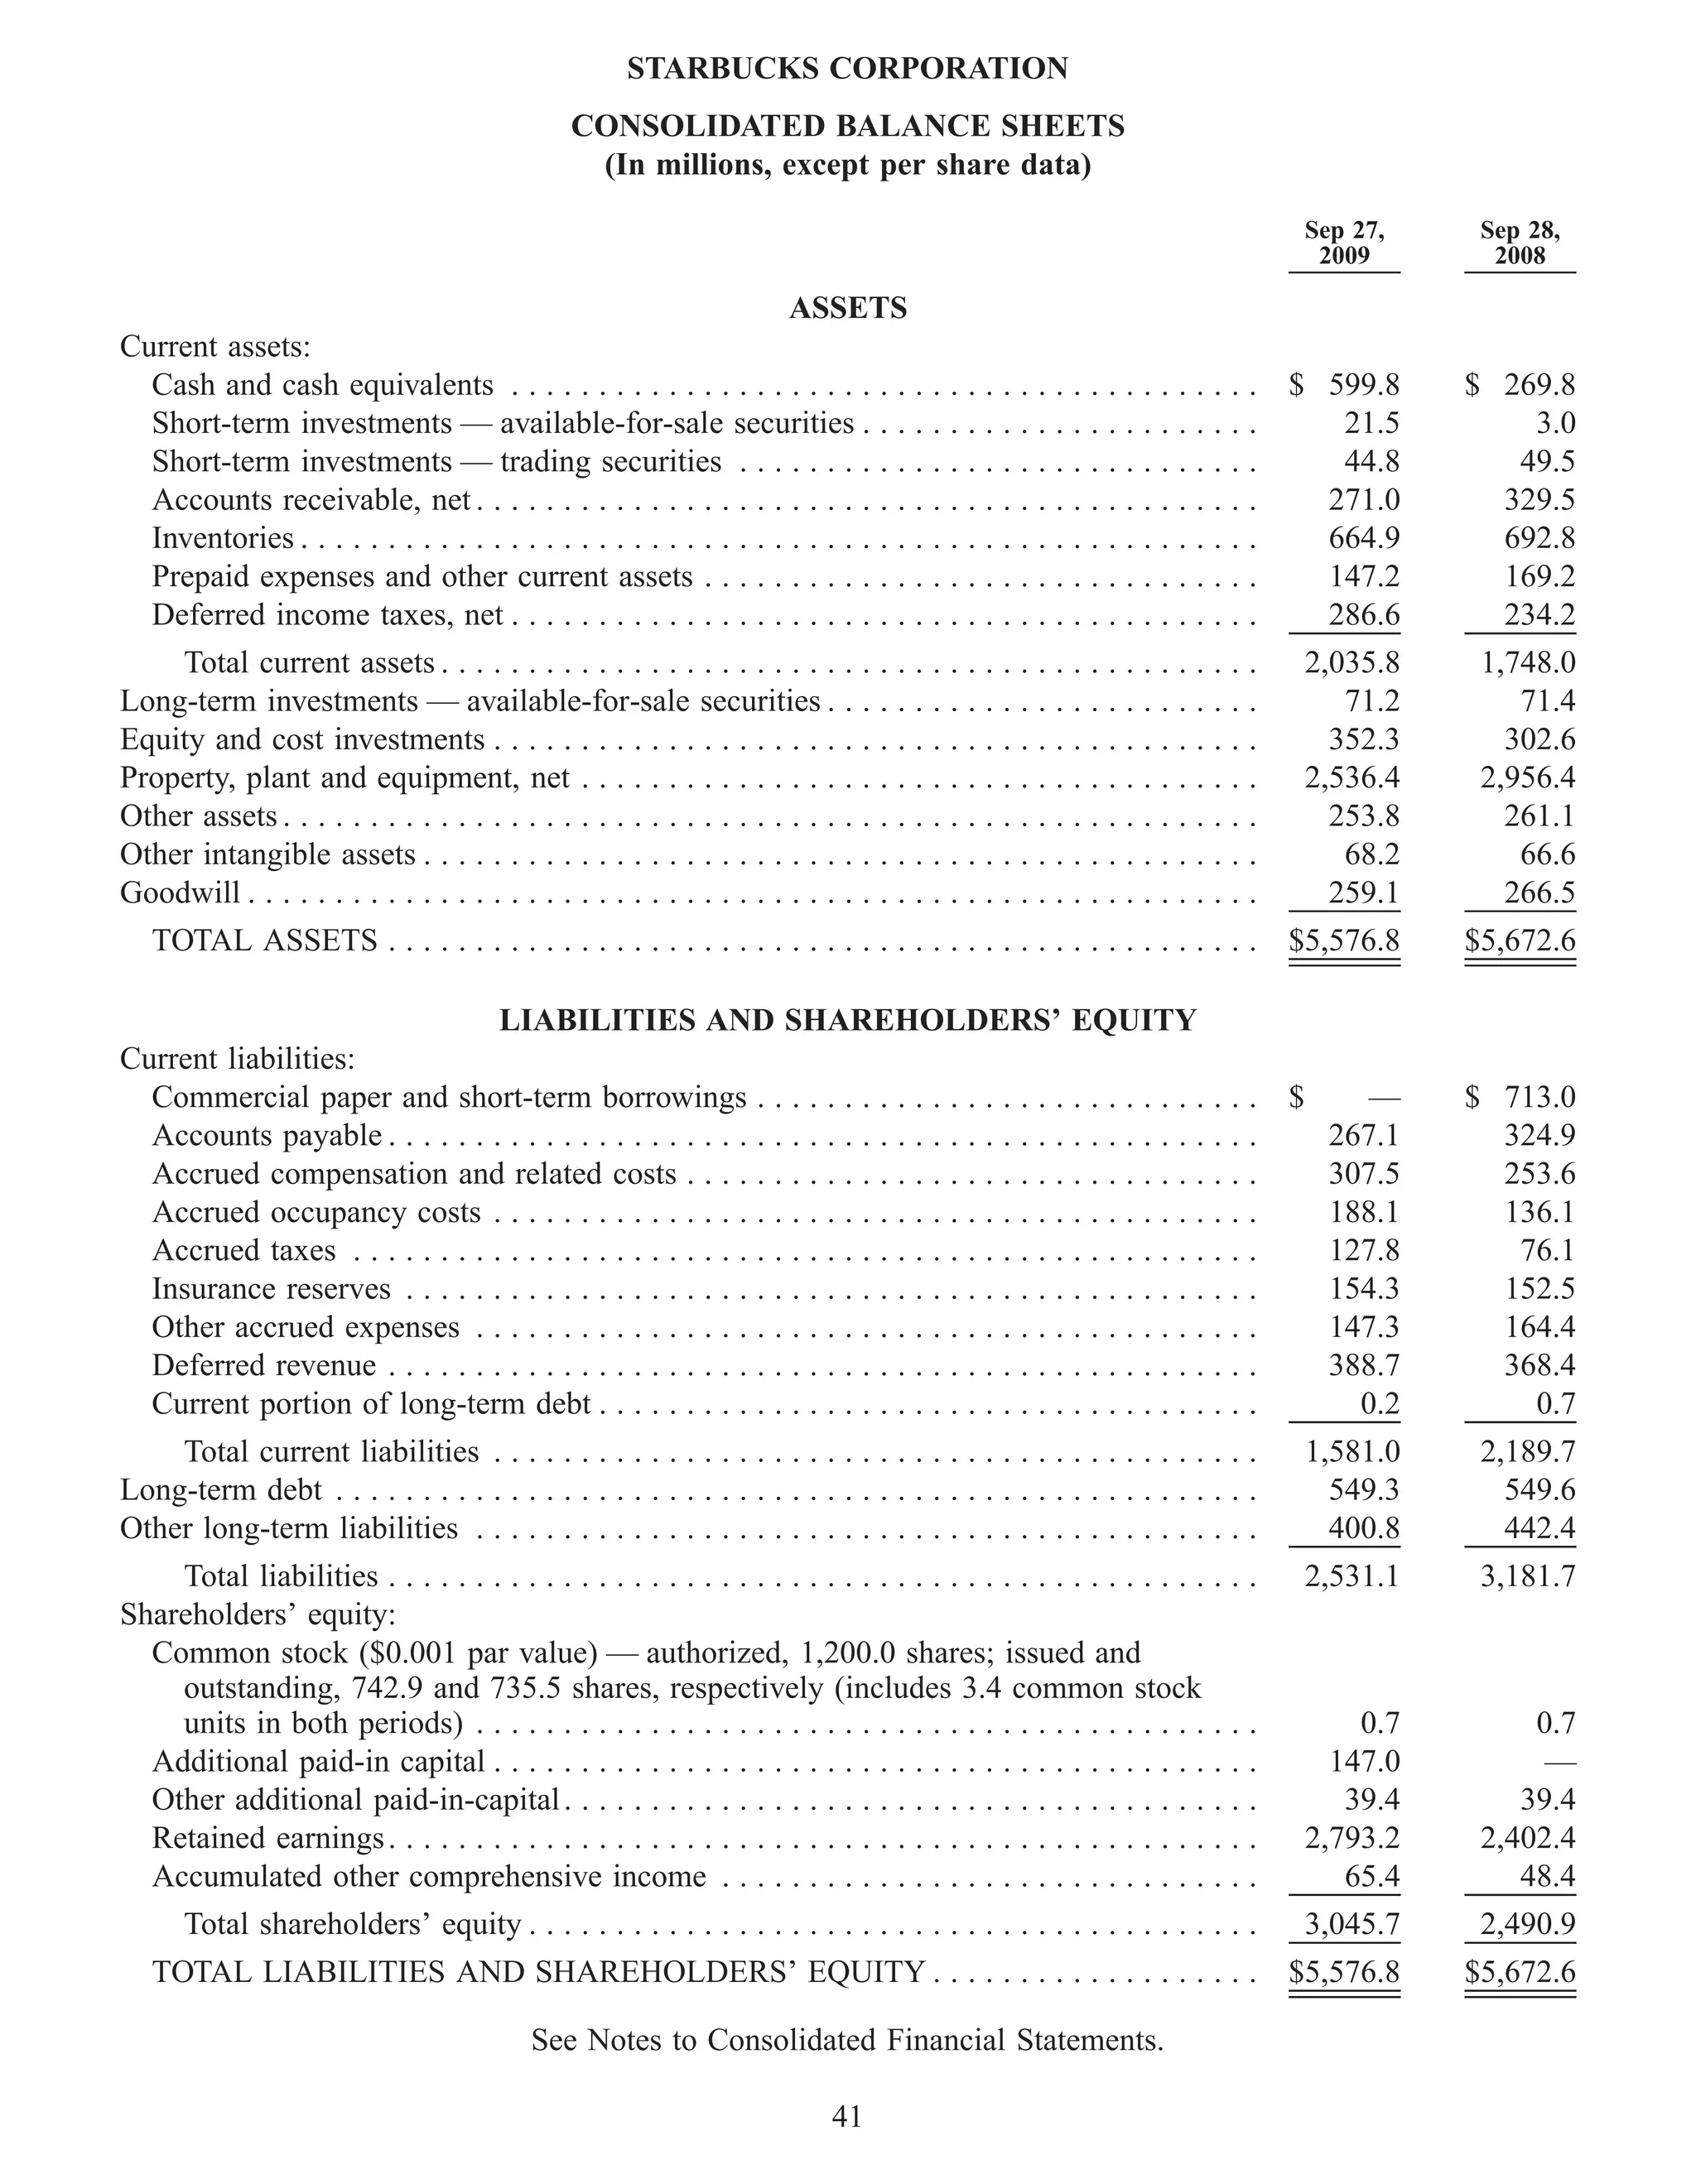
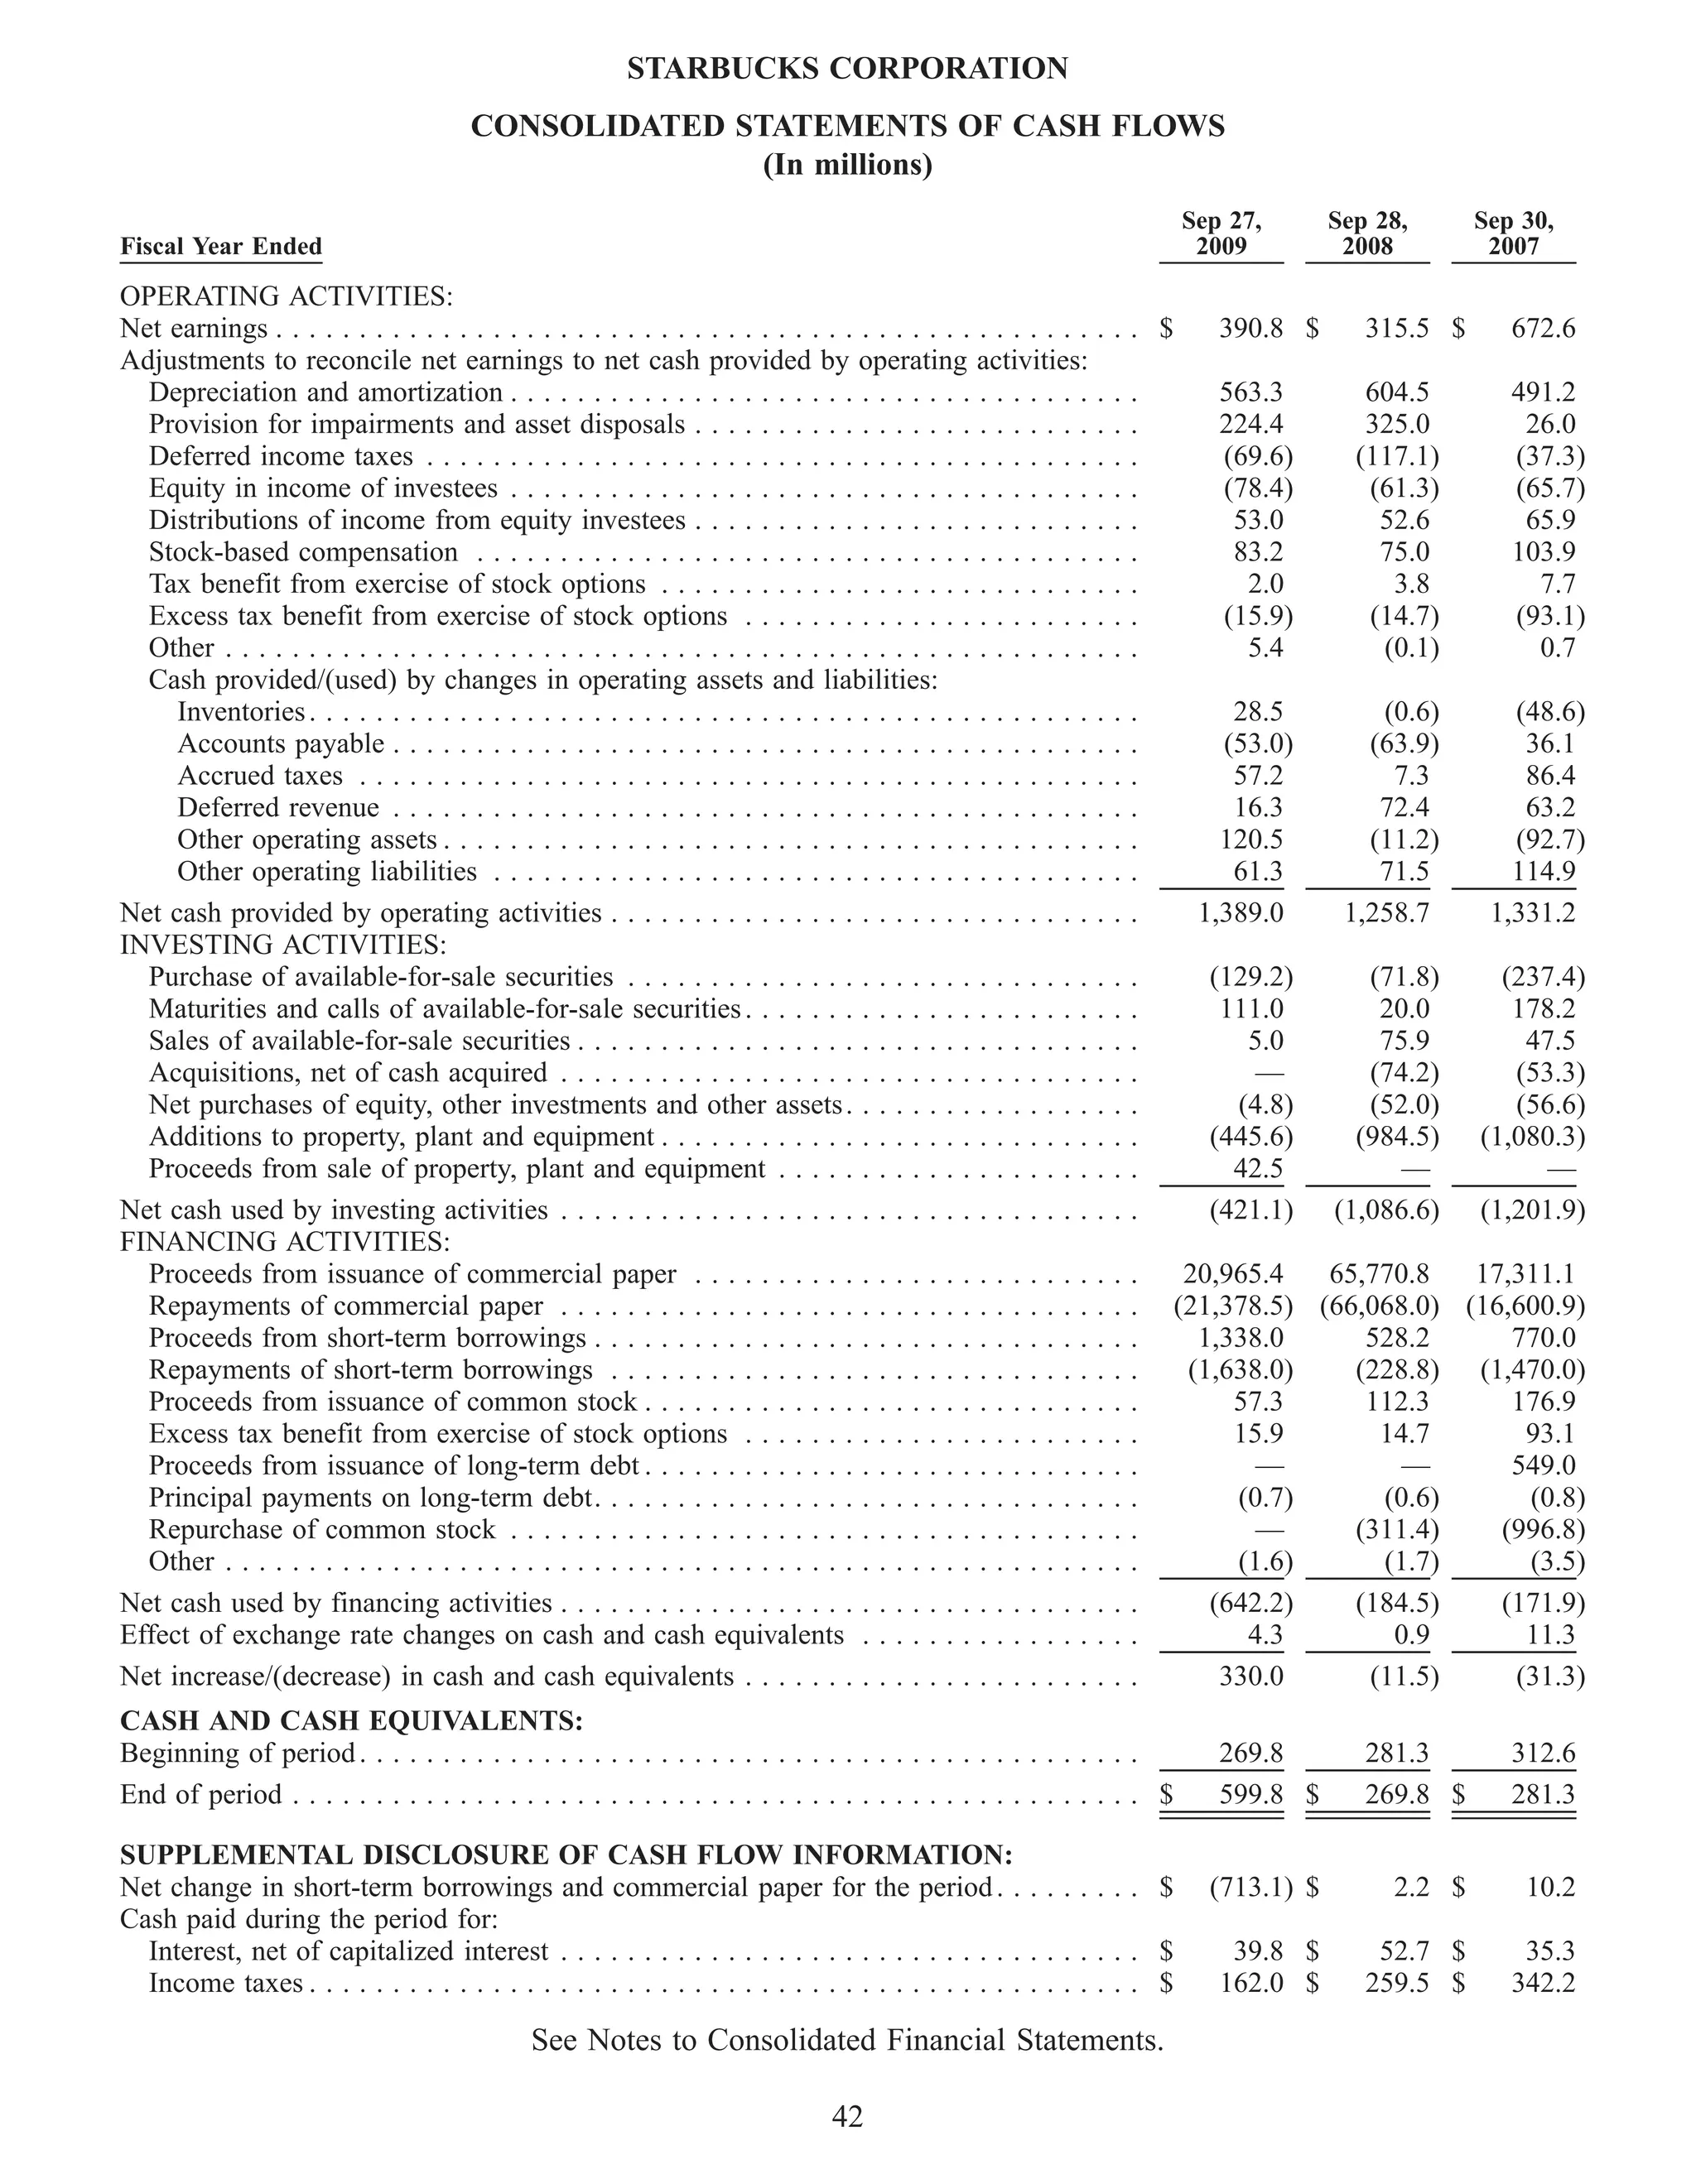
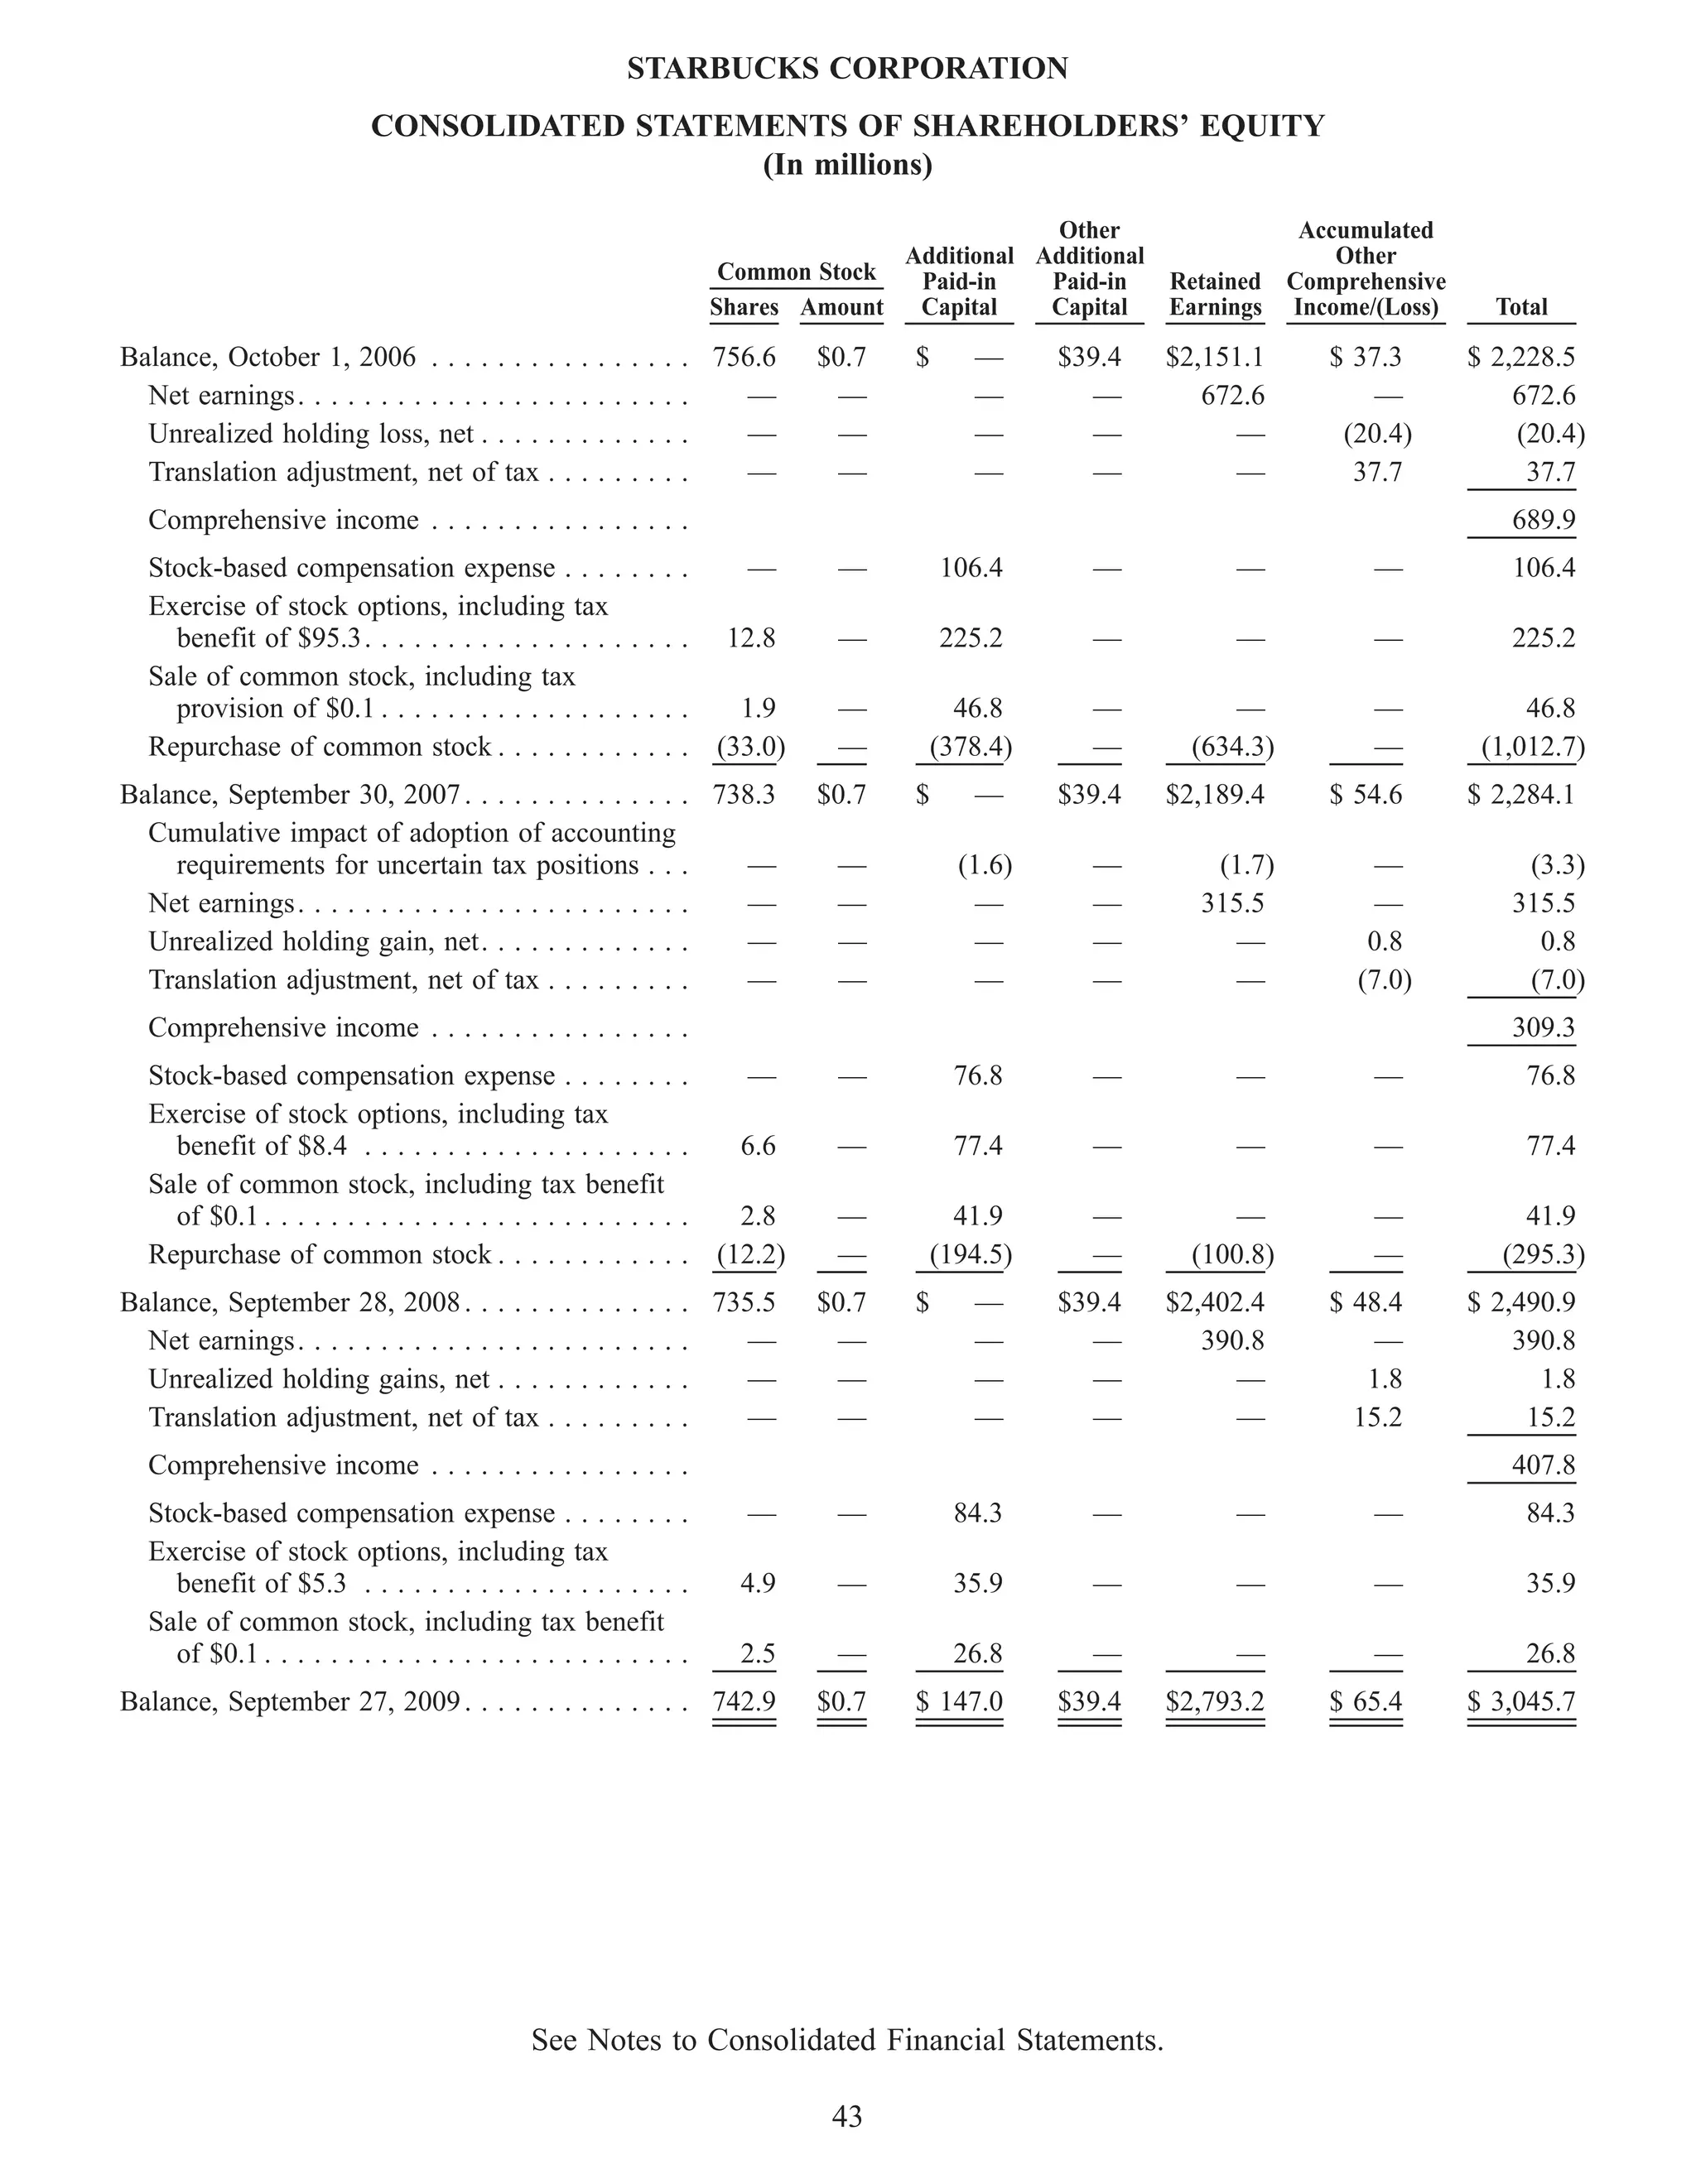
Starbucks Corporation Fiscal 2009 Annual Report
Fiscal 2009 Financial Highlights
Stores Open at Fiscal Year End                                                                 Net Revenues (In Billions)
(Company-Operated and Licensed Stores)

      International
                                                       16,680       16,635                                                                          $10.4
      United States                                                                                                                                               $9.8
                                         15,011                                                                                         $9.4


                            12,440                                                                                           $7.8

              10,241                                                                                           $6.4


               2005           2006        2007         2008           2009                                    2005          2006        2007        2008          2009


Comparable Store Sales Growth                                                                  Operating Income (In Millions) & Operating Margin (In %)
(Company-Operated Stores Open 13 Months or Longer)                                                   GAAP                                GAAP
                                                                                                     Non-GAAP                            Non-GAAP

                8%                                                                                                                     $1,054
                              7%
                                                                                                                            $894                                  $894***
                                                                                                                                                     $843**
                                           5%                                                                 $781
                                                                                                                                                     $339         $332
                                                                                                              12.3%

                                                                                                                            11.5%
                                                                                                                                       11.2%                      $562
                                                                                                                                                     $504
               2005          2006         2007         2008           2009

                                                                                                                                                                9.2%***
                                                                                                                                                     8.1%**
                                                       - 3%                                                                                                       5.7%
                                                                                                                                                     4.9%
                                                                                                              2005          2006        2007         2008         2009
                                                                      - 6%

Earnings per Diluted Share                                                                     Operating Cash Flow & Capital Expenditures (In Millions)
      GAAP EPS                                                                                       Cash from Operations
      Non-GAAP EPS                       $0.87                                                       Capital Expenditures                                      $1,389
                                                                                                                                      $1,331
                                                                     $0.80***                                                                      $1,259

                                                       $0.71**        $0.28
                                                                                                                          $1,132
                            $0.71*
                                                                                                            $923                          $1,080
              $0.61                                    $0.28                                                                                            $985

                                                                                                                               $771
                                                                                                                   $643
                                                                     $0.52

                                                       $0.43
                                                                                                                                                                     $446


               2005          2006         2007         2008           2009                                    2005          2006        2007         2008         2009


* 2006 includes $0.02 of expense resulting from the           ** 2008 Non-GAAP measure. Excludes $339 million in pretax        *** 2009 Non-GAAP measure. Excludes $332 million
  cumulative impact of the adoption of an accounting            restructuring charges and transformation expenses.                 in pretax restructuring charges.
  change for asset retirement obligations.
Dear Shareholders,
In my letter to you two years ago, I expressed concern over challenges confronting our business of a breadth and
magnitude unlike anything I had ever seen before. For the first time, we were beginning to see traffic in our U.S. stores
slow. Strong competitors were entering our business. And perhaps most troublesome, where in the past Starbucks had
always been forward-thinking and nimble in its decision-making and execution, like many fast-growing companies before
us, we had allowed our success to make us complacent.

As I returned to the role of president and chief executive officer, it was obvious to me, and to our leadership team, that
Starbucks needed nothing less than a full-fledged transformation to return to profitable growth. Since then, we have
worked through the multitude of challenges required to revitalize our brand and transform our company—all in the face
of the worst global economic environment of our generation.

Today, I am pleased to report that we have made and continue to make significant progress in transforming Starbucks
and returning the company to sustainable, profitable growth while preserving our values and guiding principles.

Our Transformation Journey
Our blueprint for change was the transformation agenda: improving the state of
our business through better training, tools and products; renewing our attention
to store-level economics and operating efficiency; reigniting our emotional
attachment with customers; and realigning Starbucks organization for the long
term. In fiscal 2009, the seeds of our transformation began to take root.

Disciplined Operations
We applied rigor and discipline to all areas of the business and put sharp focus
on unit economics. We focused on operational excellence—from supply chain
to back-end IT systems to store operations. We also developed a better go-to-
market engine, with stronger creative execution and more effective channels
to reach our customers. Together, these efforts are enabling us to make better-
informed decisions—and to bring products and initiatives to market faster and
more cost effectively. At the same time, we took steps to permanently improve
our cost structure, which resulted in removing $580 million in costs from the
business in fiscal 2009 alone.

But it was clear to us that cost reductions and improved operating efficiencies
alone were not enough. True transformation would require us to improve our
customer experience, and to once again aggressively differentiate and innovate.

Innovating for a Better Customer Experience
In conjunction with our focus on operations, we made significant investments to improve the customer experience in our
stores. Our store partners have made measurable improvements in service, beverage quality and store condition. As a
result, over the past fiscal year, our already high customer satisfaction scores have increased a full 10 percentage points.
For this, I applaud our store partners all over the world, who define the Starbucks Experience one cup at a time, every day.

As consumer trends evolved in the face of the weakening global economy, we responded quickly with relevant innovation
in our loyalty card program and with compelling value offerings and innovative food pairings. We elevated and reaffirmed
our leadership in coffee quality, evolving our sustainable sourcing, roasting and blending approaches. We also renewed
our commitment to espresso excellence, ensuring that we are providing the highest-quality handcrafted, customized
beverages to suit every customer’s taste. The results have validated our focus. Sales of Starbucks® Anniversary Blend
coffee exceeded those of any year since it launched in 1996. Our partnership with (RED)™ continues to outperform
expectations, generating enough money during its first year to buy more than seven million daily doses of medicine to help
fight AIDS in Africa. Our decision to offer both Pike Place Roast™ and a bolder roast profile with fresher brew times has
been extremely well received by our core customers. And our seasonal beverages such as Pumpkin Spice Latte and
Caramel Brulée Latte were customer favorites this holiday season.

As consumers have increasingly requested healthier food choices, we responded by offering new products with whole
grains and other wholesome ingredients. We also thoroughly revamped our food offerings: simplifying recipes and taking
out artificial trans fat, high-fructose corn syrup and artificial flavors and dyes. Customers will continue to see improved
choices and an expanded menu of healthier food choices in the months and year ahead.

We applied technology to revolutionize the way we communicate with consumers through social and digital media.
Starbucks has been named the most engaged consumer brand, using communities such as Facebook, Twitter and
My Starbucks Idea to connect with our customers outside the store environment. We are in constant dialogue with our
customers, allowing us to understand their needs and stay top-of-mind in this increasingly competitive retail environment.
We also launched popular iPhone applications to help customers find our stores, determine nutrition information and reload
their Starbucks Cards.

In fiscal 2009, we unveiled a bold and innovative store design approach, with new concepts in Seattle, Paris and London—all
enthusiastically received. All newly constructed company-operated stores worldwide will be LEED®-certified beginning this
calendar year, moving us closer to our goal of significantly reducing our environmental footprint. This initiative, coupled with
locally relevant store designs and renovations, is helping us form deep and long-lasting connections with customers in their
own neighborhoods.

Finally, we stayed true to who we are and our mission to inspire and nurture the human spirit—one person, one cup and one
neighborhood at a time. For our partners, despite economic pressure, we continued to offer health care benefits to eligible full-
and part-time partners, something we have done for over 20 years. We were also proud to be able to contribute a match under
our 401(k) program this year—another benefit that many companies retreated from in 2009.

We reaffirmed our commitment to doing business responsibly. This year we became the world’s largest purchaser of Fair Trade
Certified™ coffee and partnered with Conservation International to address climate change in coffee-growing regions. And we
continued to give back to the communities we serve through volunteer activities and community programs. These efforts are
also good business, as consumers increasingly want to build relationships with companies that share their values.

Our Path Forward
With our progress over the past two years, we are now in a position to take advantage of the global opportunity for Starbucks.
Improvements in the U.S. business will allow us to pursue disciplined new store growth internationally. While Starbucks now
operates in more than 50 countries (we added Portugal, Bulgaria and Poland in fiscal 2009), we are still in the early stages of
international growth. We expect future growth for Starbucks to come from deeper expansion in markets where we already have
a strong presence, such as the UK, Canada and Japan. Our progress in China continues, and we believe it will one day be the
largest market for Starbucks outside the U.S.

As part of our international strategy, we will also seize opportunities to move beyond our retail stores. Extending our profitable
global consumer products group allows us to reach more customers in more places, and we plan to grow this business at an
accelerated pace around the world. We see significant runway for CPG to grow, and we will be poised to capture that
opportunity with an evolution of our distribution structure and with an increasing variety of offerings in the grocery channel.

Our future lies in our ability to innovate, to be forward-thinking and nimble. In fiscal 2009, we wrote a new playbook for just
that with the launch of Starbucks VIA™ Ready Brew. We have been extremely excited to see our customers in North America
embrace this 100 percent natural roasted soluble coffee that maintains the high standards of quality and taste of freshly
brewed Starbucks® coffee. This is a substantial new global growth platform within our core business, representing the first
significant innovation in more than 50 years in the $21 billion global instant coffee category. Starbucks VIA™ also gives
customers an easy and affordable single-serve option at home and on-the-go. We look forward to extending the product
internationally—both in our stores and in grocery channels—in fiscal 2010.

Another growth vehicle will be Seattle’s Best Coffee. Our research tells us we can aggressively position SBC with new
customers, and we plan to create compelling franchising and distribution opportunities in 2010. We have ambitious goals for
the brand and look forward to making some big moves in the coming months.

I am incredibly proud of the loyalty, commitment, passion and tireless efforts of our partners all over the world. Because of
them we have been able to successfully navigate some formidable and dangerous headwinds, and to emerge a better and
stronger company than we have ever been—ideally positioned to grow and capitalize on global opportunities in the years
ahead. I am as optimistic about Starbucks future as I have ever been.

In closing, I would like to offer my heartfelt thanks to everyone who touches Starbucks. To our people, who stepped up to the
challenge of delivering an exceptional customer experience, to the farmers and suppliers who grow our coffee, to our business
partners around the world, to our shareholders for their continued support, and ultimately to our customers—for inviting us
into their lives and for giving us the opportunity to earn their loyalty and trust every day.

Warm regards,


Howard Schultz
chairman, president and chief executive officer
UNITED STATES SECURITIES AND EXCHANGE COMMISSION
                                                Washington, DC 20549
                                                     Form 10-K
    ¥         ANNUAL REPORT PURSUANT TO SECTION 13 OR 15(d)
              OF THE SECURITIES EXCHANGE ACT OF 1934
                                     For the fiscal year ended September 27, 2009
                                                           or
    n         TRANSITION REPORT PURSUANT TO SECTION 13 OR 15(d)
              OF THE SECURITIES EXCHANGE ACT OF 1934
                                      For the transition period from   to                        .
                                           Commission File Number: 0-20322

                               Starbucks Corporation
                                        (Exact Name of Registrant as Specified in Its Charter)
                        Washington                                                               91-1325671
                    (State of Incorporation)                                                 (IRS Employer ID)
                                                  2401 Utah Avenue South
                                                 Seattle, Washington 98134
                                                       (206) 447-1575
                                 (Address of principal executive offices, zip code, telephone number)
                            Securities Registered Pursuant to Section 12(b) of the Act:
                     Title of Each Class                                      Name of Each Exchange on Which Registered
       Common Stock, $0.001 par value per share                                 Nasdaq Global Select Market
                             Securities Registered Pursuant to Section 12(g) of the Act:
                                                              None
Indicate by check mark if the registrant is a well-known seasoned issuer, as defined in Rule 405 of the Securities
Act. Yes ¥          No n
Indicate by check mark if the registrant is not required to file reports pursuant to Section 13 or Section 15(d) of the
Act. Yes n          No ¥
Indicate by check mark whether the registrant: (1) has filed all reports required to be filed by Section 13 or 15(d) of the
Securities Exchange Act of 1934 during the preceding 12 months (or for such shorter period that the registrant was
required to file such reports), and (2) has been subject to such filing requirements for the past 90 days. Yes ¥        No n
Indicate by check mark whether the registrant has submitted electronically and posted on its corporate Web site, if any,
every Interactive Data File required to be submitted and posted pursuant to Rule 405 of Regulation S-T (§ 232.405 of this
chapter) during the preceding 12 months (or for such shorter period that the registrant was required to submit and post
such files). Yes ¥         No n
Indicate by check mark if disclosure of delinquent filers pursuant to Item 405 of Regulation of S-K is not contained herein,
and will not be contained, to the best of the registrant’s knowledge, in definitive proxy or information statements
incorporated by reference in Part III of this Form 10-K or any amendment to this Form 10-K. ¥
Indicate by check mark whether the registrant is a large accelerated filer, an accelerated filer, a non-accelerated filer, or a
smaller reporting company. See the definitions of “large accelerated filer,” “accelerated filer” and “smaller reporting
company” in Rule 12b-2 of the Exchange Act. (Check one):
Large accelerated filer ¥          Accelerated filer n         Non-accelerated filer n         Smaller reporting company n
                                                   (Do not check if a smaller reporting company)
Indicate by check mark whether the registrant is a shell company (as defined in Rule 12b-2 of the Exchange
Act). Yes n          No ¥
The aggregate market value of the voting stock held by non-affiliates of the registrant as of the last business day of the
registrant’s most recently completed second fiscal quarter, based upon the closing sale price of the registrant’s common
stock on March 27, 2009 as reported on the NASDAQ Global Select Market was $8.4 billion. As of November 13, 2009,
there were approximately 740.2 million shares of the registrant’s Common Stock outstanding.
                                  DOCUMENTS INCORPORATED BY REFERENCE
Portions of the definitive Proxy Statement for the registrant’s Annual Meeting of Shareholders to be held on March 24,
2010 have been incorporated by reference into Part III of this Annual Report on Form 10-K.
STARBUCKS CORPORATION
                                                                      Form 10-K
                                           For the Fiscal Year Ended September 27, 2009
                                                            TABLE OF CONTENTS

                                                                      PART I
Item   1      Business . . . . . . . . . . . . . . . . . . . . . . . . . . . . . . . . . . . . . . . . . . . . . . . . . . . . . . . . . . . . . . . . .     1
Item   1A     Risk Factors . . . . . . . . . . . . . . . . . . . . . . . . . . . . . . . . . . . . . . . . . . . . . . . . . . . . . . . . . . . . . .       8
Item   1B     Unresolved Staff Comments . . . . . . . . . . . . . . . . . . . . . . . . . . . . . . . . . . . . . . . . . . . . . . . . . .                 14
Item   2      Properties . . . . . . . . . . . . . . . . . . . . . . . . . . . . . . . . . . . . . . . . . . . . . . . . . . . . . . . . . . . . . . . .    14
Item   3      Legal Proceedings . . . . . . . . . . . . . . . . . . . . . . . . . . . . . . . . . . . . . . . . . . . . . . . . . . . . . . . . . .         14
Item   4      Submission of Matters to a Vote of Security Holders . . . . . . . . . . . . . . . . . . . . . . . . . . . . . . . .                           14

                                                           PART II
Item 5  Market for the Registrant’s Common Equity, Related Shareholder Matters and Issuer Purchases
        of Equity Securities. . . . . . . . . . . . . . . . . . . . . . . . . . . . . . . . . . . . . . . . . . . . . . . . . . . . . . . . .               17
Item 6  Selected Financial Data . . . . . . . . . . . . . . . . . . . . . . . . . . . . . . . . . . . . . . . . . . . . . . . . . . . . . .                 19
Item 7  Management’s Discussion and Analysis of Financial Condition and Results of Operations . . . . .                                                     21
Item 7A Quantitative and Qualitative Disclosures About Market Risk . . . . . . . . . . . . . . . . . . . . . . . . . .                                      39
Item 8  Financial Statements and Supplementary Data . . . . . . . . . . . . . . . . . . . . . . . . . . . . . . . . . . . . .                               40
        Report of Independent Registered Public Accounting Firm . . . . . . . . . . . . . . . . . . . . . . . . . . . .                                     78
Item 9  Changes in and Disagreements with Accountants on Accounting and Financial Disclosure . . . .                                                        79
Item 9A Controls and Procedures . . . . . . . . . . . . . . . . . . . . . . . . . . . . . . . . . . . . . . . . . . . . . . . . . . . . .                   79
Item 9B Other Information . . . . . . . . . . . . . . . . . . . . . . . . . . . . . . . . . . . . . . . . . . . . . . . . . . . . . . . . . .               81

                                                                      PART III
Item 10       Directors, Executive Officers and Corporate Governance . . . . . . . . . . . . . . . . . . . . . . . . . . . . .                              81
Item 11       Executive Compensation . . . . . . . . . . . . . . . . . . . . . . . . . . . . . . . . . . . . . . . . . . . . . . . . . . . . .              81
Item 12       Security Ownership of Certain Beneficial Owners and Management and Related Shareholder
              Matters . . . . . . . . . . . . . . . . . . . . . . . . . . . . . . . . . . . . . . . . . . . . . . . . . . . . . . . . . . . . . . . . . .   81
Item 13       Certain Relationships and Related Transactions, and Director Independence . . . . . . . . . . . . . . .                                       81
Item 14       Principal Accountant Fees and Services . . . . . . . . . . . . . . . . . . . . . . . . . . . . . . . . . . . . . . . . . .                    81
                                                               PART IV
Item 15 Exhibits and Financial Statement Schedules . . . . . . . . . . . . . . . . . . . . . . . . . . . . . . . . . . . . . . .                            82
SIGNATURES . . . . . . . . . . . . . . . . . . . . . . . . . . . . . . . . . . . . . . . . . . . . . . . . . . . . . . . . . . . . . . . . . . . .          83
INDEX TO EXHIBITS . . . . . . . . . . . . . . . . . . . . . . . . . . . . . . . . . . . . . . . . . . . . . . . . . . . . . . . . . . . . . .               85
(This page intentionally left blank)
PART I

Item 1.   Business
General
Starbucks is the premier roaster and retailer of specialty coffee in the world. Starbucks Corporation was formed in
1985 and its common stock trades on the NASDAQ Global Select Market (“NASDAQ”) under the symbol “SBUX.”
Starbucks (together with its subsidiaries, “Starbucks” or the “Company”) purchases and roasts high-quality whole
bean coffees and sells them, along with fresh, rich-brewed coffees, Italian-style espresso beverages, cold blended
beverages, a variety of complementary food items, a selection of premium teas, and beverage-related accessories
and equipment, primarily through Company-operated retail stores. Starbucks also sells coffee and tea products and
licenses its trademark through other channels such as licensed retail stores and, through certain of its licensees and
equity investees, Starbucks produces and sells a variety of ready-to-drink beverages. All channels outside the
Company-operated retail stores are collectively known as specialty operations.
The Company’s objective is to maintain Starbucks standing as one of the most recognized and respected brands in
the world. To achieve this goal, the Company plans to continue disciplined global expansion of its retail and licensed
store base, to introduce relevant new products in all its channels, and to selectively develop new channels of
distribution. The Company’s Global Responsibility strategy and commitments related to coffee and the commu-
nities it does business in, as well as its focus on being an employer of choice, are also key complements to its
business strategies.

Segment Financial Information
Starbucks has three reportable operating segments, and each segment provided the indicated percentage of total net
revenues for fiscal year ended September 27, 2009 (“fiscal 2009”): United States (“US”) (73%), International (19%)
and Global Consumer Products Group (“CPG”) (8%). In the fourth fiscal quarter of 2009, the Company changed the
composition of its reportable segments. The US foodservice business, which was previously reported in the US
segment, is now reported in the CPG segment, as a result of internal management realignments within the US and
CPG businesses. Segment information for all prior periods presented has been revised to reflect this change.
The US and International segments both include Company-operated retail stores and certain components of
specialty operations. Specialty operations within the US include licensed retail stores and other initiatives related to
the Company’s core business. International specialty operations primarily consist of retail store licensing operations
in nearly 40 countries and foodservice accounts in Canada and the United Kingdom (“UK”). The International
segment’s largest markets, based on number of Company-operated and licensed retail stores, are Canada, Japan and
the UK. The CPG segment includes packaged coffee and tea, and other branded products sold worldwide through
channels such as grocery stores, warehouse clubs and convenience stores, and US foodservice accounts. CPG
operates a significant portion of its business through licensing arrangements and joint ventures with large consumer
products business partners. This operating model leverages the business partners’ existing infrastructures and as a
result, the CPG segment reflects relatively lower revenues, a modest cost structure, and a resulting higher operating
margin, compared to the Company’s other two reporting segments, which consist primarily of retail stores.
Financial information about Starbucks segments is included in Note 18 to the consolidated financial statements
included in Item 8 of this Annual Report on Form 10-K (“10-K” or “Report”).


                                                           1
Revenue Components
Revenue components as a percentage of total net revenues and related specialty revenues for the fiscal year ended
September 27, 2009:
                                                                                                                          % of         % of
                                                                                                                        Total Net    Specialty
     Revenues                                                                                                           Revenues     Revenues

     Company-operated retail . . . . . . . . . . . . . . . . . . . . . . . . . . . . . . . . . . . . . . . . .             84%
     Specialty:
       Licensing:
         Retail stores . . . . . . . . . . . . . . . . . . . . . . . . . . . . . . . . . . . . . . . . . . . . . .           8          50%
         Packaged coffee and tea . . . . . . . . . . . . . . . . . . . . . . . . . . . . . . . . . . . . . .                 4          23
         Branded products . . . . . . . . . . . . . . . . . . . . . . . . . . . . . . . . . . . . . . . . . . .              1           4
        Total licensing . . . . . . . . . . . . . . . . . . . . . . . . . . . . . . . . . . . . . . . . . . . . . . .      12           77
        Foodservice and other:
          Foodservice . . . . . . . . . . . . . . . . . . . . . . . . . . . . . . . . . . . . . . . . . . . . . . .          4          23
          Other initiatives . . . . . . . . . . . . . . . . . . . . . . . . . . . . . . . . . . . . . . . . . . . .          1           1
        Total foodservice and other . . . . . . . . . . . . . . . . . . . . . . . . . . . . . . . . . . . . .                4          23
     Total specialty . . . . . . . . . . . . . . . . . . . . . . . . . . . . . . . . . . . . . . . . . . . . . . . .       16          100%
     Total net revenues . . . . . . . . . . . . . . . . . . . . . . . . . . . . . . . . . . . . . . . . . . . . . .       100%

Company-operated and Licensed Retail Store Summary as of September 27, 2009
                                                                                                      As a% of Total
                                                          As a% of Total                               International                     As a% of
                                              US            US Stores            International             Stores            Total      Total Stores

Company-operated stores . . . .              6,764                61%                2,068                    38%            8,832           53%
Licensed stores . . . . . . . . . . .        4,364                39                 3,439                    62             7,803           47
  Total . . . . . . . . . . . . . . . . .   11,128              100%                 5,507                   100%           16,635           100%

Starbucks mix of Company-operated versus licensed stores in a given market will vary based on several factors.
Some of these factors include the ability to access desirable local retail space, the complexity and expected ultimate
size of the market for Starbucks, and the ability to leverage the Company’s support infrastructure in an existing
geographic region.

Company-operated Retail Stores
The Company’s retail goal is to become the leading retailer and brand of coffee in each of its target markets by
selling the finest quality coffee and related products, and by providing each customer a unique Starbucks
Experience. The Starbucks Experience is built upon superior customer service as well as clean and well-maintained
Company-operated retail stores that reflect the personalities of the communities in which they operate, thereby
building a high degree of customer loyalty.
Starbucks disciplined strategy for expanding its global retail business is to increase its market share by selectively
opening additional stores in existing markets, opening stores in new markets, and increasing sales in existing stores,
to support its long term strategic objectives. Store growth in specific existing markets will vary due to many factors,
including the maturity of the market.
As described in more detail in Management’s Discussion and Analysis in this 10-K, Starbucks has taken a number of
actions in fiscal 2008 and 2009 to rationalize its store portfolio. These actions have included plans (announced in July
2008 and January 2009) to close a total of approximately 800 Company-operated stores in the US, restructure its

                                                                           2
Australia market, and close approximately 100 additional Company-operated stores internationally. As of the end of
fiscal 2009, nearly all of the approximately 800 US stores, 61 stores in Australia and 41 stores in other International
markets have been closed. The remaining International closures are expected to be completed by the end of fiscal 2010.
Starbucks Company-operated retail stores accounted for 84% of total net revenues during fiscal 2009.
Summary of total Company-operated retail store data for the periods indicated:
                                                                                Net Stores Opened
                                                                               (Closed) During the
                                                                               Fiscal Year Ended(1)            Stores Open as of
                                                                           Sep 27, 2009    Sep 28, 2008   Sep 27, 2009   Sep 28, 2008

       US(2) . . . . . . . . . . . . . . . . . . . . . . . . . . . . . .      (474)           445           6,764           7,238
       International(3):
            Canada . . . . . . . . . . . . . . . . . . . . . . . . .             44           104             775             731
            United Kingdom . . . . . . . . . . . . . . . . . .                    2            84             666             664
            China . . . . . . . . . . . . . . . . . . . . . . . . . .            13            37             191             178
            Germany. . . . . . . . . . . . . . . . . . . . . . . .               13            27             144             131
            Thailand . . . . . . . . . . . . . . . . . . . . . . . .              4            24             131             127
            Singapore . . . . . . . . . . . . . . . . . . . . . . .               7            12              64              57
            Australia . . . . . . . . . . . . . . . . . . . . . . . .            —            (64)             23              23
            Other . . . . . . . . . . . . . . . . . . . . . . . . . .             6            12              74              68
          Total International . . . . . . . . . . . . . . . . . .                89           236           2,068           1,979
       Total Company-operated . . . . . . . . . . . . . . . .                 (385)           681           8,832           9,217

(1)
      Store openings are reported net of closures.
(2)
      Of the approximately 800 total US stores identified for closure, 566 stores and 205 stores were closed in fiscal
      2009 and 2008, respectively.
(3)
      Starbucks restructured its Australia market by closing 61 stores in fiscal 2008. Of the approximately 100
      International stores (incremental to the Australia closures in fiscal 2008) identified for closure, 41 stores were
      closed in various markets in fiscal 2009.
Starbucks retail stores are typically located in high-traffic, high-visibility locations. Because the Company can vary
the size and format, its stores are located in or near a variety of settings, including downtown and suburban retail
centers, office buildings and university campuses. The Company also locates retail stores in select rural and off-
highway locations to serve a broader array of customers outside major metropolitan markets. To provide a greater
degree of access and convenience for nonpedestrian customers, the Company continues to selectively expand
development of drive-thru retail stores. At the end of fiscal 2009, the Company operated approximately 2,650 drive-
thru locations, representing approximately 35% of Company-operated stores in the US and Canada combined.
Starbucks stores offer a choice of regular and decaffeinated coffee beverages, a broad selection of Italian-style
espresso beverages, cold blended beverages, iced shaken refreshment beverages, a selection of premium teas,
distinctively packaged roasted whole bean coffees, and its recently launched soluble coffee Starbucks VIATM Ready
Brew (“VIA”). Starbucks stores also offer a variety of fresh food items, including healthier choice selections
focusing on high-quality ingredients, nutritional value and great flavor. Food items include pastries, prepared
breakfast and lunch sandwiches, oatmeal, and salads as well as sodas, juices and bottled water. Starbucks continues
to expand its food warming program in the US and Canada, with approximately three-quarters of the stores in these
markets providing warm food items, primarily breakfast sandwiches, as of September 27, 2009. A selection of
beverage-making equipment and accessories are also sold in the stores. Each Starbucks store varies its product mix
depending upon the size of the store and its location. Larger stores carry a broad selection of the Company’s whole
bean coffees in various sizes and types of packaging, as well as coffee and espresso-making equipment and
accessories. Smaller Starbucks stores and kiosks typically sell a full line of coffee beverages, a limited selection of
whole bean coffees and a smaller selection of coffee and beverage-related accessories.

                                                                             3
Retail sales mix by product type for Company-operated stores:
      Fiscal Year Ended                                                                         Sep 27, 2009      Sep 28, 2008        Sep 30, 2007

      Beverages . . . . . . . . . . . . . . . . . . . . . . . . . . . . . . .      ......             76%               76%                 75%
      Food . . . . . . . . . . . . . . . . . . . . . . . . . . . . . . . . . . .   ......             18%               17%                 17%
      Coffee-making equipment and other merchandise . .                            ......              3%                4%                  5%
      Whole bean coffees . . . . . . . . . . . . . . . . . . . . . . . .           ......              3%                3%                  3%
      Total . . . . . . . . . . . . . . . . . . . . . . . . . . . . . . . . . . . . . . . . .      100%                100%               100%


Starbucks Card
The Starbucks Card program is designed to increase customer loyalty and the frequency of store visits by
cardholders. Starbucks cards can be used in all Company-operated and most licensed stores in North America, and
in a growing number of international markets. The cards have no expiration date and do not have any inactivity fees.

Specialty Operations
Specialty operations strive to develop the Company’s brands outside the Company-operated retail store environ-
ment through a number of channels. Starbucks strategy is to reach customers where they work, travel, shop and dine
by establishing relationships with prominent third parties that share the Company’s values and commitment to
quality. These relationships take various forms, including licensing arrangements, foodservice accounts and other
initiatives related to the Company’s core businesses. In certain situations, Starbucks has an equity ownership
interest in licensee operations. During fiscal 2009, specialty revenues (which include royalties and fees from
licensees, as well as product sales derived from specialty operations) accounted for 16% of total net revenues.

Licensing — Retail stores
In its licensed retail store operations which include the Starbucks and Seattle’s Best Coffee brands, the Company
leverages the expertise of its local partners and shares the Company’s operating and store development experience.
Licensee partners provide improved, and at times the only, access to desirable retail space. Most licensees are
prominent retailers with in-depth market knowledge and access. As part of these arrangements, Starbucks receives
royalties and license fees and sells coffee, tea and related products for resale in licensed locations. Product sales to and
royalty and license fee revenues from US and International licensed retail stores accounted for 50% of specialty
revenues in fiscal 2009. Employees working in licensed retail locations are required to follow Starbucks detailed store
operating procedures and attend training classes similar to those given to employees in Company-operated stores.
Starbucks total licensed retail stores by region and specific location at fiscal year end 2009:
               Asia Pacific                                    Europe/Middle East/Africa                                      Americas

Japan . . . . . . . . . . . . . .        875             Turkey . . . . . . . . . . . . . 123                  US . . . . . . . .   . . . . . . . . 4,364
South Korea . . . . . . . . .            288             United Arab Emirates . .           91                 Canada . . . . .     ........          262
China . . . . . . . . . . . . . .        283             Spain . . . . . . . . . . . . . .  76                 Mexico . . . . .     ........          261
Taiwan . . . . . . . . . . . . .         222             Greece . . . . . . . . . . . . .   69                 Other . . . . . .    ........           69
Philippines . . . . . . . . . .          160             Saudi Arabia . . . . . . . . .     68
Malaysia . . . . . . . . . . . .         118             Kuwait . . . . . . . . . . . . .   62
Indonesia . . . . . . . . . . .           74             France. . . . . . . . . . . . . .  52
New Zealand . . . . . . . . .             42             Switzerland . . . . . . . . . .    47
                                                         U.K. . . . . . . . . . . . . . . . 46
                                                         Other . . . . . . . . . . . . . . 151
Total . . . . . . . . . . . . . . . 2,062                Total . . . . . . . . . . . . . . .    785            Total . . . . . . . . . . . . . . . 4,956

During fiscal 2009, net licensed store openings included 35 in the US and 305 internationally.

                                                                              4
Licensing — Packaged coffee and tea
Through a licensing relationship with Kraft Foods, Inc. (“Kraft”), the Company sells a selection of Starbucks and
Seattle’s Best Coffee branded packaged coffees and Tazo» teas in grocery and warehouse club stores throughout the
US. Kraft manages all distribution, marketing, advertising and promotion of these products.
The Company sells packaged coffee and tea internationally both directly to warehouse club stores, such as Costco
Wholesale Corporation, and to grocery stores through a licensing relationship with Kraft in Canada, the UK and
other European countries.
The Company’s coffees and teas are available in approximately 39,000 grocery and warehouse club stores, with
33,500 in the US and 5,500 in International markets. Revenues from this category comprised 23% of specialty
revenues in fiscal 2009.

Licensing — Branded products
The Company licenses the rights to produce and market Starbucks branded products through several partnerships
both domestically and internationally. Significant licensing agreements include:
     • The North American Coffee Partnership, a joint venture with the Pepsi-Cola Company in which Starbucks is
       a 50% equity investor, manufactures and markets ready-to-drink beverages, including bottled Frappuccino»
       beverages and Starbucks DoubleShot» espresso drinks in US and Canada;
     • licensing agreements for the manufacturing, marketing and distribution of Starbucks Discoveries», a
       ready-to-drink chilled cup coffee beverage, and Starbucks DoubleShot» espresso drinks in Japan and
       South Korea;
     • a licensing agreement with a partnership formed by Unilever and Pepsi-Cola Company for the manufac-
       turing, marketing and distribution of Starbucks super-premium Tazo» Tea ready-to-drink beverages in the
       US; and
     • a licensing agreement with Unilever for the manufacturing, marketing and distribution of Starbucks super-
       premium ice cream products in the US.
Collectively, the revenues from these branded products accounted for 4% of specialty revenues in fiscal 2009.

Foodservice
The Company sells whole bean and ground coffees, including the Starbucks and Seattle’s Best Coffee brands, as
well as a selection of premium Tazo» teas, VIA and other related products, to institutional foodservice companies
that service business and industry, education, healthcare, office coffee distributors, hotels, restaurants, airlines and
other retailers. The majority of the Company’s sales in this channel come through national broadline distribution
networks with SYSCO Corporation, US FoodserviceTM, and other distributors. The Company’s total foodservice
operations had over 21,000 accounts, primarily in the US, at fiscal year end 2009. Revenues from foodservice
accounts comprised 23% of total specialty revenues in fiscal 2009.

Product Supply
Starbucks is committed to selling only the finest whole bean coffees and coffee beverages. To ensure compliance
with its rigorous coffee standards, Starbucks controls its coffee purchasing, roasting and packaging, and the global
distribution of coffee used in its operations. The Company purchases green coffee beans from coffee-producing
regions around the world and custom roasts them to its exacting standards for its many blends and single origin
coffees.
The supply and price of coffee are subject to significant volatility. Although most coffee trades in the commodity
market, high-altitude arabica coffee of the quality sought by the Company tends to trade on a negotiated basis at a
substantial premium above commodity coffee prices, depending upon the supply and demand at the time of
purchase. Supply and price can be affected by multiple factors in the producing countries, including weather,

                                                           5
political and economic conditions. In addition, green coffee prices have been affected in the past, and may be
affected in the future, by the actions of certain organizations and associations that have historically attempted to
influence prices of green coffee through agreements establishing export quotas or by restricting coffee supplies.

To help ensure sustainability and future supply of high-quality green coffees and to reinforce the Company’s
leadership role in the coffee industry, Starbucks operates Farmer Support Centers in Costa Rica and Rwanda. The
Farmer Support Centers are staffed with agronomists and sustainability experts who work with coffee farming
communities to promote best practices in coffee production designed to improve both coffee quality and yields.

The Company buys coffee using fixed-price and price-to-be-fixed purchase commitments, depending on market
conditions, to secure an adequate supply of quality green coffee. As of September 27, 2009, the Company had
$238 million of purchase commitments which, together with existing inventory, is expected to provide an adequate
supply of green coffee through fiscal 2010.

The Company depends upon its relationships with coffee producers, outside trading companies and exporters for its
supply of green coffee. The Company believes, based on relationships established with its suppliers, the risk of non-
delivery on such purchase commitments is remote.

In addition to coffee, the Company also purchases significant amounts of dairy products, particularly fluid milk, to
support the needs of its Company-operated retail stores. The Company’s highest volume of dairy purchases are in
the US, Canada and the UK. For these markets, Starbucks purchases substantially all of its fluid milk requirements
from six dairy suppliers. The Company believes, based on relationships established with these suppliers, the risk of
non-delivery of sufficient fluid milk to support these retail businesses is remote.

Products other than whole bean coffees and coffee beverages sold in Starbucks retail stores are obtained through a
number of different channels. Beverage ingredients other than coffee and milk, including leaf teas and the
Company’s selection of ready-to-drink beverages, are purchased from several specialty suppliers, usually under
long-term supply contracts. Food products, such as fresh pastries, breakfast sandwiches and lunch items, are
purchased from national, regional and local sources. Coffee-making equipment, such as drip and coffee press
coffeemakers, espresso machines and coffee grinders, are generally purchased directly from their manufacturers.
Beverage-related accessories, including items bearing the Company’s logos and trademarks, are produced and
distributed through contracts with a number of different suppliers. The Company also purchases a broad range of
paper and plastic products, such as cups and cutlery, from several companies to support the needs of its retail stores
as well as its manufacturing and distribution operations. The Company believes, based on relationships established
with these suppliers and manufacturers, the risk of non-delivery is remote.

Competition

The Company’s primary competitors for coffee beverage sales are quick-service restaurants and specialty coffee
shops. In almost all markets in which the Company does business, there are numerous competitors in the specialty
coffee beverage business, and management expects this situation to continue. The Company believes that its
customers choose among specialty coffee retailers primarily on the basis of product quality, service and conve-
nience, as well as price. Starbucks has been experiencing greater direct competition from large competitors in the
US quick-service restaurant sector and continues to face competition from well-established companies in many
International markets and in the US ready-to-drink coffee beverage market.

The Company’s whole bean coffees and ground packaged coffees compete directly against specialty coffees sold
through supermarkets, club stores and specialty retailers. The Company’s whole bean coffees, its coffee beverages,
and its recently launched soluble coffee VIA, compete indirectly against all other coffees on the market. Starbucks
specialty operations face significant competition from established wholesale and mail order suppliers, some of
whom have greater financial and marketing resources than the Company.

Starbucks also faces competition from both restaurants and other specialty retailers for prime retail locations and
qualified personnel to operate both new and existing stores.

                                                          6
Patents, Trademarks, Copyrights and Domain Names
The Company owns and has applied to register numerous trademarks and service marks in the US and in many
additional countries throughout the world. Some of the Company’s trademarks, including Starbucks, the Starbucks
logo, Frappuccino, Seattle’s Best Coffee and Tazo are of material importance to the Company. The duration of
trademark registrations varies from country to country. However, trademarks are generally valid and may be
renewed indefinitely as long as they are in use and/or their registrations are properly maintained.
The Company owns numerous copyrights for items such as product packaging, promotional materials, in-store
graphics and training materials. The Company also holds patents on certain products, systems and designs. In
addition, the Company has registered and maintains numerous Internet domain names, including “Starbucks.com”,
“Starbucks.net”, and “Seattlesbest.com.”

Research and Development
Starbucks research and development teams are responsible for the technical development of food and beverage
products and new equipment. The Company spent approximately $6.5 million, $7.2 million and $7.0 million during
fiscal 2009, 2008 and 2007, respectively, on technical research and development activities, in addition to customary
product testing and product and process improvements in all areas of its business.

Seasonality and Quarterly Results
The Company’s business is subject to seasonal fluctuations, including fluctuations resulting from the holiday
season. The Company’s cash flows from operations are considerably higher in the first fiscal quarter than the
remainder of the year. This is largely driven by cash received as Starbucks Cards are purchased and loaded during
the holiday season. Since revenues from the Starbucks Card are recognized upon redemption and not when
purchased, seasonal fluctuations on the consolidated statements of earnings are much less pronounced. Quarterly
results are affected by the timing of the opening of new stores and the closing of existing stores. For these reasons,
results for any quarter are not necessarily indicative of the results that may be achieved for the full fiscal year.

Employees
The Company employed approximately 142,000 people worldwide as of September 27, 2009. In the US, Starbucks
employed approximately 111,000 people, with 105,000 in Company-operated retail stores and the remainder in the
Company’s administrative and regional offices, and store development, roasting and warehousing operations.
Approximately 31,000 employees were employed outside of the US, with 30,000 in Company-operated retail stores
and the remainder in the Company’s regional support facilities and roasting and warehousing operations. The
number of the Company’s employees represented by unions is not significant. Starbucks believes its current
relations with its employees are good.

Global Responsibility
Starbucks is committed to being a deeply responsible company in the communities where it does business around
the world. The Company’s focus is on ethically sourcing high-quality coffee, reducing its environmental impacts
and contributing positively to communities. Starbucks Global Responsibility strategy and commitments are integral
to the Company’s overall business strategy. As a result, Starbucks believes it delivers benefits to the Company and
its stakeholders, including employees, business partners, customers, suppliers, shareholders, community members
and others. For an overview of Starbucks Global Responsibility strategy and commitments, please visit
www.starbucks.com.

Available Information
Starbucks 10-K reports, along with all other reports and amendments filed with or furnished to the Securities and
Exchange Commission (“SEC”), are publicly available free of charge on the Investor Relations section of Starbucks
website at http://investor.starbucks.com or at www.sec.gov as soon as reasonably practicable after these materials

                                                          7
are filed with or furnished to the SEC. The Company’s corporate governance policies, code of ethics and Board
committee charters and policies are also posted on the Investor Relations section of Starbucks website at
http://investor.starbucks.com. The information on the Company’s website is not part of this or any other report
Starbucks files with, or furnishes to, the SEC.

Item 1A. Risk Factors
Starbucks is including this Cautionary Statement to make applicable and take advantage of the safe harbor
provisions of the Private Securities Litigation Reform Act of 1995 (the “Act”) for forward-looking statements. This
10-K includes forward-looking statements within the meaning of the Act. Forward-looking statements can be
identified by the fact that they do not relate strictly to historical or current facts. They often include words such as
“believes,” “expects,” “anticipates,” “estimates,” “intends,” “plans,” “seeks” or words of similar meaning, or future
or conditional verbs, such as “will,” “should,” “could,” “may,” “aims,” “intends,” or “projects.” A forward-looking
statement is neither a prediction nor a guarantee of future events or circumstances, and those future events or
circumstances may not occur. Investors should not place undue reliance on the forward-looking statements, which
speak only as of the date of this Report. These forward-looking statements are all based on currently available
operating, financial and competitive information and are subject to various risks and uncertainties. The Company’s
actual future results and trends may differ materially depending on a variety of factors, including, but not limited to,
the risks and uncertainties discussed below.
If any of the risks and uncertainties described in the cautionary factors described below actually occurs, Starbucks
business, financial condition and results of operations could be materially and adversely affected. The factors listed
below are not exhaustive. Other sections of this 10-K include additional factors that could materially and adversely
impact Starbucks business, financial condition and results of operations. Moreover, Starbucks operates in a very
competitive and rapidly changing environment. New factors emerge from time to time and it is not possible for
management to predict the impact of all these factors on Starbucks business, financial condition or results of
operation or the extent to which any factor, or combination of factors, may cause actual results to differ materially
from those contained in any forward-looking statements. Given these risks and uncertainties, investors should not
rely on forward-looking statements as a prediction of actual results. Any or all of the forward-looking statements
contained in this 10-K and any other public statement made by Starbucks or its management may turn out to be
incorrect. Starbucks expressly disclaims any obligation to update or revise any forward-looking statements, whether
as a result of new information, future events or otherwise.

• Starbucks financial condition and results of operations are sensitive to, and may be adversely affected by,
  a number of factors, many of which are largely outside the Company’s control.
The Company’s operating results have been in the past and will continue to be subject to a number of factors, many
of which are largely outside the Company’s control. Any one or more of the factors set forth below could adversely
impact Starbucks business, financial condition and/or results of operations:
     • lower customer traffic or average value per transaction, which negatively impacts comparable store sales, net
       revenues, operating income, operating margins and earnings per share, due to:
       • the impact of initiatives by competitors and increased competition generally;
       • customers trading down to lower priced products within Starbucks, and/or shifting to competitors with
         lower priced products;
       • lack of customer acceptance of new products or price increases necessary to cover costs of new products
         and/or higher input costs;
       • unfavorable general economic conditions in the markets in which Starbucks operates that adversely affect
         consumer spending;
       • declines in general consumer demand for specialty coffee products; or

                                                           8
• adverse impacts resulting from negative publicity regarding the Company’s business practices or the
         health effects of consuming its products;
     • cost increases that are either wholly or partially beyond the Company’s control, such as:
       • commodity costs for commodities that can only be partially hedged, such as fluid milk, and to a lesser
         extent, high quality arabica coffee (See also the discussion under “Product Supply” in Item 1);
       • labor costs such as increased health care costs, general market wage levels and workers’ compensation
         insurance costs;
       • litigation against Starbucks, particularly class action litigation;
       • construction costs associated with new store openings; or
       • information technology costs and other logistical resources necessary to maintain and support the global
         growth of the Company’s business;
     • delays in store openings for reasons beyond the Company’s control, or a lack of desirable real estate
       locations available for lease at reasonable rates, either of which could keep the Company from meeting
       annual store opening targets and, in turn, negatively impact net revenues, operating income and earnings per
       share;
     • any material interruption in the Company’s supply chain beyond its control, such as material interruption of
       roasted coffee supply due to the casualty loss of any of the Company’s roasting plants or the failures of third-
       party suppliers, or interruptions in service by common carriers that ship goods within the Company’s
       distribution channels, or trade restrictions, such as increased tariffs or quotas, embargoes or customs
       restrictions; and
     • the impact on Starbucks business of factors such as labor discord, war, terrorism (including incidents
       targeting Starbucks), political instability in certain markets and natural disasters.

• The Company may not be successful in implementing important strategic initiatives, which may have a
  material adverse impact on its business and financial results.
There is no assurance that the Company will be able to implement important strategic initiatives in accordance with
its expectations, which may result in a material adverse impact on the Company’s business and financial results.
These strategic initiatives are designed to drive long-term shareholder value and improve Starbucks results of
operations, and include:
     • ongoing initiatives to improve the current state of the business by refocusing on the customer experience in
       the stores, new products and store design elements, and new training and tools for the Company’s store
       partners to help them give customers a superior experience;
     • balancing disciplined global store growth while meeting target store-level unit economics in a given market;
     • executing a multi-channel advertising and marketing campaign to effectively communicate the Company’s
       message directly to Starbucks consumers and partners; and
     • focusing on relevant innovation and profitable growth platforms, such as the recent introduction of Starbucks
       soluble coffee, VIA.

• Economic conditions in the US and certain International markets could adversely affect the Company’s
  business and financial results.
As a retailer that is dependent upon consumer discretionary spending, the Company’s results of operations are
sensitive to changes in macro-economic conditions. Starbucks customers may have less money for discretionary
purchases as a result of job losses, foreclosures, bankruptcies, reduced access to credit and falling home prices. Any
resulting decreases in customer traffic or average value per transaction will negatively impact the Company’s

                                                          9
financial performance as reduced revenues result in sales de-leveraging which creates downward pressure on
margins. There is also a risk that if negative economic conditions persist for a long period of time, consumers may
make long-lasting changes to their discretionary purchasing behavior, including less frequent discretionary
purchases on a more permanent basis.

• Failure to meet market expectations for Starbucks financial performance will likely adversely affect the
  market price and volatility of Starbucks stock.
The Company’s failure to meet market expectations going forward, particularly with respect to operating margins,
earnings per share, comparable store sales, and net revenues, will likely result in a decline and/or increased volatility
in the market price of Starbucks stock.

• Starbucks is highly dependent on the financial performance of its US operating segment.
The Company’s financial performance is highly dependent on its US operating segment, which comprised
approximately three-quarters of consolidated total net revenues in fiscal 2009. The Company continued to
experience negative traffic in its US stores in fiscal 2009, which adversely affected the operating results of the
US segment and the Company as a whole. Although the US segment’s operating results improved in fiscal 2009
compared to fiscal 2008 due to the Company’s restructuring efforts, if improvements in its financial performance do
not continue, the Company’s business and financial results will continue to be adversely affected.

• Starbucks is increasingly dependent on the success of its International operating segment in order to
  achieve its growth targets.
The Company’s future growth increasingly depends on the growth and sustained profitability of its International
operating segment. Some or all of the Company’s International market business units (“MBUs”), which Starbucks
generally defines by the countries or regions in which they operate, may not be successful in their operations or in
achieving expected growth, which ultimately requires achieving consistent, stable net revenues and earnings. The
performance of the International operating segment may be adversely affected by economic downturns in one or
more of the Company’s large MBUs. Additionally, some factors that will be critical to the success of International
MBUs are different than those affecting the Company’s US stores and licensees. Tastes naturally vary by region, and
consumers in new international markets into which Starbucks and its licensees expand may not embrace Starbucks
products to the same extent as consumers in the Company’s existing markets. Occupancy costs and store operating
expenses are also sometimes higher internationally than in the US due to higher rents for prime store locations or
costs of compliance with country-specific regulatory requirements. Because many of the Company’s International
operations are in an early phase of development, operating expenses as a percentage of related revenues are often
higher compared to US operations. The Company’s International operations are also subject to additional inherent
risks of conducting business abroad, such as:
     • foreign currency exchange rate fluctuations;
     • changes or uncertainties in economic, legal, regulatory, social and political conditions in the Company’s
       markets;
     • interpretation and application of laws and regulations;
     • restrictive actions of foreign or US governmental authorities affecting trade and foreign investment,
       including protective measures such as export and customs duties and tariffs and restrictions on the level
       of foreign ownership;
     • import or other business licensing requirements;
     • the enforceability of intellectual property and contract rights;
     • limitations on the repatriation of funds and foreign currency exchange restrictions;

                                                           10
• in developing economies, the growth rate in the portion of the population achieving targeted levels of
       disposable income may not be as fast as the Company forecasts;
     • difficulty in staffing, developing and managing foreign operations, including ensuring the consistency of
       product quality and service, due to distance, language and cultural differences; and
     • local laws that make it more expensive and complex to negotiate with, retain or terminate employees.
Moreover, many of the foregoing risks are particularly acute in developing countries, which are important to the
Company’s long-term growth prospects.

• Starbucks International operating segment is highly dependent on the financial performance of its
  Canada, Japan and UK market.
Starbucks Canada, Japan and UK markets account for a significant portion of the net revenues and profit
contribution of the Company’s International operating segment. Any significant decline in the financial perfor-
mance of one of these key markets may have a material adverse impact on the results of operations of the entire
International operating segment, if not partially or fully offset by positive financial performance from the other two
major markets.

• Starbucks faces intense competition in the specialty coffee market, which could lead to reduced
  profitability.
A description of the general competitive conditions in which Starbucks operates appears under “Competition” in
Item 1. In the US, the continued focus by one or more large competitors in the quick-service restaurant sector on
selling high-quality specialty coffee beverages at a low cost has attracted Starbucks customers and could, if the
numbers become large enough, adversely affect the Company’s sales and results of operations. Similarly, continued
competition from well-established competitors in international markets could hinder growth and adversely affect
the Company’s sales and results of operations in those markets. The Company faces increased competition from
larger well-known competitors which have greater resources. Increasing competition from the US packaged coffee
and tea and ready-to-drink coffee beverage markets could adversely affect the profitability of the CPG segment and
the Company’s results of operations. Given its premium brand, Starbucks may be impacted more severely than its
competitors by customers trading down to lower priced coffee beverages and related products.

• A regional or global health pandemic could severely affect Starbucks business.
A health pandemic is a disease outbreak that spreads rapidly and widely by infection and affects many individuals in
an area or population at the same time. If a regional or global health pandemic were to occur, depending upon its
duration and severity, the Company’s business could be severely affected. Starbucks has positioned itself as a third
place between home and work where people can gather together for human connection. Customers might avoid
public gathering places in the event of a health pandemic, and local, regional or national governments might limit or
ban public gatherings to halt or delay the spread of disease. A regional or global health pandemic might also
adversely impact the Company’s business by disrupting or delaying production and delivery of materials and
products in its supply chain and by causing staffing shortages in its stores. The impact of a health pandemic on
Starbucks might be disproportionately greater than on other companies that depend less on the gathering of people
together for the sale, use or license of their products and services.

• The Company’s success depends substantially on the value of the Starbucks brand.
Starbucks believes it has built an excellent reputation globally for the quality of its products, for delivery of a
consistently positive consumer experience and for its corporate social responsibility programs. The Starbucks brand
has been highly rated in several global brand value studies. To be successful in the future, particularly outside of US,
where the Starbucks brand is less well-known, management believes it must preserve, grow and leverage the value
of the Starbucks brand across its sales channels. Brand value is based in part on consumer perceptions as to a variety
of subjective qualities. Even isolated business incidents that erode consumer trust, particularly if the incidents

                                                          11
receive considerable publicity or result in litigation, can significantly reduce brand value. Consumer demand for the
Company’s products and its brand equity could diminish significantly if Starbucks fails to preserve the quality of its
products, is perceived to act in an unethical or socially irresponsible manner or fails to deliver a consistently positive
consumer experience in each of its markets.

• The Company’s business depends in large part on the success of its business partners and suppliers, and
  the Company’s brand and reputation may be harmed by actions taken by third parties that are outside of
  the Company’s control.
The Company’s business strategy, including its plans for new stores, foodservice, branded products and other
initiatives, relies significantly on a variety of licensee and partnership relationships, particularly in its International
markets. Licensees are often authorized to use the Starbucks logo and provide Starbucks-branded beverages, food
and other products directly to customers. The Company provides training and support to, and monitors the
operations of, these business partners, but the product quality and service they deliver to Starbucks customers may
be diminished by any number of factors beyond the Company’s control, including financial pressures. Management
believes customers expect the same quality of products and service from the Company’s licensees as they do from
Starbucks and the Company strives to ensure customers have the same experience whether they visit a Company-
operated or licensed store. Any shortcoming of a Starbucks business partner, particularly an issue affecting the
quality of the service experience or the safety of beverages or food, may be attributed by customers to Starbucks,
thus damaging the Company’s reputation and brand value and potentially affecting the results of operations.
The Company’s products and in particular, its coffee and tea products, are sourced from a wide variety of domestic
and international vendors. The Company relies on international vendors to provide high quality product that comply
with applicable laws. The Company’s ability to find qualified vendors who meet our standards and supply products
in a timely and efficient manner is a significant challenge, especially with respect to goods sourced from outside the
US. These issues could negatively impact the Company’s business and profitability.

• The loss of key personnel or difficulties recruiting and retaining qualified personnel could jeopardize the
  Company’s ability to meet its financial targets.
The Company’s success depends substantially on the contributions and abilities of key executives and other
employees, and on its ability to recruit and retain high quality employees to work in and manage Starbucks stores.
Starbucks must continue to recruit, retain and motivate management and other employees sufficient to maintain its
current business and support its projected growth. A loss of key employees or a significant shortage of high quality
store employees could jeopardize the Company’s ability to meet its financial targets.

• Effectively managing the Company’s growth is challenging.
Effectively managing growth can be challenging, particularly as Starbucks expands into new markets interna-
tionally, where it must balance the need for flexibility and a degree of autonomy for local management against the
need for consistency with the Company’s goals, philosophy and standards. Growth can make it increasingly difficult
to ensure a consistent supply of high quality raw materials, to locate and hire sufficient numbers of key employees to
meet the Company’s financial targets, to maintain an effective system of internal controls for a globally dispersed
enterprise and to train employees worldwide to deliver a consistently high quality product and customer experience.

• Adverse public or medical opinions about the health effects of consuming the Company’s products, as well
  as reports of incidents involving food-borne illnesses or food tampering, whether or not accurate, could
  harm its business.
Some Starbucks products contain caffeine, dairy products, sugar and other active compounds, the health effects of
which are the subject of increasing public scrutiny, including the suggestion that excessive consumption of caffeine,
dairy products, sugar and other active compounds can lead to a variety of adverse health effects. There has also been
greater public awareness that sedentary lifestyles, combined with excessive consumption of high-calorie foods,
have led to a rapidly rising rate of obesity. Particularly in the US, there is increasing consumer awareness of health

                                                            12
risks, including obesity, due in part to increasing publicity and attention from health organizations, as well as
increased consumer litigation based on alleged adverse health impacts of consumption of various food products.
While Starbucks has a variety of healthier choice beverage and food items, including items that are low in caffeine
and calories, an unfavorable report on the health effects of caffeine or other compounds present in the Company’s
products, or negative publicity or litigation arising from other health risks such as obesity, could significantly reduce
the demand for the Company’s beverages and food products.
Similarly, instances or reports, whether true or not, of unclean water supply, food-borne illnesses and food
tampering have in the past severely injured the reputations of companies in the food processing, grocery and quick-
service restaurant sectors and could in the future affect the Company as well. Any report linking Starbucks to the use
of unclean water, food-borne illnesses or food tampering could damage its brand value, immediately and severely
hurt sales of its beverages and food products, and possibly lead to product liability claims. Clean water is critical to
the preparation of specialty coffee beverages. The Company’s ability to ensure a clean water supply to its stores is
limited, particularly in some International locations. If customers become ill from food-borne illnesses, the
Company could also be forced to temporarily close some stores. In addition, instances of food-borne illnesses or
food tampering, even those occurring solely at the restaurants or stores of competitors, could, by resulting in
negative publicity about the foodservice industry, adversely affect Starbucks sales on a regional or global basis. A
decrease in customer traffic as a result of these health concerns or negative publicity, or as a result of a temporary
closure of any of the Company’s stores, could materially harm the Company’s business and results of operations.

• Deterioration in operating performance could lead to increased leverage, which may harm the Company’s
  financial condition and results of operations.
Any reduction in cash flow relative to the level of the Company’s financial obligations would result in an increase in
leverage. Any increase in leverage could lead to deterioration in Starbucks credit ratings, which could limit the
availability of additional financing and increase its cost of obtaining financing. In addition, an increase in leverage
could raise the likelihood of a financial covenant breach which in turn could limit the Company’s access to existing
funding under its credit facility.
The Company’s ability to satisfy its operating lease obligations and make payments of principal and interest on its
indebtedness depends on its future performance. Should the Company experience deterioration in operating
performance, it will have less cash flow available to meet these obligations. In addition, if such deterioration were to
lead to the closure of underperforming stores, the Company would need to fund the costs of terminating store leases.
If Starbucks is unable to generate sufficient cash flow from operations in the future to satisfy these financial
obligations, it may be required to, among other things:
     • seek additional financing in the debt or equity markets;
     • refinance or restructure all or a portion of its indebtedness;
     • sell selected assets; or
     • reduce or delay planned capital or operating expenditures.
Such measures might not be sufficient to enable Starbucks to satisfy its financial obligations. In addition, any such
financing, refinancing or sale of assets might not be available on economically favorable terms.

• Starbucks relies heavily on information technology in its operations, and any material failure, inadequacy,
  interruption or security failure of that technology could harm the Company’s ability to effectively operate
  its business.
Starbucks relies heavily on information technology systems across its operations, including for management of its
supply chain, point-of-sale processing in its stores, and various other processes and transactions. The Company’s
ability to effectively manage its business and coordinate the production, distribution and sale of its products depends
significantly on the reliability and capacity of these systems. The failure of these systems to operate effectively,
problems with transitioning to upgraded or replacement systems, or a breach in security of these systems could

                                                           13
cause delays in product sales and reduced efficiency of the Company’s operations, and significant capital
investments could be required to remediate the problem.

• Failure of the Company to comply with applicable laws and regulations could harm its business and financial
  results.

Starbucks policies and procedures are designed to comply with all applicable laws and regulations, including those
imposed by the SEC, NASDAQ, and foreign countries, as well as applicable labor laws. Additional legal and
regulatory requirements, together with the fact that foreign laws occasionally conflict with domestic laws, increase
the complexity of the regulatory environment in which the Company operates and the related cost of compliance.
Failure to comply with the various laws and regulations may result in damage to Starbucks reputation, civil and
criminal liability, fines and penalties, increased cost of regulatory compliance and restatements of the Company’s
financial statements.

Item 1B. Unresolved Staff Comments

None.

Item 2.    Properties

Properties used by Starbucks in connection with its roasting and distribution operations:
                                                              Approximate Size   Owned or
     Location                                                  in Square Feet     Leased             Purpose

     Kent, WA . . . . . . . . . . . . . . . . . . . . . . .      332,000         Owned      Roasting and distribution
     Kent, WA . . . . . . . . . . . . . . . . . . . . . . .      215,000         Leased     Warehouse
     Renton, WA . . . . . . . . . . . . . . . . . . . . .        125,000         Leased     Warehouse
     York County, PA . . . . . . . . . . . . . . . . . .         450,000         Owned      Roasting and distribution
     York County, PA . . . . . . . . . . . . . . . . . .         298,000         Owned      Warehouse
     York County, PA . . . . . . . . . . . . . . . . . .         118,000         Leased     Warehouse
     Carson Valley, NV . . . . . . . . . . . . . . . . .         360,000         Owned      Roasting and distribution
     Sandy Run, SC . . . . . . . . . . . . . . . . . . .         117,000         Owned      Roasting and distribution
     Portland, OR . . . . . . . . . . . . . . . . . . . . .       68,000         Leased     Warehouse
     Basildon, United Kingdom . . . . . . . . . . .              142,000         Leased     Warehouse and distribution
     Amsterdam, Netherlands . . . . . . . . . . . .               97,000         Leased     Roasting and distribution

The Company leases approximately 1.0 million square feet of office space in Seattle, Washington for corporate
administrative purposes. Also in Seattle, Washington, the Company owns a 205,000 square foot office building
(previously occupied by the Company, but now leased to other parties) and an adjacent 285,000 square foot office
building, which is currently being marketed for lease.

As of September 27, 2009, Starbucks had more than 8,800 Company-operated retail stores, almost all of which are
leased. The Company also leases space in approximately 130 additional locations for regional, district and other
administrative offices, training facilities and storage, not including certain seasonal retail storage locations.


Item 3.    Legal Proceedings

See discussion of Legal Proceedings in Note 17 to the consolidated financial statements included in Item 8 of this
Report.


Item 4.    Submission of Matters to a Vote of Security Holders

No matters were submitted to a vote of security holders during the fourth fiscal quarter of 2009.

                                                                    14
Executive officers of the registrant

Executive officers of the Company:
     Name                                                      Age                          Position

     Howard Schultz . . . . . . . . . . . . . . . . . . .      56    chairman, president and chief executive officer
     Cliff Burrows . . . . . . . . . . . . . . . . . . . .     50    president, Starbucks Coffee US
     Martin Coles . . . . . . . . . . . . . . . . . . . . .    54    president, Starbucks Coffee International
     John Culver. . . . . . . . . . . . . . . . . . . . . .    49    president, Global Consumer Products and
                                                                     Foodservice
     Michelle Gass . . . . . . . . . . . . . . . . . . . .     41    president, Seattle’s Best Coffee
     Arthur Rubinfeld . . . . . . . . . . . . . . . . . .      55    president, Global Development
     Annie Young-Scrivner . . . . . . . . . . . . . .          40    chief marketing officer
     Troy Alstead . . . . . . . . . . . . . . . . . . . . .    46    executive vice president, chief financial officer and
                                                                     chief administrative officer
     Paula E. Boggs . . . . . . . . . . . . . . . . . . .      50    executive vice president, general counsel and
                                                                     secretary
     Peter D. Gibbons . . . . . . . . . . . . . . . . . .      48    executive vice president, Global Supply Chain
                                                                     Operations
     Kalen Holmes . . . . . . . . . . . . . . . . . . . .      43    executive vice president, Partner Resources
     Olden Lee . . . . . . . . . . . . . . . . . . . . . . .   68    interim executive vice president, Partner Resources

Howard Schultz is the founder of Starbucks and serves as the Company’s chairman, president and chief executive
officer. Mr. Schultz has served as chairman of the board since the Company’s inception in 1985 and he resumed his
role as president and chief executive officer in January 2008. From June 2000 to February 2005, Mr. Schultz held the
title of chief global strategist. From November 1985 to June 2000, he served as chief executive officer. From
November 1985 to June 1994, Mr. Schultz also served as president.

Cliff Burrows joined Starbucks in April 2001 and has served as president, Starbucks Coffee US since March 2008.
Mr. Burrows served as president, Europe, Middle East and Africa (EMEA) from April 2006 to March 2008. He
served as vice president and managing director, UK prior to April 2006. Prior to joining Starbucks, Mr. Burrows
served in various management positions with Habitat Designs Limited, a furniture and housewares retailer.

Martin P. Coles joined Starbucks in April 2004 as president, Starbucks Coffee International, and, in July 2008,
reassumed this role, after having served as chief operating officer from September 2007 to July 2008. Prior to
joining Starbucks, Mr. Coles served as an executive vice president of Reebok International, Ltd. a sports and fitness
products company, from December 2001 to February 2004. Prior to joining Reebok International, Ltd., Mr. Coles
held several executive level management sales and operations positions with NIKE Inc., Letsbuyit.com and
Gateway, Inc.

John Culver joined Starbucks in August 2002 and has served as president, Global Consumer Products and
Foodservice since September 2009. Mr. Culver served as executive vice president; president, Global Consumer
Products, Foodservice and Seattle’s Best Coffee from February 2009 to September 2009. He previously served as
senior vice president; president, Starbucks Coffee Asia Pacific from January 2007 to February 2009, and vice
president; general manager, Foodservice from August 2002 to January 2007.

Michelle Gass joined Starbucks in 1996 and has served as the Company’s president, Seattle’s Best Coffee since
September 2009. Ms. Gass served as senior vice president, Marketing and Category from July 2008 to November
2008, and then as executive vice president, Marketing and Category from December 2008 to September 2009.
Ms. Gass previously served as senior vice president, Global Strategy, Office of the ceo from January 2008 to July
2008, senior vice president, Global Product and Brand from August 2007 to January 2008, senior vice president, and
U.S. Category Management from May 2004 to August 2007. Ms. Gass served in a number of other positions with
Starbucks prior to 2004.

                                                                     15
Arthur Rubinfeld rejoined Starbucks in February 2008 as president, Global Development. Mr. Rubinfeld also serves
as president of AIRVISION LLC, an advisory firm specializing in brand positioning that he founded in June 2002.
From March 2006 to February 2008, Mr. Rubinfeld served as executive vice president, Corporate Strategy and chief
development officer at Potbelly Sandwich Works. Prior to 2002, Mr. Rubinfeld held several positions in Store
Development at Starbucks.
Annie Young-Scrivner joined Starbucks in September 2009 as chief marketing officer. Prior to joining Starbucks,
Ms. Young-Scrivner served as Chief Marketing Officer and Vice President of Sales for Quaker Foods and Snacks, a
division of PepsiCo, Inc. From October 2006 to November 2008, she served as Region President of PepsiCo Foods
for Greater China. From 2005 to 2006, Ms. Young-Scrivner served as Vice President of Sales for PepsiCo Beverages
in Greater China. She also served in a number of other leadership roles at PepsiCo prior to 2005.
Troy Alstead joined Starbucks in 1992 and has served as executive vice president, chief financial officer and chief
administrative officer since November 2008. Mr. Alstead previously served as chief operating officer, Starbucks
Greater China from April 2008 to October 2008, senior vice president, Global Finance and Business Operations
from August 2007 to April 2008, and senior vice president, Corporate Finance from September 2004 to August
2007. Mr. Alstead served in a number of other senior positions with Starbucks prior to 2004.
Paula E. Boggs joined Starbucks in September 2002 as executive vice president, general counsel and secretary. Prior
to joining Starbucks, Ms. Boggs served as vice president, legal, for products, operations and information technology
at Dell Computer Corporation from 1997 to 2002. From 1995 to 1997, Ms. Boggs was a partner with the law firm of
Preston Gates & Ellis (now K&L Gates). Ms. Boggs served in several roles at the Pentagon, White House and US
Department of Justice between 1984 and 1995.
Peter D. Gibbons joined Starbucks in February 2007 and has served as executive vice president, Global Supply
Chain Operations since July 2008. From February 2007 to July 2008, Mr. Gibbons served as senior vice president,
Global Manufacturing Operations. From March 1999 to February 2007, Mr. Gibbons was executive vice president,
Supply Chain, of The Glidden Company, a subsidiary of ICI Americas, Inc.
Kalen Holmes joined Starbucks in November 2009 as executive vice president, Partner Resources. Prior to joining
Starbucks, Ms. Holmes served as HR General Manager for the Entertainment and Devices division at Microsoft
Corporation, a worldwide provider of software, services and solutions, from December 2007 to November 2009. From
December 2005 to December 2007, Ms. Holmes was HR General Manager for Microsoft’s Server and Tools Division.
From September 2003 to December 2005, she served as HR General Manager for Microsoft’s Corporate Staff business
unit. Prior to 2003, Ms. Holmes served as an HR leader at companies such as Bristol-Myers Squibb Company, PepsiCo,
Inc., Enron Corporation, pcOrder.com, Inc., and Trilogy Inc., managing multiple geographies and diverse business units.
Olden Lee has served as interim executive vice president, Partner Resources since April 2009. Mr. Lee has been a
Starbucks director since June 2003. Mr. Lee undertook the role of interim head of Partner Resources while the
Company searched for an executive vice president, Partner Resources. Mr. Lee will continue with the Company on
an interim basis to assist Ms. Holmes and ensure a smooth transition. Prior to serving in his current role, Mr. Lee
worked with PepsiCo, Inc. for 28 years in a variety of positions, including serving as senior vice president of human
resources of its Taco Bell division and senior vice president and chief personnel officer of its KFC division.
There are no family relationships among any directors or executive officers of the Company.


                                                          16
PART II

Item 5.         Market for the Registrant’s Common Equity, Related Shareholder Matters and Issuer Purchases
                of Equity Securities
SHAREHOLDER INFORMATION
MARKET INFORMATION AND DIVIDEND POLICY
The Company’s common stock is traded on NASDAQ, under the symbol “SBUX.”
Quarterly high and low closing sale prices per share of the Company’s common stock as reported by NASDAQ for
each quarter during the last two fiscal years:
                                                                                                                                 High           Low

         September 27, 2009:
           Fourth Quarter . . . . . . . . . . . . . . . . . . . . . . . . . .          . . . . . . . . . . . . . . . . . . . . . . $20.76     $12.97
           Third Quarter . . . . . . . . . . . . . . . . . . . . . . . . . . .         ......................                       15.30      11.11
           Second Quarter . . . . . . . . . . . . . . . . . . . . . . . . . .          ......................                       12.39       8.27
           First Quarter . . . . . . . . . . . . . . . . . . . . . . . . . . . .       ......................                       14.87       7.17
         September 28, 2008:
           Fourth Quarter . . . . . . . . . . . . . . . . . . . . . . . . . .          . . . . . . . . . . . . . . . . . . . . . . $16.92     $13.58
           Third Quarter . . . . . . . . . . . . . . . . . . . . . . . . . . .         ......................                       18.60      15.66
           Second Quarter . . . . . . . . . . . . . . . . . . . . . . . . . .          ......................                       20.47      16.80
           First Quarter . . . . . . . . . . . . . . . . . . . . . . . . . . . .       ......................                       26.84      20.03
As of November 13, 2009, the Company had approximately 21,600 shareholders of record. This does not include
persons whose stock is in nominee or “street name” accounts through brokers.
Starbucks has never paid any dividends on its common stock. Any future decision to pay cash dividends will be at
the discretion of the Company’s Board of Directors and will be dependent on the Company’s operating perfor-
mance, financial condition, capital expenditure requirements, and other such factors that the Board of Directors
considers relevant.
                                           ISSUER PURCHASES OF EQUITY SECURITIES
The following table provides information regarding repurchases by the Company of its common stock during the
13-week period ended September 27, 2009:
                                                                                                                     Total Number              Maximum
                                                                                                                       of Shares               Number of
                                                                                                                     Purchased as           Shares that May
                                                                                     Total           Average        Part of Publicly             Yet Be
                                                                                   Number of          Price           Announced                Purchased
                                                                                    Shares           Paid per          Plans or             Under the Plans
                                                                                  Purchased(2)        Share           Programs(3)            or Programs(3)

Period(1)
  June 29, 2009 — July 26, 2009 . . . . . . . . . . . . . .                               —               —                —                  6,272,128
  July 27, 2009 — August 23, 2009 . . . . . . . . . . . .                                 —               —                —                  6,272,128
  August 24, 2009 — September 27, 2009 . . . . . . .                                   1,780          $18.69               —                  6,272,128
      Total . . . . . . . . . . . . . . . . . . . . . . . . . . . . . . . . . .        1,780                               —

(1)
       Monthly information is presented by reference to the Company’s fiscal months during the fourth quarter of fiscal
       2009.
(2)
       These amounts represent shares surrendered to the Company to pay the exercise price and/or to satisfy tax
       withholding obligations in connection with stock swap exercises of employee stock options.
(3)
       The Company’s share repurchase program is conducted under authorizations made from time to time by the
       Company’s Board of Directors. The Board of Directors authorized the repurchase of 25 million shares of common
       stock (publicly announced on May 3, 2007) and later authorized the repurchase of up to five million additional shares
       (publicly announced on January 30, 2008). Neither of these authorizations has an expiration date.

                                                                                  17
Performance Comparison Graph
The following graph depicts the Company’s total return to shareholders from October 3, 2004 through Septem-
ber 27, 2009, relative to the performance of the Standard & Poor’s 500 Index, the NASDAQ Composite Index, and
the Standard & Poor’s 500 Consumer Discretionary Sector, a peer group that includes Starbucks. All indices shown
in the graph have been reset to a base of 100 as of October 3, 2004, and assume an investment of $100 on that date
and the reinvestment of dividends paid since that date. Starbucks has never paid a dividend on its common stock.
The stock price performance shown in the graph is not necessarily indicative of future price performance.

 $250              Starbucks Corporation
                   S&P 500
                   NASDAQ Composite
 $200              S&P Consumer Discretionary


 $150


 $100


   $50


    $0
    10/3/2004          10/2/2005           10/1/2006           9/30/2007             9/28/2008         9/27/2009

                                                     10/3/04    10/2/05    10/1/06     9/30/07   9/28/08   9/27/09
 Starbucks Corporation                              $100.00 $106.10 $144.22 $110.97 $ 63.36 $ 83.99
 S&P 500                                            $100.00 $112.25 $124.37 $144.81 $112.99 $105.18
 NASDAQ Composite                                   $100.00 $113.78 $121.50 $143.37 $109.15 $112.55
 S&P Consumer Discretionary                         $100.00 $105.05 $114.35 $121.59 $ 94.34 $ 94.29


                                                       18
Item 6.       Selected Financial Data
In millions, except earnings per share and store information
The following selected financial data are derived from the consolidated financial statements of the Company. The
data below should be read in conjunction with “Management’s Discussion and Analysis of Financial Condition and
Results of Operations,” “Risk Factors,” and the Company’s consolidated financial statements and notes.
                                                                             Sep 27,           Sep 28,       Sep 30,      Oct 1,      Oct 2,
                                                                              2009              2008          2007        2006        2005
                                            (1)
As of and for the Fiscal Year Ended                                         (52 Wks)          (52 Wks)      (52 Wks)    (52 Wks)    (52 Wks)

RESULTS OF OPERATIONS
Net revenues:
  Company-operated retail . . . . . . . . . . . . . . . . . $8,180.1                          $ 8,771.9     $7,998.3    $6,583.1    $5,391.9
  Specialty:
     Licensing. . . . . . . . . . . . . . . . . . . . . . . . . . . 1,222.3                     1,171.6      1,026.3       860.6       673.0
     Foodservice and other . . . . . . . . . . . . . . . . .          372.2                       439.5        386.9       343.2       304.4
  Total specialty . . . . . . . . . . . . . . . . . . . . . . . . . 1,594.5                     1,611.1      1,413.2     1,203.8       977.4
Total net revenues . . . . . . . . . . . . . . . . . . . . . . . . $9.774.6                   $10,383.0     $9,411.5    $7,786.9    $6,369.3
Operating income(2) . . . . . . . . . . . . . . . . . . . . . . .           $ 562.0           $   503.9     $1,053.9    $ 894.0     $ 780.5
Earnings before cumulative effect of change in
  accounting principle . . . . . . . . . . . . . . . . . . . .                   390.8            315.5         672.6       581.5       494.4
Cumulative effect of accounting change for asset
  retirement obligations, net of taxes . . . . . . . . . .                      —                    —           —         17.2          —
Net earnings . . . . . . . . . . . . . . . . . . . . . . . . . . . .        $ 390.8           $   315.5     $ 672.6     $ 564.3     $ 494.4
Earnings per common share before cumulative
  effect of change in accounting principle —
  diluted (“EPS”) . . . . . . . . . . . . . . . . . . . . . . . .           $        0.52     $    0.43     $    0.87   $    0.73   $    0.61
Cumulative effect of accounting change for asset
  retirement obligations, net of taxes — per
  common share . . . . . . . . . . . . . . . . . . . . . . . . .                  —                  —            —         0.02         —
EPS — diluted . . . . . . . . . . . . . . . . . . . . . . . . . .           $ 0.52            $    0.43     $ 0.87      $ 0.71      $ 0.61
Net cash provided by operating activities . . . . . . .                     $1,389.0          $ 1,258.7     $1,331.2    $1,131.6    $ 922.9
Capital expenditures (additions to property, plant
  and equipment) . . . . . . . . . . . . . . . . . . . . . . . .            $ 445.6           $   984.5     $1,080.3    $ 771.2     $ 643.3
BALANCE SHEET
Total assets . . . . . . . . . . . . . . . . . . . . . . . . . . . . .      $5,576.8          $ 5,672.6     $5,343.9    $4,428.9    $3,513.7
Short-term borrowings . . . . . . . . . . . . . . . . . . . . .                   —               713.0        710.3       700.0       277.0
Long-term debt (including current portion) . . . . . .                         549.5              550.3        550.9         2.7         3.6
Shareholders’ equity . . . . . . . . . . . . . . . . . . . . . .            $3,045.7          $ 2,490.9     $2,284.1    $2,228.5    $2,090.3
STORE INFORMATION
Percentage change in comparable store sales(3)
  United States . . . . . . . . . . . . . . . . . . . . . . . . . .                    (6)%          (5)%          4%          7%          9%
  International . . . . . . . . . . . . . . . . . . . . . . . . . .                    (2)%           2%           7%          8%          6%
  Consolidated . . . . . . . . . . . . . . . . . . . . . . . . . .                     (6)%          (3)%          5%          7%          8%
Net stores opened (closed) during the year:
  United States
     Company — operated stores . . . . . . . . . . . . .                         (474)             445          1,065        810         580
     Licensed stores . . . . . . . . . . . . . . . . . . . . . .                   35              438            723        733         596
  International
     Company — operated stores . . . . . . . . . . . . .                              89            236           286         240         177
     Licensed stores . . . . . . . . . . . . . . . . . . . . . .                     305            550           497         416         319
Total . . . . . . . . . . . . . . . . . . . . . . . . . . . . . . . . . .            (45)         1,669         2,571       2,199       1,672


                                                                                19
Sep 27,    Sep 28,    Sep 30,     Oct 1,     Oct 2,
                                                                              2009       2008       2007       2006       2005
                                            (1)
As of and for the Fiscal Year Ended                                         (52 Wks)   (52 Wks)   (52 Wks)   (52 Wks)   (52 Wks)

Stores open at year end:
  United States
     Company-operated stores . . . . . . . . . . . . . . .                    6,764       7,238     6,793      5,728      4,918
     Licensed stores . . . . . . . . . . . . . . . . . . . . . .              4,364       4,329     3,891      3,168      2,435
  International
     Company-operated stores . . . . . . . . . . . . . . .                    2,068       1,979     1,743      1,457      1,217
     Licensed stores . . . . . . . . . . . . . . . . . . . . . .              3,439       3,134     2,584      2,087      1,671
Total . . . . . . . . . . . . . . . . . . . . . . . . . . . . . . . . . .    16,635      16,680    15,011     12,440     10,241

(1)
      The Company’s fiscal year ends on the Sunday closest to September 30.
(2)
      Fiscal 2009 and 2008 results include pretax restructuring charges of $332.4 million and $266.9 million,
      respectively.
(3)
      Includes only Starbucks Company-operated retail stores open 13 months or longer.


                                                                             20
Item 7.   Management’s Discussion and Analysis of Financial Condition and Results of Operations
General
Starbucks Corporation’s fiscal year ends on the Sunday closest to September 30. The fiscal years ended on
September 27, 2009, September 28, 2008 and September 30, 2007 all included 52 weeks. Starbucks 2010 fiscal year
will include 53 weeks, with the 53rd week falling in its fourth fiscal quarter. All references to store counts, including
data for new store openings, are reported net of related store closures, unless otherwise noted.

Overview
Fiscal 2009 was a challenging year for Starbucks. The Company was confronted with extraordinary economic and
operating challenges in addition to facing an increasingly competitive landscape. Although the global economy has
shown some signs of improvement recently, management recognizes the difficult economic situation that many
consumers are still facing and does not expect that to significantly change over the course of fiscal 2010. This
challenging economic environment has strained consumer discretionary spending in the US and internationally,
which in turn has impacted Company revenues, comparable store sales, operating income and operating margins.
Starbucks responded to this difficult environment with a more disciplined focus on operations and the introduction
of initiatives to permanently improve the Company’s cost structure. The result is an underlying business model that
is less reliant on high revenue growth to drive profitability, and that still preserves the fundamental strengths and
values of the Starbucks brand. The primary initiatives in this strategy include rationalizing the global Company-
operated store portfolio, right-sizing the non-retail support organization, and reducing the Company’s cost
structure, while renewing the focus on service excellence in the stores and delivering relevant innovation.
Starbucks actions to rationalize its global store portfolio have included the planned closure of nearly 1,000
Company-operated stores globally. At the end of fiscal 2009, nearly all of the approximately 800 US Company-
operated stores, 61 stores in Australia and 41 Company-operated stores in other International markets had been
closed. The remaining International store closures are expected to be completed by the end of fiscal 2010.
Initiatives targeting reductions in the Company’s cost structure in fiscal 2009 proceeded as planned, with full-year
costs of $580 million removed from the Company’s cost structure. These targeted cost reductions and associated
operational efficiency efforts, along with a more profitable Company-operated store base, have moved Starbucks
toward a more sustainable business model, while preserving the fundamental strengths and values of the brand. The
operational efficiency efforts are primarily focused on store level execution and include improved staffing models
and better management of waste in coffee, dairy and food.
Starbucks actions to improve the customer experience have resulted in a more focused effort toward in-store
offerings, and simplifying the demands on store partners (employees), while concurrently raising already-high
standards for beverage and food offerings, customer service and the overall in-store experience. The effects of these
efforts have already been seen in the Company’s improved customer satisfaction scores.
Starbucks has a renewed focus on relevant product innovation and the disciplined expansion and leveraging of its
existing products and sales channels. For example, Starbucks VIATM Ready Brew coffee was launched in fiscal 2009
and is designed to capture a significant share of both the $21 billion global instant coffee category and the single-
serve market. The Company intends to drive sales within the retail store base and CPG channels, both in the US and
internationally.
The Company continues to maintain a solid financial foundation, with no short term debt outstanding at the end of
fiscal 2009 and with cash and liquid investments totaling more than $650 million. This solid financial position and
continued strong cash flow generation have provided Starbucks with the financial flexibility to implement its
restructuring efforts as well as make ongoing investments in its core business.

Fiscal 2010 — The View Ahead
For fiscal 2010, the Company expects revenues to grow in the low-to-mid single digits compared to fiscal 2009,
driven by modestly positive comparable store sales, a 53rd fiscal week, and approximately 100 planned net new

                                                           21
stores in the US and approximately 200 net new stores in International markets. Both the US and International net
new additions are expected to be primarily licensed stores.
Given these revenue expectations, combined with the Company’s reduced cost structure, in-store operating
efficiencies, and lower restructuring charges, Starbucks currently expects significant improvement in its consol-
idated operating margin in fiscal 2010. Operating cash flow for fiscal 2010 is currently expected to reach
approximately $1.4 billion and capital expenditures are expected to range from $500 million to $550 million.

Operating Segment Overview
Starbucks has three reportable operating segments: US, International and CPG. The US foodservice business, which
was previously reported in the US segment, is now reported in the CPG segment, as a result of internal management
realignments within the US and CPG businesses. Segment information for all prior periods presented has been
revised to reflect this change.
The US and International segments both include Company-operated retail stores and licensed retail stores. Licensed
stores frequently have a higher operating margin than Company-operated stores. Under the licensed model,
Starbucks receives a reduced share of the total store revenues, but this is more than offset by the reduction in its
share of costs as these are primarily borne by the licensee. The International segment has a higher relative share of
licensed stores versus Company-operated compared to the US segment; however, the US segment has been
operating significantly longer than the International segment and has developed deeper awareness of, and
attachment to, the Starbucks brand and stores among its customer base. As a result, the more mature US segment
has significantly more stores, and higher total revenues than the International segment. Average sales per store are
also higher in the US due to various factors including length of time in market and local income levels. Further,
certain market costs, particularly occupancy costs, are lower in the US segment compared to the average for the
International segment, which comprises a more diverse group of operations. As a result of the relative strength of the
brand in the US segment, the number of stores, the higher unit volumes, and the lower market costs, the US segment,
despite its higher relative percentage of Company-operated stores, has a higher operating margin, excluding
restructuring costs, than the less-developed International segment.
The Company’s International store base continues to expand and Starbucks has been focusing on achieving
sustainable growth from established international markets while at the same time investing in emerging markets,
such as China, Brazil and Russia. The Company’s newer international markets require a more extensive support
organization, relative to the current levels of revenue and operating income.
The CPG segment includes packaged coffee and tea, and other branded products operations worldwide, and the US
foodservice business. For the packaged coffee and tea and branded products, Starbucks operates primarily through
licensing arrangements and joint ventures with large consumer products business partners, most significantly with
Kraft for distribution of packaged coffees and teas, and The North American Coffee Partnership with the Pepsi-Cola
Company for manufacturing and distribution of ready-to-drink beverages. This operating model allows the CPG
segment to leverage the business partners’ existing infrastructures and to extend the Starbucks brand in an efficient
way. Most of the customer revenues from the packaged coffee and ready-to-drink products are recognized as
revenues by the licensed or joint venture business partner, not by the CPG segment. Royalties and payments from
our licensing agreements are recorded under licensing revenue, and the proportionate share of the results of the
Company’s joint ventures are included, on a net basis, in Income from equity investees on the consolidated
statements of earnings. The US foodservice business sells coffee and other related products to institutional
foodservice companies with the majority of its sales through national broadline distribution networks. The CPG
segment reflects relatively lower revenues, a modest cost structure, and a resulting higher operating margin,
compared to the Company’s other two reporting segments, which consist primarily of retail stores.
Expenses pertaining to corporate administrative functions that support the operating segments but are not
specifically attributable to or managed by any segment are not included in the reported financial results of the
operating segments. These unallocated corporate expenses include certain general and administrative expenses,
related depreciation and amortization expenses, corporate restructuring charges and amounts included in Net
interest income and other and Interest expense on the consolidated statements of earnings.

                                                         22
Acquisitions

See Note 19 to the consolidated financial statements in this 10-K.


RESULTS OF OPERATIONS — FISCAL 2009 COMPARED TO FISCAL 2008

Financial Highlights

• Consolidated operating income was $562 million for fiscal 2009 compared to $504 million in fiscal 2008, and
  operating margin improved to 5.7% compared to 4.9% in fiscal 2008. Cost reduction initiatives and related
  operational efficiency efforts contributed significantly to the margin improvement, offset in part by higher
  restructuring charges incurred in fiscal 2009 compared to fiscal 2008 as Starbucks continued its work to
  rationalize its global store portfolio and support organization.

• EPS for fiscal 2009 was $0.52, compared to EPS of $0.43 reported in fiscal 2008. Restructuring charges impacted
  EPS by approximately $0.28 per share in fiscal 2009 and restructuring and other transformation costs impacted
  EPS by approximately $0.28 in fiscal 2008.

• Cash flow from operations was $1.4 billion in fiscal 2009 compared to $1.3 billion in fiscal 2008, while capital
  expenditures declined to $446 million in fiscal 2009 from $985 million in fiscal 2008. Available operating cash
  flow during fiscal 2009 was primarily used to reduce short-term borrowings to a zero balance in fiscal 2009, down
  from $713 million at the beginning of the fiscal year.

• The Company realized approximately $580 million in reductions to its cost structure in fiscal 2009, with the
  initiatives focused on store closures, headcount reductions, in-store efficiencies and supply chain improvements.

Consolidated results of operations (in millions):
                                                                               Sep 27,    Sep 28,               Sep 27,    Sep 28,
Fiscal Year Ended                                                               2009       2008      % Change    2009       2008
                                                                                                                  % of Total Net
                                                                                                                    Revenues

Net revenues:
  Company-operated retail . . . . . . . . . . . . . . . . . . . . .           $8,180.1   $ 8,771.9     (6.7)%    83.7%      84.5%
  Specialty:
     Licensing . . . . . . . . . . . . . . . . . . . . . . . . . . . . . .     1,222.3     1,171.6      4.3      12.5       11.3
     Foodservice and other . . . . . . . . . . . . . . . . . . . . .             372.2       439.5    (15.3)      3.8        4.2
   Total specialty . . . . . . . . . . . . . . . . . . . . . . . . . . . .     1,594.5     1,611.1     (1.0)     16.3       15.5
Total net revenues . . . . . . . . . . . . . . . . . . . . . . . . . .        $9,774.6   $10,383.0     (5.9)%   100.0% 100.0%

Company-operated retail revenues decreased from fiscal 2008, primarily attributable to a 6% decline in comparable
store sales, comprised of a 4% decline in transactions and a 2% decline in the average value per transaction. Foreign
currency translation also contributed to the decline with the effects of a stronger US dollar relative to the British
pound and Canadian dollar. The weakness in consolidated comparable store sales was driven by the US segment,
with a comparable store sales decline of 6% for the year. The International segment experienced a 2% decline in
comparable store sales.

The Company derived 16% of total net revenues from channels outside the Company-operated retail stores,
collectively known as specialty operations. The decrease in Foodservice and other revenue was primarily due to the
softness in the hospitality industry.


                                                                         23
Sep 27,          Sep 28,      %      Sep 27,    Sep 28,
Fiscal Year Ended                                                                    2009             2008      Change    2009       2008
                                                                                                                           % of Total Net
                                                                                                                             Revenues

Cost of sales including occupancy costs . . . . . . . . . .              . . . . $4,324.9           $4,645.3     (6.9)% 44.2%        44.7%
Store operating expenses . . . . . . . . . . . . . . . . . . . . .       . . . . 3,425.1             3,745.1     (8.5)  35.0         36.1
Other operating expenses . . . . . . . . . . . . . . . . . . . . .       ....       264.4              330.1    (19.9)   2.7          3.2
Depreciation and amortization expenses . . . . . . . . . .               ....       534.7              549.3     (2.7)   5.5          5.3
General and administrative expenses . . . . . . . . . . . .              ....       453.0              456.0     (0.7)   4.6          4.4
Restructuring charges. . . . . . . . . . . . . . . . . . . . . . . .     ....       332.4              266.9     24.5    3.4          2.6
Total operating expenses . . . . . . . . . . . . . . . . . . . . . . . . .              9,334.5      9,992.7     (6.6)    95.5       96.2
Income from equity investees . . . . . . . . . . . . . . . . . . . . . .                  121.9        113.6      7.3      1.2        1.1
  Operating income . . . . . . . . . . . . . . . . . . . . . . . . . . . . $ 562.0                  $ 503.9      11.5%     5.7%       4.9%
Supplemental ratios as a % of related revenues:
Store operating expenses . . . . . . . . . . . . . . . . . . . . . . . . .                                                41.9%      42.7%
Other operating expenses . . . . . . . . . . . . . . . . . . . . . . . . .                                                16.6%      20.5%

Cost of sales including occupancy costs decreased as a percentage of revenues primarily due to the implementation
of in-store operational efficiencies designed to reduce product waste, and due to lower dairy costs in the US,
partially offset by higher coffee costs.

Store operating expenses as a percentage of Company-operated retail revenues decreased primarily due to reduced
headcount and spending in the regional support organization as a result of Starbucks restructuring efforts, and the
effect of initiatives to improve store labor efficiencies.

Restructuring charges include lease exit and related costs associated with the actions to rationalize the Company’s
global store portfolio and reduce the global cost structure. See Note 2 to the consolidated financial statements for
further discussion.

Operating margin expansion was primarily due to the improved labor efficiency and reduced product waste in
Company-operated stores, partially offset by increased restructuring charges.
                                                                                          Sep 27,     Sep 28,     %      Sep 27,    Sep 28,
Fiscal Year Ended                                                                          2009        2008     Change    2009       2008
                                                                                                                           % of Total Net
                                                                                                                             Revenues

Operating income . . . . . . . . . . . . . . . . . . . . . . . . . . . . . . . . .        $562.0     $503.9      11.5%     5.7%       4.9%
Interest income and other, net . . . . . . . . . . . . . . . . . . . . . . . .              36.3        9.0       nm       0.4        0.1
Interest expense . . . . . . . . . . . . . . . . . . . . . . . . . . . . . . . . . .       (39.1)     (53.4)    (26.8)    (0.4)      (0.5)
  Earnings before income taxes . . . . . . . . . . . . . . . . . . . . . .                 559.2       459.5     21.7      5.7        4.4
Income taxes. . . . . . . . . . . . . . . . . . . . . . . . . . . . . . . . . . . . .      168.4       144.0     16.9      1.7        1.4
   Net earnings. . . . . . . . . . . . . . . . . . . . . . . . . . . . . . . . . . .      $390.8     $315.5      23.9%     4.0%       3.0%
Effective tax rate. . . . . . . . . . . . . . . . . . . . . . . . . . . . . . . . . .                                     30.1%      31.3%

Net interest income and other increased due primarily to the impact of foreign currency fluctuations on certain
balance sheet amounts. Also contributing to the increase were lower unrealized market value losses on the
Company’s trading securities portfolio compared to fiscal 2008. As described in more detail in Note 3 to the
consolidated financial statements, the trading securities approximate a portion of the Company’s liability under its
Management Deferred Compensation Plan (“MDCP”). The MDCP liability also increases and decreases with
changes in investment performance, with this offsetting impact recorded in General and administrative expenses on
the consolidated statements of earnings. Interest expense decreased due to a lower average balance of short term

                                                                          24
borrowings and lower average short term borrowing rates in fiscal 2009 compared to the prior year. At the end of
fiscal 2009, the Company had no short term debt.
The relatively low 2009 effective tax rate was primarily due to a tax benefit recognized for retroactive tax credits
and an income tax credit related to the settlement of an employment tax audit in fiscal 2009. As a result of the audit
settlement, approximately $17 million of expense was recorded in Store operating expenses, with an offsetting
income tax credit and no impact to net earnings. The effective tax rate for fiscal 2010 is expected to be in the range
of 34% to 35%.

Operating Segments
Segment information is prepared on the same basis that the Company’s management reviews financial information
for operational decision making purposes. Starbucks has three reportable operating segments: US, International and
CPG. Unallocated Corporate includes expenses pertaining to corporate administrative functions that support the
operating segments but are not specifically attributable to or managed by any segment and are not included in the
reported financial results of the operating segments. Operating income represents earnings before Net interest
income and other, Interest expense and Income taxes.
The US foodservice business, which was previously reported in the US segment, is now reported in the CPG
segment, as a result of internal management realignments within the US and CPG businesses. Segment information
for all prior periods presented has been revised to reflect this change.
The following tables summarize the Company’s results of operations by segment for fiscal 2009 and 2008 (in
millions).

United States
The US operating segment sells coffee and other beverages, complementary food, whole bean coffees, and coffee
brewing equipment and merchandise primarily through Company-operated retail stores. Specialty operations
within the US include licensed retail stores and other initiatives related to the Company’s core business.
                                                                                 Sep 27,    Sep 28,     %       Sep 27,    Sep 28,
Fiscal Year Ended                                                                 2009       2008     Change     2009       2008
                                                                                                                As a % of US Total
                                                                                                                  Net Revenues

Net revenues:
Company-operated retail . . . . . . . . . . . . . . . . . . . . . . . . . $6,572.1         $6,997.7    (6.1)%    92.5%      92.9%
  Specialty:
     Licensing . . . . . . . . . . . . . . . . . . . . . . . . . . . . . . . . .   528.9      504.2     4.9        7.4        6.7
     Other . . . . . . . . . . . . . . . . . . . . . . . . . . . . . . . . . . . .   3.6       30.1   (88.0)       0.1        0.4
         Total specialty . . . . . . . . . . . . . . . . . . . . . . . . . . .     532.5      534.3    (0.3)       7.5        7.1
Total net revenues . . . . . . . . . . . . . . . . . . . . . . . . . . . . . $7,104.6      $7,532.0    (5.7)% 100.0% 100.0%


                                                                        25
Company-operated retail revenues decreased year over year primarily due to a 6% decrease in comparable store
sales, comprised of a 4% decrease in transactions, and a 2% decrease in average value per transaction.
                                                                                  Sep 27,    Sep 28,      %       Sep 27,    Sep 28,
Fiscal Year Ended                                                                  2009       2008      Change     2009       2008
                                                                                                                  As a % of US Total
                                                                                                                    Net Revenues

Cost of sales including occupancy costs . . . . . . . . . .             . . . . $2,965.7    $3,206.3     (7.5)% 41.7%         42.6%
Store operating expenses . . . . . . . . . . . . . . . . . . . . .      . . . . 2,815.1      3,081.0     (8.6)  39.6          40.9
Other operating expenses . . . . . . . . . . . . . . . . . . . . .      ....        81.4       111.7    (27.1)   1.1           1.5
Depreciation and amortization expenses . . . . . . . . . .              ....       378.1       395.4     (4.4)   5.3           5.2
General and administrative expenses . . . . . . . . . . . .             ....        86.7        71.2     21.8    1.2           0.9
Restructuring charges. . . . . . . . . . . . . . . . . . . . . . . .    ....       246.3       210.9     16.8    3.5           2.8
  Total operating expenses . . . . . . . . . . . . . . . . . . . . . . .          6,573.3    7,076.5     (7.1)     92.5       94.0
Income (loss) from equity investees . . . . . . . . . . . . . . . . .                 0.5       (1.3)     nm         —          —
   Operating income . . . . . . . . . . . . . . . . . . . . . . . . . . . . $ 531.8         $ 454.2      17.1%      7.5%        6.0%
Supplemental ratios as a % of related revenues:
Store operating expenses . . . . . . . . . . . . . . . . . . . . . . . . .                                         42.8%      44.0%
Other operating expenses . . . . . . . . . . . . . . . . . . . . . . . . .                                         15.3%      20.9%
Operating margin expanded primarily due to lower store operating expenses, lower cost of sales including
occupancy costs, and lower other operating expenses as a percentage of total revenues. This improvement was
primarily due to operational changes designed to improve labor efficiency and reduce product waste in Company-
operated stores, and to lower non-store support costs. Partially offsetting the favorability were higher restructuring
charges during the year. The Company incurred higher lease exit and related costs due to the higher number of
actual store closures compared to the prior year period.

International
The International operating segment sells coffee and other beverages, complementary food, whole bean coffees,
and coffee brewing equipment and merchandise through Company-operated retail stores in Canada, the UK and
several other markets. Specialty operations primarily include retail store licensing operations in nearly 40 other
countries and foodservice accounts, primarily in Canada and the UK. The Company’s International store base
continues to expand and Starbucks expects to achieve a growing contribution from established areas of the business
while at the same time investing in emerging markets and channels. Many of the Company’s International
operations are in early stages of development that require a more extensive support organization, relative to the
current levels of revenue and operating income, than in the US. This continuing investment is part of the Company’s
long-term, balanced plan for profitable growth.
                                                                                  Sep 27,    Sep 28,      %       Sep 27,    Sep 28,
Fiscal Year Ended                                                                  2009       2008      Change     2009        2008
                                                                                                                      As a % of
                                                                                                                  International Total
                                                                                                                     Net Revenues

Net revenues:
Company-operated retail . . . . . . . . . . . . . . . . . . . . . . . . . $1,608.0          $1,774.2     (9.4)%    83.7%       84.3%
Specialty:
  Licensing. . . . . . . . . . . . . . . . . . . . . . . . . . . . . . . . . . . 266.2         274.8     (3.1)     13.9        13.1
  Foodservice and other . . . . . . . . . . . . . . . . . . . . . . . . .         46.2          54.4    (15.1)      2.4         2.6
      Total specialty . . . . . . . . . . . . . . . . . . . . . . . . . . . . .     312.4      329.2     (5.1)     16.3        15.7
Total net revenues . . . . . . . . . . . . . . . . . . . . . . . . . . . . . $1,920.4       $2,103.4     (8.7)% 100.0% 100.0%

                                                                         26
Company-operated retail revenues decreased primarily due to unfavorable foreign currency exchange rates,
particularly for the British pound and Canadian dollar. Partially offsetting the decrease were the net new store
openings of 89 Company-operated stores.

Specialty revenues decreased primarily due to continued softness in the hospitality industry and unfavorable foreign
currency exchange rates.
                                                                                    Sep 27,        Sep 28,      %       Sep 27,    Sep 28,
Fiscal Year Ended                                                                    2009           2008      Change     2009        2008
                                                                                                                            As a % of
                                                                                                                        International Total
                                                                                                                           Net Revenues

Cost of sales including occupancy costs . . . . . . . . . .              . . . . $ 963.7          $1,054.0     (8.6)% 50.2%         50.1%
Store operating expenses . . . . . . . . . . . . . . . . . . . . .       ....      610.0             664.1     (8.1)  31.8          31.6
Other operating expenses . . . . . . . . . . . . . . . . . . . . .       ....       72.9              88.5    (17.6)   3.8           4.2
Depreciation and amortization expenses . . . . . . . . . .               ....      102.5             108.8     (5.8)   5.3           5.2
General and administrative expenses . . . . . . . . . . . .              ....      105.0             113.0     (7.1)   5.5           5.4
Restructuring charges. . . . . . . . . . . . . . . . . . . . . . . .     ....       27.0              19.2     40.6    1.4           0.9
  Total operating expenses . . . . . . . . . . . . . . . . . . . . . . .            1,881.1        2,047.6     (8.1)     98.0       97.3
Income from equity investees . . . . . . . . . . . . . . . . . . . . . .               53.6           54.2     (1.1)      2.8        2.6
   Operating income . . . . . . . . . . . . . . . . . . . . . . . . . . . . $           92.9      $ 110.0     (15.5)%     4.8%        5.2%
Supplemental ratios as a % of related revenues:
Store operating expenses . . . . . . . . . . . . . . . . . . . . . . . . .                                               37.9%      37.4%
Other operating expenses . . . . . . . . . . . . . . . . . . . . . . . . .                                               23.3%      26.9%

Operating margin decreased primarily due to higher restructuring charges and higher store operating expenses as a
percentage of total revenues. Restructuring charges of $27.0 million recognized during the year had a 50 basis point
impact on operating margin compared to the prior year, due to the previously announced store closures. Higher store
operating expenses as of percentage of Company-operated retail revenues were driven by an increase in store
impairment charges and a decline in sales leverage impacting salaries and benefits. Partially offsetting the decrease
in operating margin were lower other operating expenses due to headcount reductions in the non-store support
functions.


Global Consumer Products Group

CPG’s licensing revenue is from selling a selection of whole bean and ground coffees and premium Tazo» teas
through licensing arrangements in US and international markets, and also producing and selling a variety of
ready-to-drink beverages through its joint ventures and marketing and distribution agreements. The foodservice
revenue is from the US foodservice business, which sells coffee and other related products to institutional
foodservice companies with the majority of its sales through national broadline distribution networks.
                                                                                        Sep 27,     Sep 28,     %       Sep 27,    Sep 28,
Fiscal Year Ended                                                                        2009        2008     Change     2009        2008
                                                                                                                         As a % of CPG
                                                                                                                        Total Net Revenues

Net revenues:
  Licensing . . . . . . . . . . . . . . . . . . . . . . . . . . . . . . . . . . . . .   $427.2     $392.6       8.8%     57.0%       52.5%
  Foodservice. . . . . . . . . . . . . . . . . . . . . . . . . . . . . . . . . . . .     322.4      355.0      (9.2)     43.0        47.5
      Total specialty . . . . . . . . . . . . . . . . . . . . . . . . . . . . . . .     $749.6     $747.6      0.3%     100.0% 100.0%

                                                                          27
Total net revenues increased primarily due to higher revenues from packaged coffees, partially offset by lower
foodservice revenues caused by continued softness in the hospitality industry.
                                                                                           Sep 27,     Sep 28,     %       Sep 27,    Sep 28,
Fiscal Year Ended                                                                           2009        2008     Change     2009       2008
                                                                                                                            As a % of CPG
                                                                                                                             Total Revenues

Cost of sales . . . . . . . . . . . . . . . . . . . . . . . . . . . . . . . . . . . . .    $395.5     $385.0       2.7%     52.8%      51.5%
Other operating expenses. . . . . . . . . . . . . . . . . . . . . . . . . . . .             110.1      129.9     (15.2)     14.7       17.4
Depreciation and amortization expenses . . . . . . . . . . . . . . . . .                      5.7        6.3      (9.5)      0.8        0.8
General and administrative expenses . . . . . . . . . . . . . . . . . . .                     8.8        7.9      11.4       1.2        1.1
Restructuring charges . . . . . . . . . . . . . . . . . . . . . . . . . . . . . .             1.0         —        nm        0.1         —
  Total operating expenses . . . . . . . . . . . . . . . . . . . . . . . . . .              521.1       529.1     (1.5)     69.5       70.8
Income from equity investees . . . . . . . . . . . . . . . . . . . . . . . .                 67.8        60.7     11.7       9.0        8.1
   Operating income . . . . . . . . . . . . . . . . . . . . . . . . . . . . . .            $296.3     $279.2       6.1%     39.5%      37.3%

Growth of operating margin was primarily due to lower other operating expenses in the foodservice business due to
lower compensation costs and lower marketing expenses.

Unallocated Corporate
Unallocated corporate expenses pertain to corporate administrative functions that support, but are not specifically
attributable to the Company’s operating segments.
                                                                                          Sep 27,     Sep 28,      %       Sep 27,    Sep 28,
Fiscal Year Ended                                                                          2009        2008      Change     2009        2008
                                                                                                                           As a % of Total Net
                                                                                                                                Revenues

Depreciation and amortization expenses . . . . . . . . . . . . . . . $ 48.4                          $ 38.8      24.7%       0.5%       0.4%
General and administrative expenses . . . . . . . . . . . . . . . . . .         252.5                 263.9      (4.3)       2.6        2.5
Restructuring charges . . . . . . . . . . . . . . . . . . . . . . . . . . . . .  58.1                  36.8      57.9        0.6        0.4
   Operating loss . . . . . . . . . . . . . . . . . . . . . . . . . . . . . . . . $(359.0)           $(339.5)     (5.7)%    (3.7)%      (3.3)%

Total unallocated corporate expenses increased primarily as a result of restructuring charges incurred for corporate
office facilities that were no longer occupied by the Company due to the reduction in positions within the non-store
support organization.

RESULTS OF OPERATIONS — FISCAL 2008 COMPARED TO FISCAL 2007
Consolidated results of operations (in millions):
                                                                                      Sep 28,         Sep 30,      %       Sep 28,    Sep 30,
Fiscal Year Ended                                                                      2008            2007      Change     2008       2007
                                                                                                                             % of Total Net
                                                                                                                               Revenues

Net revenues:
  Company-operated retail. . . . . . . . . . . . . . . . . . . . . . .             $ 8,771.9         $7,998.3      9.7%     84.5%       85.0%
  Specialty:
     Licensing . . . . . . . . . . . . . . . . . . . . . . . . . . . . . . . .        1,171.6         1,026.3    14.2       11.3        10.9
     Foodservice and other . . . . . . . . . . . . . . . . . . . . . . .                439.5           386.9    13.6        4.2         4.1
   Total specialty . . . . . . . . . . . . . . . . . . . . . . . . . . . . . .        1,611.1         1,413.2    14.0       15.5        15.0
Total net revenues . . . . . . . . . . . . . . . . . . . . . . . . . . . .         $10,383.0         $9,411.5    10.3%     100.0% 100.0%

                                                                            28
Net revenues for the fiscal year ended 2008 increased due to growth in both Company-operated retail revenues and
specialty operations.
During fiscal 2008, Starbucks derived 84% of total net revenues from its Company-operated retail stores. Company-
operated retail revenues increased, primarily attributable to the opening of 681 new Company-operated retail stores
in fiscal 2008, offset by negative 3% comparable store sales for the same period. Revenue growth was slower than in
previous years due to a combination of declining comparable store sales and a decrease in the number of net new
stores opened during fiscal 2008. The weakness in consolidated comparable store sales was driven by the US
segment, which posted a comparable store sales decline of 5% for the year. Partially offsetting this was 2%
comparable store sales growth in the International segment. Within fiscal 2008, consolidated quarterly revenue
growth decelerated each quarter and comparable store sales declined each quarter, reflecting the ongoing
challenging economic conditions in the US.
The Company derived the remaining 16% of total net revenues from specialty operations. Licensing revenues
increased primarily due to higher product sales and royalty revenues from the opening of 988 new licensed retail
stores in fiscal 2008. The increase in Foodservice and other revenues was primarily driven by growth in new and
existing accounts in the foodservice business in the US.
                                                                               Sep 28,    Sep 30,     %       Sep 28,    Sep 30,
Fiscal Year Ended                                                               2008       2007     Change     2008        2007
                                                                                                                % of Total Net
                                                                                                                   Revenues

Cost of sales including occupancy costs . . . . . . . . . . . .               $4,645.3   $3,999.1    16.2%    44.7%       42.5%
Store operating expenses . . . . . . . . . . . . . . . . . . . . . . . .       3,745.1    3,215.9    16.5     36.1        34.2
Other operating expenses . . . . . . . . . . . . . . . . . . . . . . . .         330.1      294.2    12.2      3.2         3.1
Depreciation and amortization expenses . . . . . . . . . . . . .                 549.3      467.2    17.6      5.3         5.0
General and administrative expenses. . . . . . . . . . . . . . . .               456.0      489.2    (6.8)     4.4         5.2
Restructuring charges . . . . . . . . . . . . . . . . . . . . . . . . . . .      266.9         —      nm       2.6          —
Total operating expenses . . . . . . . . . . . . . . . . . . . . . . . .       9,992.7    8,465.6    18.0     96.2        89.9
Income from equity investees . . . . . . . . . . . . . . . . . . . . .           113.6      108.0     5.2      1.1         1.1
Operating income. . . . . . . . . . . . . . . . . . . . . . . . . . . . .     $ 503.9    $1,053.9   (52.2)%     4.9%      11.2%
Supplemental ratios as a % of related revenues:
Store operating expenses . . . . . . . . . . . . . . . . . . . . . . . .                             42.7%    40.2%
Other operating expenses . . . . . . . . . . . . . . . . . . . . . . . .                             20.5%    20.8%
Since many of the Company’s operating expenses are fixed in nature, the softness in US revenues during fiscal 2008
impacted nearly all consolidated and US segment operating expense line items when viewed as a percentage of
sales, and pressured operating margins.
Cost of sales including occupancy costs increased primarily due to higher distribution costs and higher rent
expenses as a percentage of revenues. Store operating expenses as a percentage of Company-operated retail
revenues increased primarily due to higher payroll expenditures as a percentage of revenues coupled with
impairment provisions in the US business, primarily driven by the slowdown in projected store openings.
Depreciation and amortization expenses increased primarily due to the opening of 681 new Company-operated
retail stores in fiscal 2008. General and administrative expenses decreased primarily due to lower payroll-related
expenses. Restructuring charges include asset impairment, lease exit and severance costs. These costs are associated
with the closure of underperforming stores in the US and Australia, and the rationalization of the Company’s
leadership structure and non-store organization.


                                                                       29
Operating margin compression was primarily due to lower revenues; in addition, restructuring charges accounted
for approximately 40% of the decrease.
                                                                                      Sep 28,    Sep 30,      %       Sep 28,    Sep 30,
Fiscal Year Ended                                                                      2008       2007      Change     2008       2007
                                                                                                                        % of Total Net
                                                                                                                          Revenues

Operating income . . . . . . . . . . . . . . . . . . . . . . . . . . . . . . . . $503.9         $1,053.9    (52.2)%     4.9%      11.2%
Interest income and other, net . . . . . . . . . . . . . . . . . . . . . . .         9.0            40.4    (77.7)      0.1        0.4
Interest expense . . . . . . . . . . . . . . . . . . . . . . . . . . . . . . . . . (53.4)          (38.0)    40.5      (0.5)      (0.4)
Earnings before income taxes . . . . . . . . . . . . . . . . . . . . . . .             459.5     1,056.3    (56.5)      4.4       11.2
Income taxes . . . . . . . . . . . . . . . . . . . . . . . . . . . . . . . . . . .     144.0       383.7    (62.5)      1.4        4.1
Net earnings . . . . . . . . . . . . . . . . . . . . . . . . . . . . . . . . . . . $315.5       $ 672.6     (53.1)%     3.0%       7.1%

Net interest income and other decreased due primarily to unrealized market value losses on the Company’s trading
securities portfolio. The trading securities approximate a portion of the Company’s liability under its MDCP plan.
The MDCP liability also increases and decreases with changes in investment performance, with this offsetting
impact recorded in General and administrative expenses on the consolidated statements of earnings. Interest
expense increased due to the Company’s issuance of $550 million of 10-year 6.25% Senior Notes in August of fiscal
2007.
Income taxes for fiscal 2008 resulted in an effective tax rate of 31.3% compared to 36.3% for fiscal 2007. The lower
rate was due to the higher proportion of income earned in foreign jurisdictions which have lower tax rates, as well as
an increase in the domestic manufacturing deduction for manufacturing activities in the US.

United States
                                                                                     Sep 28,     Sep 30,      %       Sep 28,    Sep 30,
Fiscal Year Ended                                                                     2008        2007      Change     2008       2007
                                                                                                                      As a % of US Total
                                                                                                                        Net Revenues

Net revenues:
  Company-operated retail . . . . . . . . . . . . . . . . . . . . . . . $6,997.7                $6,560.9      6.7%     92.9%      93.4%
  Specialty:
     Licensing . . . . . . . . . . . . . . . . . . . . . . . . . . . . . . . . .   504.2           439.1     14.8        6.7        6.3
     Other . . . . . . . . . . . . . . . . . . . . . . . . . . . . . . . . . . . .  30.1            22.9     31.4        0.4        0.3
         Total specialty . . . . . . . . . . . . . . . . . . . . . . . . . . .         534.3       462.0     15.6        7.1        6.6
Total net revenues . . . . . . . . . . . . . . . . . . . . . . . . . . . . . $7,532.0           $7,022.9      7.2%    100.0% 100.0%


                                                                         30
Company-operated retail revenues increased primarily due to the opening of 445 new Company-operated retail
stores in fiscal 2008, partially offset by a 5% decrease in comparable store sales for fiscal 2008. The US Company-
operated retail business continued to experience deteriorating trends in transactions during the year, driven by the
US economic slowdown. Licensing revenues increased primarily due to higher product sales and royalty revenues
as a result of opening 438 new licensed retail stores in fiscal 2008.
                                                                                 Sep 28,     Sep 30,     %       Sep 28,    Sep 30,
Fiscal Year Ended                                                                 2008        2007     Change     2008       2007
                                                                                                                 As a % of US Total
                                                                                                                   Net Revenues

Cost of sales including occupancy costs . . . . . . . . . .            . . . . $3,206.3     $2,804.0    14.3%     42.6%      39.9%
Store operating expenses . . . . . . . . . . . . . . . . . . . . .     . . . . 3,081.0       2,684.2    14.8      40.9       38.2
Other operating expenses . . . . . . . . . . . . . . . . . . . . .     ....       111.7        104.5     6.9       1.5        1.5
Depreciation and amortization expenses . . . . . . . . . .             ....       395.4        341.7    15.7       5.2        4.9
General and administrative expenses . . . . . . . . . . . .            ....        71.2         84.1   (15.3)      0.9        1.2
Restructuring charges. . . . . . . . . . . . . . . . . . . . . . . .   ....       210.9           —      nm        2.8         —
         Total operating expenses . . . . . . . . . . . . . . . . . .            7,076.5     6,018.5    17.6      94.0       85.7
Income (loss) from equity investees . . . . . . . . . . . . . . . . .               (1.3)        0.8     nm         —          —
            Operating income . . . . . . . . . . . . . . . . . . . . . . $ 454.2            $1,005.2   (54.8)%     6.0%      14.3%
Supplemental ratios as a % of related revenues:
Store operating expenses . . . . . . . . . . . . . . . . . . . . . . . . .                                        44.0%      40.9%
Other operating expenses . . . . . . . . . . . . . . . . . . . . . . . . .                                        20.9%      22.6%

Operating margin contracted significantly primarily due to restructuring charges incurred and to softer revenues due
to weak traffic, as well as higher cost of sales including occupancy costs and higher store operating expenses as a
percentage of revenues. Restructuring charges of $210.9 million had a 280 basis point impact on the operating
margin. The increase in cost of sales including occupancy costs was primarily due to higher distribution costs and
higher rent expenses as a percentage of revenues. Higher store operating expenses was due to the softer sales, higher
payroll-related expenditures, and charges from canceling future store sites and asset impairments.

International
                                                                                 Sep 28,     Sep 30,     %       Sep 28,    Sep 30,
Fiscal Year Ended                                                                 2008        2007     Change     2008       2007
                                                                                                                     As a % of
                                                                                                                   International
                                                                                                                     Total Net
                                                                                                                     Revenues

Net revenues:
  Company-operated retail . . . . . . . . . . . . . . . . . . . . . . . $1,774.2            $1,437.4    23.4%     84.3%      84.7%
  Specialty:
     Licensing . . . . . . . . . . . . . . . . . . . . . . . . . . . . . . . . . 274.8         220.9    24.4      13.1       13.0
     Foodservice and other . . . . . . . . . . . . . . . . . . . . . . .          54.4          37.9    43.5       2.6        2.2
         Total specialty . . . . . . . . . . . . . . . . . . . . . . . . . . .     329.2       258.8    27.2      15.7       15.3
Total net revenues . . . . . . . . . . . . . . . . . . . . . . . . . . . . . $2,103.4       $1,696.2    24.0%    100.0% 100.0%

Company-operated retail revenues increased due to the opening of 236 new Company-operated retail stores in fiscal
2008, favorable foreign currency exchange rates, primarily on the Canadian dollar, and comparable store sales
growth of 2% for fiscal 2008. In the fourth quarter of fiscal 2008, Company-operated retail revenues grew at a
slower rate year-over-year of 12% and comparable store sales were flat compared to the same quarter in fiscal 2007,
both driven by slowdowns in the UK and Canada, due to the weakening global economy.

                                                                        31
Specialty revenues increased primarily due to higher product sales and royalty revenues from opening 550 new
licensed retail stores in fiscal 2008.
                                                                                    Sep 28,       Sep 30,      %       Sep 28,    Sep 30,
Fiscal Year Ended                                                                    2008          2007      Change     2008       2007
                                                                                                                           As a % of
                                                                                                                         International
                                                                                                                           Total Net
                                                                                                                           Revenues

Cost of sales including occupancy costs . . . . . . . . . .              . . . . $1,054.0         $ 824.6     27.8%     50.1%      48.6%
Store operating expenses . . . . . . . . . . . . . . . . . . . . .       ....       664.1           531.7     24.9      31.6       31.3
Other operating expenses . . . . . . . . . . . . . . . . . . . . .       ....        88.5            69.9     26.6       4.2        4.1
Depreciation and amortization expenses . . . . . . . . . .               ....       108.8            84.2     29.2       5.2        5.0
General and administrative expenses . . . . . . . . . . . .              ....       113.0            93.8     20.5       5.4        5.5
Restructuring charges. . . . . . . . . . . . . . . . . . . . . . . .     ....        19.2             —        nm        0.9         —
      Total operating expenses . . . . . . . . . . . . . . . . . . . .              2,047.6       1,604.2     27.6      97.3       94.6
Income from equity investees . . . . . . . . . . . . . . . . . . . . . .               54.2          45.7     18.6       2.6        2.7
          Operating income . . . . . . . . . . . . . . . . . . . . . . . . $ 110.0                $ 137.7    (20.1)%     5.2%       8.1%
Supplemental ratios as a % of related revenues:
Store operating expenses . . . . . . . . . . . . . . . . . . . . . . . . .                                              37.4%      37.0%
Other operating expenses . . . . . . . . . . . . . . . . . . . . . . . . .                                              26.9%      27.0%
Operating margin decreased primarily due to higher cost of sales including occupancy costs driven by continued
expansion of lunch and warming programs in Canada, higher distribution costs, and higher building maintenance
expense due to store renovation activities. In addition, restructuring charges of $19.2 million recognized in fiscal
2008 had a 90 basis point impact on the operating margin, nearly all due to the closure of 61 Company-operated
stores in Australia.

Global Consumer Products Group
                                                                                        Sep 28,    Sep 30,     %       Sep 28,    Sep 30,
Fiscal Year Ended                                                                        2008       2007     Change     2008       2007
                                                                                                                        As a % of CPG
                                                                                                                           Total Net
                                                                                                                           Revenues

Net revenues:
  Licensing . . . . . . . . . . . . . . . . . . . . . . . . . . . . . . . . . . . . .   $392.6     $366.3     7.2%      52.5%      52.9%
     Foodservice . . . . . . . . . . . . . . . . . . . . . . . . . . . . . . . . . .     355.0      326.1     8.9%      47.5       47.1
          Total specialty . . . . . . . . . . . . . . . . . . . . . . . . . . . . .     $747.6     $692.4     8.0%     100.0% 100.0%


                                                                          32
Foodservice revenues increased primarily due to growth in new and existing foodservice accounts, and licensing
revenue increased due to higher royalties and product sales in the international ready-to-drink business and
increased sales of US packaged tea and International club packaged coffee.
                                                                                           Sep 28,    Sep 30,     %      Sep 28,    Sep 30,
Fiscal Year Ended                                                                           2008       2007     Change    2008       2007
                                                                                                                          As a % of CPG
                                                                                                                             Total Net
                                                                                                                             Revenues

Cost of sales . . . . . . . . . . . . . . . . . . . . . . . . . . . . . . . . . . . . .    $385.0    $370.5       3.9%    51.5%      53.5%
Other operating expenses. . . . . . . . . . . . . . . . . . . . . . . . . . . .             129.9     119.8       8.4     17.4       17.3
Depreciation and amortization expenses . . . . . . . . . . . . . . . . .                      6.3       6.6      (4.5)     0.8        1.0
General and administrative expenses . . . . . . . . . . . . . . . . . . .                     7.9       8.1      (2.5)     1.1        1.2
      Total operating expenses . . . . . . . . . . . . . . . . . . . . . .                  529.1      505.0      4.8     70.8       72.9
Income from equity investees . . . . . . . . . . . . . . . . . . . . . . . .                 60.7       61.5     (1.3)     8.1        8.9
          Operating income . . . . . . . . . . . . . . . . . . . . . . . . . . .           $279.2    $248.9     12.2%     37.3%      35.9%

Growth of operating margin was primarily due to lower cost of sales as a percentage of revenues, partially offset by
lower income from equity investees. Lower cost of sales was primarily due to a sales mix shift to more profitable
products.

Unallocated Corporate
                                                                                          Sep 28,    Sep 30,      %      Sep 28,    Sep 30,
Fiscal Year Ended                                                                          2008       2007      Change    2008       2007
                                                                                                                             As a % of
                                                                                                                             Total Net
                                                                                                                             Revenues

Depreciation and amortization expenses . . . . . . . . . . . . . . . $ 38.8                          $ 34.7      11.8%     0.4%       0.4%
General and administrative expenses . . . . . . . . . . . . . . . . . .         263.9                 303.2     (13.0)     2.5        3.2
Restructuring charges . . . . . . . . . . . . . . . . . . . . . . . . . . . . .  36.8                   —         nm       0.4        —
   Operating loss. . . . . . . . . . . . . . . . . . . . . . . . . . . . . . . . . $(339.5)          $(337.9)     0.5%    (3.3)%     (3.6)%

Total unallocated corporate expenses remained relatively flat due to lower payroll-related expenditures, which were
offset by restructuring charges incurred for corporate office facilities that were no longer occupied by the Company
due to the reduction in positions within Starbucks leadership structure and non-store organization.

FINANCIAL CONDITION, LIQUIDITY AND CAPITAL RESOURCES
The Company’s existing cash and liquid investments were $666.1 million and $322.3 million as of September 27,
2009 and September 28, 2008, respectively.
The Company manages its cash and liquid investments in order to internally fund operating needs and make
scheduled interest and principal payments on its borrowings.
Included in the cash and liquid investment balances are the following:
      • A portfolio of unrestricted trading securities, designed to hedge the Company’s liability under the MDCP.
        The value of this portfolio was $44.8 million and $49.5 million as of September 27, 2009 and September 28,
        2008, respectively. The decrease was primarily driven by declines in market values of the underlying equity
        funds. See Note 3 for further details.
      • Unrestricted cash and liquid securities held within the Company’s wholly owned captive insurance company
        to fund claim payouts. The value of these unrestricted cash and liquid securities was approximately
        $11.8 million and $24.0 million as of September 27, 2009 and September 28, 2008, respectively.

                                                                            33
As of September 27, 2009, the Company had $92.7 million invested in available-for-sale securities. Included in
available-for-sale securities were $55.7 million of auction rate securities (“ARS”), compared with $59.8 million of
ARS held as of September 28, 2008, with the decrease due to calls of individual securities. As described in more
detail in Note 3, while the ongoing auction failures will limit the liquidity of these investments for some period of
time, the Company does not believe the auction failures will materially impact its ability to fund its working capital
needs, capital expenditures or other business requirements.
Credit rating agencies currently rate the Company’s borrowings as follows:
     Description                                                                                               Standard & Poor’s   Moody’s

     Short-term debt . . . . . . . . . . . . . . . . . . . . . . . . . . . . . . . . . . . . . . . . . .              A-2             P-3
     Senior unsecured long-term debt. . . . . . . . . . . . . . . . . . . . . . . . . . . . . .                      BBB            Baa3
     Outlook . . . . . . . . . . . . . . . . . . . . . . . . . . . . . . . . . . . . . . . . . . . . . . . .        Stable         Stable
On August 28, 2009, Standard and Poor’s Ratings Services revised its outlook on the Company’s credit ratings to
stable from negative based on improved credit metrics and stabilizing performance. The rating agency also affirmed
the BBB corporate credit rating on the Company and raised the short-term rating to A-2 from A-3 to conform with
the stable rating outlook. As a result of the Moody’s P-3 short-term rating issued in May 2009, commercial paper
has become less liquid and more expensive than borrowing under the Company’s credit facility. Consequently, the
Company utilized its credit facility for almost all short-term borrowing needs subsequent to May 2009. In the latter
half of the year the Company reduced its total short-term borrowings to a zero balance due to strong operating cash
flows and lower capital spending on new Company-operated stores. Management is unlikely to make significant use
of its commercial paper program until its Moody’s short-term ratings improve.
Despite limited access to the commercial paper markets, management believes that cash flow from operations and
its existing cash and liquid investments, supplemented as needed by the $1 billion in short-term borrowing capacity
under the Company’s revolving credit facility, will be sufficient to finance capital requirements for its core
businesses for the foreseeable future, as well as to fund the cost of lease termination and related costs from the
remaining international store closures. Significant new joint ventures, acquisitions and/or other new business
opportunities may require additional outside funding.
The Company’s credit facility contains provisions requiring Starbucks to maintain compliance with certain
covenants, including a minimum fixed charge coverage ratio. On June 8, 2009, the credit facility was amended
to more accurately reflect the parties’ intent with respect to Amendment No. 4 to the credit facility. Amendment
No. 5 to the credit facility did not impact the Company’s borrowing terms, facility size, or covenant ratio, and was
completed at minimal cost to the Company. As of September 27, 2009 and September 28, 2008, the Company was in
compliance with each of these covenants.
The $550 million of 10-year 6.25% Senior Notes, issued in fiscal 2007, also require Starbucks to maintain
compliance with certain covenants that limit future liens and sale and leaseback transactions on certain material
properties. As of September 27, 2009 and September 28, 2008, the Company was in compliance with each of these
covenants.
The Company generated strong operating cash flow during the year ended September 27, 2009 and used its free cash
flow to reduce its short-term borrowings from $713.0 million at the end of fiscal 2008 to a zero balance at the end of
fiscal 2009 and to increase the balance of its cash and liquid investments.
The Company expects to use its cash and liquid investments, including any borrowings under its credit facility and
commercial paper program, to invest in its core businesses, including new beverage and product innovations, as well
as other new business opportunities related to its core businesses. The Company may use its available cash resources
to make proportionate capital contributions to its equity method and cost method investees. Any decisions to
increase its ownership interest in its equity method investees or licensed operations will be driven by valuation and
fit with the Company’s ownership strategy and are likely to be infrequent.
Depending on market conditions and within the constraint of maintaining an appropriate capital structure,
Starbucks may repurchase shares of its common stock under its authorized share repurchase program. Starbucks

                                                                           34
did not repurchase any shares in fiscal 2009 under the Company’s share repurchase program; however, the
Company will continue to evaluate share repurchases and cash dividends in the future as a use for excess cash
generated by the business.

Other than normal operating expenses, cash requirements for fiscal 2010 are expected to consist primarily of capital
expenditures for remodeling and refurbishment of, and equipment upgrades for, existing Company-operated retail
stores; systems and technology investments in the stores and in the support infrastructure; and new Company-
operated retail stores. Total capital expenditures for fiscal 2010 are expected to range from $500 million to
$550 million.

Cash provided by operating activities was $1.4 billion for fiscal 2009 compared to $1.3 billion for fiscal 2008. Cash
used by investing activities for fiscal 2009 totaled $421.1 million compared to $1.1 billion in fiscal 2008. The
decrease was due to lower capital expenditures in fiscal 2009 compared to fiscal 2008 due to opening significantly
fewer new Company-operated stores.

Cash used by financing activities for the year ended September 27, 2009 totaled $642.2 million, with net
repayments of commercial paper and short-term borrowings under the credit facility totaling $713.1 million.
As of September 27, 2009, a total of $14.1 million in letters of credit were outstanding under the credit facility,
leaving $985.9 million of capacity available under the $1 billion combined commercial paper program and
revolving credit facility.

The following table summarizes the Company’s contractual obligations and borrowings as of September 27, 2009,
and the timing and effect that such commitments are expected to have on the Company’s liquidity and capital
requirements in future periods (in millions):
                                                                                           Payments Due by Period
                                                                                   Less than 1      1-3           3-5    More than
Contractual Obligations(1)                                             Total          Year          Years        Years    5 Years

Debt obligations(2) . . . . . . . . . . . . .    . . . . . . . . . . $ 825.4       $    34.7     $ 68.8       $ 68.8     $ 653.1
Operating lease obligations(3) . . . . .         . . . . . . . . . . 4,389.2           706.7      1,281.3      1,039.1    1,362.1
Purchase obligations(4) . . . . . . . . . .      ..........            308.3           264.1         34.2          9.5        0.5
Other obligations(5) . . . . . . . . . . . . .   ..........            109.7             3.3         22.8          6.8       76.8
Total . . . . . . . . . . . . . . . . . . . . . . . . . . . . . . . . . $5,632.6   $1,008.8      $1,407.1     $1,124.2   $2,092.5

(1)
      Income tax liabilities for uncertain tax positions were excluded as the Company is not able to make a reasonably
      reliable estimate of the amount and period of related future payments. As of September 27, 2009, the Company
      had $49.1 million of gross unrecognized tax benefits for uncertain tax positions.
(2)
      Debt amounts include principal maturities and expected interest payments on the long-term debt.
(3)
      Amounts include the direct lease obligations, excluding any taxes, insurance and other related expenses.
(4)
      Purchase obligations include agreements to purchase goods or services that are enforceable and legally binding
      on Starbucks and that specify all significant terms. Purchase obligations relate primarily to green coffee.
(5)
      Other obligations include other long-term liabilities primarily consisting of asset retirement obligations, capital
      lease obligations and hedging instruments.

Starbucks expects to fund these commitments primarily with operating cash flows generated in the normal course of
business, as well as ongoing borrowings under the combined commercial paper program and revolving credit
facility.

Off-Balance Sheet Arrangement

The Company’s off-balance sheet arrangements relate to certain guarantees and are detailed in Note 17 to the
consolidated financial statements in this 10-K.

                                                                       35
COMMODITY PRICES, AVAILABILITY AND GENERAL RISK CONDITIONS
Commodity price risk represents the Company’s primary market risk, generated by its purchases of green coffee and
dairy products, among other things. The Company purchases, roasts and sells high-quality whole bean arabica
coffee and related products and risk arises from the price volatility of green coffee. In addition to coffee, the
Company also purchases significant amounts of dairy products to support the needs of its Company-operated retail
stores. The price and availability of these commodities directly impacts the Company’s results of operations and can
be expected to impact its future results of operations. For additional details see Product Supply in Item 1, as well as
Risk Factors in Item 1A of this 10-K.

FINANCIAL RISK MANAGEMENT
Market risk is defined as the risk of losses due to changes in commodity prices, foreign currency exchange rates,
equity security prices, and interest rates. The Company manages its exposure to various market-based risks
according to an umbrella risk management policy. Under this policy, market-based risks are quantified and
evaluated for potential mitigation strategies, such as entering into hedging transactions. The umbrella risk
management policy governs the hedging instruments the business may use and limits the risk to net earnings.
The Company also monitors and limits the amount of associated counterparty credit risk. Additionally, this policy
restricts, among other things, the amount of market-based risk the Company will tolerate before implementing
approved hedging strategies and prohibits speculative trading activity. In general, hedging instruments do not have
maturities in excess of five years.
The sensitivity analyses disclosed below provide only a limited, point-in-time view of the market risk of the
financial instruments discussed. The actual impact of the respective underlying rates and price changes on the
financial instruments may differ significantly from those shown in the sensitivity analyses.

Commodity Price Risk
The Company purchases commodity inputs, including coffee, dairy products and diesel that are used in its
operations and are subject to price fluctuations that impact its financial results. In addition to fixed-price contracts
and price-to-be-fixed contracts for coffee purchases, the Company has entered into commodity hedges to manage
commodity price risk using financial derivative instruments. The Company performed a sensitivity analysis based
on a 10% change in the underlying commodity prices of its commodity hedges, as of the end of fiscal 2009, and
determined that such a change would not have a significant effect on the fair value of these instruments.

Foreign Currency Exchange Risk
The majority of the Company’s revenue, expense and capital purchasing activities are transacted in US dollars.
However, because a portion of the Company’s operations consists of activities outside of the US, the Company has
transactions in other currencies, primarily the Canadian dollar, British pound, euro, and Japanese yen. As a result,
Starbucks may engage in transactions involving various derivative instruments to hedge revenues, inventory
purchases, assets, and liabilities denominated in foreign currencies.
As of September 27, 2009, the Company had forward foreign exchange contracts that hedge portions of anticipated
international revenue streams and inventory purchases. In addition, Starbucks had forward foreign exchange
contracts that qualify as accounting hedges of its net investment in Starbucks Japan, as well as the Company’s net
investments in its Canada subsidiary, to minimize foreign currency exposure.
The Company also had forward foreign exchange contracts that are not designated as hedging instruments for
accounting purposes (free standing derivatives), but which largely offset the financial impact of translating certain
foreign currency denominated payables and receivables. Increases or decreases in the fair value of these hedges are
generally offset by corresponding decreases or increases in the US dollar value of the Company’s foreign currency
denominated payables and receivables (i.e. “hedged items”) that would occur within the hedging period.
The following table summarizes the potential impact to the Company’s future net earnings and other comprehensive
income (“OCI”) from changes in the fair value of these derivative financial instruments due in turn to a change in the

                                                          36
value of the US dollar as compared to the level of foreign exchange rates. The information provided below relates
only to the hedging instruments and does not represent the corresponding changes in the underlying hedged items
(in millions):

September 27, 2009
                                                             Increase/(Decrease) to Net Earnings       Increase/(Decrease) to OCI
                                                            10% Increase in      10% Decrease in   10% Increase in    10% Decrease in
                                                            Underlying Rate      Underlying Rate   Underlying Rate    Underlying Rate

Foreign currency hedges. . . . . . . . . . . . .                 $58                  (58)                13                 (13)

Equity Security Price Risk
The Company has minimal exposure to price fluctuations on equity mutual funds and equity exchange-traded funds
within its trading portfolio. The trading securities approximate a portion of the Company’s liability under the
MDCP. A corresponding liability is included in Accrued compensation and related costs on the consolidated
balance sheets. These investments are recorded at fair value with unrealized gains and losses recognized in Net
interest income and other in the consolidated statements of earnings. The offsetting changes in the MDCP liability
are recorded in General and administrative expenses. The Company performed a sensitivity analysis based on a 10%
change in the underlying equity prices of its investments as of the end of fiscal 2009, and determined that such a
change would not have a significant effect on the fair value of these instruments.

Interest Rate Risk
The Company utilizes short-term and long-term financing and may use interest rate hedges to manage the effect of
interest rate changes on its existing debt as well as the anticipated issuance of new debt. At the end of fiscal years
2009 and 2008, the Company did not have any interest rate hedge agreements outstanding.
The following table summarizes the impact of a change in interest rates on the fair value of the Company’s debt
(in millions):

September 27, 2009
                                                                                            Change in Fair Value
                                                                          100 Basis Point Increase in  100 Basis Point Decrease in
                                                            Fair Value         Underlying Rate               Underlying Rate

     Debt . . . . . . . . . . . . . . . . . . . . . . . .    $591.8                 (39.8)                        39.8

The Company’s available-for-sale securities comprise a diversified portfolio consisting mainly of fixed income
instruments. The primary objectives of these investments are to preserve capital and liquidity. As of September 27,
2009, the Company’s long-term available-for-sale securities included ARS. Please see Note 3 for further infor-
mation. Available-for-sale securities are recorded on the consolidated balance sheets at fair value with unrealized
gains and losses reported as a component of Accumulated other comprehensive income. The Company does not
hedge the interest rate exposure on its available-for-sale securities. The Company performed a sensitivity analysis
based on a 100 basis point change in the underlying interest rate of its available-for-sale securities as of the end of
fiscal 2009, and determined that such a change would not have a significant effect on the fair value of these
instruments.

APPLICATION OF CRITICAL ACCOUNTING POLICIES
Critical accounting policies are those that management believes are both most important to the portrayal of the
Company’s financial condition and results, and require management’s most difficult, subjective or complex
judgments, often as a result of the need to make estimates about the effect of matters that are inherently uncertain.
Judgments and uncertainties affecting the application of those policies may result in materially different amounts
being reported under different conditions or using different assumptions.

                                                                         37
Starbucks considers its policies on asset impairment, stock-based compensation, operating leases, self insurance
reserves and income taxes to be the most critical in understanding the judgments that are involved in preparing its
consolidated financial statements.

Asset Impairment
When facts and circumstances indicate that the carrying values of long-lived assets may be impaired, an evaluation
of recoverability is performed by comparing the carrying values of the assets to projected future cash flows, in
addition to other quantitative and qualitative analyses. For goodwill and other indefinite-lived intangible assets,
impairment tests are performed annually and more frequently if facts and circumstances indicate carrying values
exceed estimated fair values and if indefinite useful lives are no longer appropriate for the Company’s trademarks.
Upon determination that the carrying values of such assets are in excess of their estimated fair values, the Company
recognizes an impairment loss as a charge against current operations. Judgments made by the Company related to
the expected useful lives of long-lived assets and the ability of the Company to realize undiscounted cash flows in
excess of the carrying amounts of such assets are affected by factors such as the ongoing maintenance and
improvements of the assets, changes in economic conditions and changes in operating performance. As the
Company assesses the ongoing expected cash flows and carrying amounts of its long-lived assets, these factors
could cause the Company to realize material impairment charges.

Stock-based Compensation
Starbucks accounts for stock-based compensation in accordance with fair value recognition provisions, under which
the Company uses the Black-Scholes-Merton option pricing model which requires the input of subjective
assumptions. These assumptions include estimating the length of time employees will retain their stock options
before exercising them (“expected term”), the estimated volatility of the Company’s common stock price over the
expected term and the number of options that will ultimately not complete their vesting requirements. Changes in
the subjective assumptions could materially affect the estimate of fair value of stock-based compensation; however
based on an analysis using changes in certain assumptions that could be reasonably possible in the near term,
management believes the effect on the expense recognized for fiscal 2009 would not have been material.

Operating Leases
Starbucks leases retail stores, roasting and distribution facilities and office space under operating leases. The
Company provides for an estimate of asset retirement obligation (“ARO”) expense at the lease inception date for
operating leases with requirements to remove leasehold improvements at the end of the lease term. Estimating
AROs involves subjective assumptions regarding both the amount and timing of actual future retirement costs.
Future actual costs could differ significantly from amounts initially estimated. In addition, the large number of
operating leases and the significant number of international markets in which the Company has operating leases
adds administrative complexity to the calculation of ARO expense, as well as to the other technical accounting
requirements of operating leases such as contingent rent. Estimating the cost of certain lease exit costs involves
subjective assumptions, including the time it would take to sublease the leased location and the related potential
sublease income. The estimated accruals for these costs could be significantly affected if future experience differs
from that used in the initial estimate.

Self Insurance Reserves
The Company uses a combination of insurance and self-insurance mechanisms, including a wholly owned captive
insurance entity and participation in a reinsurance pool, to provide for the potential liabilities for certain risks,
including workers’ compensation, healthcare benefits, general liability, property insurance, and director and
officers’ liability insurance. Liabilities associated with the risks that are retained by the Company are not discounted
and are estimated, in part, by considering historical claims experience, demographic factors, severity factors and
other actuarial assumptions. The estimated accruals for these liabilities could be significantly affected if future
occurrences and claims differ from these assumptions and historical trends.

                                                          38
Income Taxes
Starbucks recognizes deferred tax assets and liabilities based on the differences between the financial statement
carrying amounts and the tax basis of assets and liabilities and accrues for uncertain tax positions. Deferred tax
assets and liabilities are measured using current enacted tax rates in effect for the years in which those temporary
differences are expected to reverse. Judgment is required in determining the provision for income taxes and related
accruals, deferred tax assets and liabilities. These include establishing a valuation allowance related to the ability to
realize certain deferred tax assets. Accounting for uncertain tax positions requires significant judgments, including
estimating the amount, timing and likelihood of ultimate settlement. Although the Company believes that its
estimates are reasonable, actual results could differ from these estimates.

RECENT ACCOUNTING PRONOUNCEMENTS
See Note 1 to the consolidated financial statements in this 10-K.

Item 7A. Quantitative and Qualitative Disclosures About Market Risk
The information required by this item is incorporated by reference to the section entitled “Management’s
Discussion and Analysis of Financial Condition and Results of Operations — Commodity Prices, Availability
and General Risk Conditions” and “Management’s Discussion and Analysis of Financial Condition and Results of
Operations — Financial Risk Management” in Item 7 of this Report.


                                                           39
Item 8.      Financial Statements and Supplementary Data


                                                     STARBUCKS CORPORATION
                                       CONSOLIDATED STATEMENTS OF EARNINGS
                                           (In Millions, except earnings per share)

                                                                                                           Sep 27,        Sep 28,     Sep 30,
Fiscal Year Ended                                                                                           2009           2008        2007

Net revenues:
  Company-operated retail . . . . . . . . . . . . . . . . . . . . . . . . . . . . . . . . . . . $8,180.1              $ 8,771.9      $7,998.3
  Specialty:
     Licensing . . . . . . . . . . . . . . . . . . . . . . . . . . . . . . . . . . . . . . . . . . . . . 1,222.3           1,171.6    1,026.3
     Foodservice and other. . . . . . . . . . . . . . . . . . . . . . . . . . . . . . . . . . . .          372.2             439.5      386.9
   Total specialty . . . . . . . . . . . . . . . . . . . . . . . . . . . . . . . . . . . . . . . . . . .   1,594.5         1,611.1    1,413.2
Total net revenues . . . . . . . . . . . . . . . . . . . . .       .....................                   9,774.6        10,383.0    9,411.5
Cost of sales including occupancy costs . . . . .                  .....................                   4,324.9         4,645.3    3,999.1
Store operating expenses . . . . . . . . . . . . . . . .           .....................                   3,425.1         3,745.1    3,215.9
Other operating expenses . . . . . . . . . . . . . . . .           .....................                     264.4           330.1      294.2
Depreciation and amortization expenses . . . . .                   .....................                     534.7           549.3      467.2
General and administrative expenses . . . . . . .                  .....................                     453.0           456.0      489.2
Restructuring charges. . . . . . . . . . . . . . . . . . .         .....................                     332.4           266.9         —
    Total operating expenses . . . . . . . . . . . . . . . . . . . . . . . . . . . . . . . . . .           9,334.5         9,992.7    8,465.6
Income from equity investees . . . . . . . . . . . . . . . . . . . . . . . . . . . . . . . . . .             121.9           113.6      108.0
Operating income . . . . . . . . . . . . . . . . . . . . . . . . . . . . . . . . . . . . . . . . . .         562.0          503.9     1,053.9
Interest income and other, net . . . . . . . . . . . . . . . . . . . . . . . . . . . . . . . . .              36.3            9.0        40.4
Interest expense . . . . . . . . . . . . . . . . . . . . . . . . . . . . . . . . . . . . . . . . . . . .     (39.1)         (53.4)      (38.0)
      Earnings before income taxes . . . . . . . . . . . . . . . . . . . . . . . . . . . . . .               559.2          459.5     1,056.3
      Income taxes . . . . . . . . . . . . . . . . . . . . . . . . . . . . . . . . . . . . . . . . . .       168.4          144.0       383.7
      Net earnings. . . . . . . . . . . . . . . . . . . . . . . . . . . . . . . . . . . . . . . . . . . $ 390.8       $     315.5    $ 672.6
Per common share:
     Net earnings — basic . . . . . . . . . . . . . . .            ..................... $                    0.53    $       0.43   $    0.90
     Net earnings — diluted . . . . . . . . . . . . . .            ..................... $                    0.52    $       0.43   $    0.87
Weighted average shares outstanding:
     Basic . . . . . . . . . . . . . . . . . . . . . . . . . . .   .....................                     738.7          731.5        749.8
     Diluted . . . . . . . . . . . . . . . . . . . . . . . . .     .....................                     745.9          741.7        770.1


                                           See Notes to Consolidated Financial Statements.

                                                                           40
STARBUCKS CORPORATION
                                               CONSOLIDATED BALANCE SHEETS
                                                (In millions, except per share data)
                                                                                                                            Sep 27,     Sep 28,
                                                                                                                             2009        2008

                                                                       ASSETS
Current assets:
  Cash and cash equivalents . . . . . . . . . . . . . . . . . . . . . . . . . . . . . . . . . . . . . . . . . . . $ 599.8              $ 269.8
  Short-term investments — available-for-sale securities . . . . . . . . . . . . . . . . . . . . . . .                          21.5        3.0
  Short-term investments — trading securities . . . . . . . . . . . . . . . . . . . . . . . . . . . . . .                       44.8       49.5
  Accounts receivable, net . . . . . . . . . . . . . . . . . . . . . . . . . . . . . . . . . . . . . . . . . . . . .           271.0      329.5
  Inventories . . . . . . . . . . . . . . . . . . . . . . . . . . . . . . . . . . . . . . . . . . . . . . . . . . . . . . .    664.9      692.8
  Prepaid expenses and other current assets . . . . . . . . . . . . . . . . . . . . . . . . . . . . . . . .                    147.2      169.2
  Deferred income taxes, net . . . . . . . . . . . . . . . . . . . . . . . . . . . . . . . . . . . . . . . . . . .             286.6      234.2
    Total current assets . . . . . . . . . . . . . . . . . . . . . . . . . . . . . . . . . . . . . . . . . . . . . . .       2,035.8    1,748.0
Long-term investments — available-for-sale securities . . . . . . . . . . . . . . . . . . . . . . . . .                         71.2       71.4
Equity and cost investments . . . . . . . . . . . . . . . . . . . . . . . . . . . . . . . . . . . . . . . . . . . .            352.3      302.6
Property, plant and equipment, net . . . . . . . . . . . . . . . . . . . . . . . . . . . . . . . . . . . . . . .             2,536.4    2,956.4
Other assets . . . . . . . . . . . . . . . . . . . . . . . . . . . . . . . . . . . . . . . . . . . . . . . . . . . . . . . .   253.8      261.1
Other intangible assets . . . . . . . . . . . . . . . . . . . . . . . . . . . . . . . . . . . . . . . . . . . . . . . .         68.2       66.6
Goodwill . . . . . . . . . . . . . . . . . . . . . . . . . . . . . . . . . . . . . . . . . . . . . . . . . . . . . . . . . .   259.1      266.5
  TOTAL ASSETS . . . . . . . . . . . . . . . . . . . . . . . . . . . . . . . . . . . . . . . . . . . . . . . . . . $5,576.8            $5,672.6

                                 LIABILITIES AND SHAREHOLDERS’ EQUITY
Current liabilities:
  Commercial paper and short-term borrowings . . . . . . . . . . . . . . . . . . . . . . . . . . . . . $                  —            $ 713.0
  Accounts payable . . . . . . . . . . . . . . . . . . . . . . . . . . . . . . . . . . . . . . . . . . . . . . . . . .  267.1            324.9
  Accrued compensation and related costs . . . . . . . . . . . . . . . . . . . . . . . . . . . . . . . . .              307.5            253.6
  Accrued occupancy costs . . . . . . . . . . . . . . . . . . . . . . . . . . . . . . . . . . . . . . . . . . . .       188.1            136.1
  Accrued taxes . . . . . . . . . . . . . . . . . . . . . . . . . . . . . . . . . . . . . . . . . . . . . . . . . . . . 127.8             76.1
  Insurance reserves . . . . . . . . . . . . . . . . . . . . . . . . . . . . . . . . . . . . . . . . . . . . . . . . .  154.3            152.5
  Other accrued expenses . . . . . . . . . . . . . . . . . . . . . . . . . . . . . . . . . . . . . . . . . . . . .      147.3            164.4
  Deferred revenue . . . . . . . . . . . . . . . . . . . . . . . . . . . . . . . . . . . . . . . . . . . . . . . . . .  388.7            368.4
  Current portion of long-term debt . . . . . . . . . . . . . . . . . . . . . . . . . . . . . . . . . . . . . .           0.2              0.7
    Total current liabilities . . . . . . . . . . . . . . . . . . . . . . . . . . . . . . . . . . . . . . . . . . . .       1,581.0     2,189.7
Long-term debt . . . . . . . . . . . . . . . . . . . . . . . . . . . . . . . . . . . . . . . . . . . . . . . . . . . . .      549.3       549.6
Other long-term liabilities . . . . . . . . . . . . . . . . . . . . . . . . . . . . . . . . . . . . . . . . . . . . .         400.8       442.4
    Total liabilities . . . . . . . . . . . . . . . . . . . . . . . . . . . . . . . . . . . . . . . . . . . . . . . . . .   2,531.1     3,181.7
Shareholders’ equity:
  Common stock ($0.001 par value) — authorized, 1,200.0 shares; issued and
    outstanding, 742.9 and 735.5 shares, respectively (includes 3.4 common stock
    units in both periods) . . . . . . . . . . . . . . . . . . . . . . . . . . . . . . . . . . . . . . . . . . . . .            0.7         0.7
  Additional paid-in capital . . . . . . . . . . . . . . . . . . . . . . . . . . . . . . . . . . . . . . . . . . . .          147.0          —
  Other additional paid-in-capital . . . . . . . . . . . . . . . . . . . . . . . . . . . . . . . . . . . . . . . .             39.4        39.4
  Retained earnings . . . . . . . . . . . . . . . . . . . . . . . . . . . . . . . . . . . . . . . . . . . . . . . . . .     2,793.2     2,402.4
  Accumulated other comprehensive income . . . . . . . . . . . . . . . . . . . . . . . . . . . . . . .                         65.4        48.4
    Total shareholders’ equity . . . . . . . . . . . . . . . . . . . . . . . . . . . . . . . . . . . . . . . . . .          3,045.7     2,490.9
   TOTAL LIABILITIES AND SHAREHOLDERS’ EQUITY . . . . . . . . . . . . . . . . . . . $5,576.8                                           $5,672.6

                                           See Notes to Consolidated Financial Statements.

                                                                           41
STARBUCKS CORPORATION
                                        CONSOLIDATED STATEMENTS OF CASH FLOWS
                                                       (In millions)
                                                                                                                              Sep 27,       Sep 28,      Sep 30,
Fiscal Year Ended                                                                                                              2009          2008         2007
OPERATING ACTIVITIES:
Net earnings . . . . . . . . . . . . . . . . . . . . . . . . . . . . . . . . . . . . . . . . . . . . . . . . .    ... $          390.8 $       315.5 $      672.6
Adjustments to reconcile net earnings to net cash provided by operating activities:
  Depreciation and amortization . . . . . . . . . . . . . . . . . . . . . . . . . . . . . . . . . . .             .   .   .      563.3         604.5        491.2
  Provision for impairments and asset disposals . . . . . . . . . . . . . . . . . . . . . . . .                   .   .   .      224.4         325.0         26.0
  Deferred income taxes . . . . . . . . . . . . . . . . . . . . . . . . . . . . . . . . . . . . . . . .           .   .   .      (69.6)       (117.1)       (37.3)
  Equity in income of investees . . . . . . . . . . . . . . . . . . . . . . . . . . . . . . . . . . .             .   .   .      (78.4)        (61.3)       (65.7)
  Distributions of income from equity investees . . . . . . . . . . . . . . . . . . . . . . . .                   .   .   .       53.0          52.6         65.9
  Stock-based compensation . . . . . . . . . . . . . . . . . . . . . . . . . . . . . . . . . . . . .              .   .   .       83.2          75.0        103.9
  Tax benefit from exercise of stock options . . . . . . . . . . . . . . . . . . . . . . . . . .                  .   .   .        2.0           3.8          7.7
  Excess tax benefit from exercise of stock options . . . . . . . . . . . . . . . . . . . . .                     .   .   .      (15.9)        (14.7)       (93.1)
  Other . . . . . . . . . . . . . . . . . . . . . . . . . . . . . . . . . . . . . . . . . . . . . . . . . . . .   .   .   .        5.4          (0.1)         0.7
  Cash provided/(used) by changes in operating assets and liabilities:
     Inventories . . . . . . . . . . . . . . . . . . . . . . . . . . . . . . . . . . . . . . . . . . . . . . .    .   .   .       28.5          (0.6)       (48.6)
     Accounts payable . . . . . . . . . . . . . . . . . . . . . . . . . . . . . . . . . . . . . . . . . .         .   .   .      (53.0)        (63.9)        36.1
     Accrued taxes . . . . . . . . . . . . . . . . . . . . . . . . . . . . . . . . . . . . . . . . . . . .        .   .   .       57.2           7.3         86.4
     Deferred revenue . . . . . . . . . . . . . . . . . . . . . . . . . . . . . . . . . . . . . . . . . .         .   .   .       16.3          72.4         63.2
     Other operating assets . . . . . . . . . . . . . . . . . . . . . . . . . . . . . . . . . . . . . . .         .   .   .      120.5         (11.2)       (92.7)
     Other operating liabilities . . . . . . . . . . . . . . . . . . . . . . . . . . . . . . . . . . . .          .   .   .       61.3          71.5        114.9
Net cash provided by operating activities . . . . . . . . . . . . . . . . . . . . . . . . . . . . .               .   .   .    1,389.0       1,258.7      1,331.2
INVESTING ACTIVITIES:
  Purchase of available-for-sale securities . . . . . . . . . . . . . . . . . . . . . . . . . . . .               .   .   .     (129.2)        (71.8)      (237.4)
  Maturities and calls of available-for-sale securities . . . . . . . . . . . . . . . . . . . . .                 .   .   .      111.0          20.0        178.2
  Sales of available-for-sale securities . . . . . . . . . . . . . . . . . . . . . . . . . . . . . . .            .   .   .        5.0          75.9         47.5
  Acquisitions, net of cash acquired . . . . . . . . . . . . . . . . . . . . . . . . . . . . . . . .              .   .   .        —           (74.2)       (53.3)
  Net purchases of equity, other investments and other assets . . . . . . . . . . . . . . .                       .   .   .       (4.8)        (52.0)       (56.6)
  Additions to property, plant and equipment . . . . . . . . . . . . . . . . . . . . . . . . . .                  .   .   .     (445.6)       (984.5)    (1,080.3)
  Proceeds from sale of property, plant and equipment . . . . . . . . . . . . . . . . . . .                       .   .   .       42.5            —            —
Net cash used by investing activities . . . . . . . . . . . . . . . . . . . . . . . . . . . . . . . .             .   .   .     (421.1)     (1,086.6)    (1,201.9)
FINANCING ACTIVITIES:
  Proceeds from issuance of commercial paper . . . . . . . . . . . . . . . . . . . . . . . .                      .   .   .    20,965.4   65,770.8   17,311.1
  Repayments of commercial paper . . . . . . . . . . . . . . . . . . . . . . . . . . . . . . . .                  .   .   .   (21,378.5) (66,068.0) (16,600.9)
  Proceeds from short-term borrowings . . . . . . . . . . . . . . . . . . . . . . . . . . . . . .                 .   .   .     1,338.0      528.2      770.0
  Repayments of short-term borrowings . . . . . . . . . . . . . . . . . . . . . . . . . . . . .                   .   .   .    (1,638.0)    (228.8) (1,470.0)
  Proceeds from issuance of common stock . . . . . . . . . . . . . . . . . . . . . . . . . . .                    .   .   .        57.3      112.3      176.9
  Excess tax benefit from exercise of stock options . . . . . . . . . . . . . . . . . . . . .                     .   .   .        15.9       14.7       93.1
  Proceeds from issuance of long-term debt . . . . . . . . . . . . . . . . . . . . . . . . . . .                  .   .   .          —          —       549.0
  Principal payments on long-term debt. . . . . . . . . . . . . . . . . . . . . . . . . . . . . .                 .   .   .        (0.7)      (0.6)      (0.8)
  Repurchase of common stock . . . . . . . . . . . . . . . . . . . . . . . . . . . . . . . . . . .                .   .   .          —      (311.4)    (996.8)
  Other . . . . . . . . . . . . . . . . . . . . . . . . . . . . . . . . . . . . . . . . . . . . . . . . . . . .   .   .   .        (1.6)      (1.7)      (3.5)
Net cash used by financing activities . . . . . . . . . . . . . . . . . . . . . . . . . . . . . . . .             .   .   .      (642.2)    (184.5)    (171.9)
Effect of exchange rate changes on cash and cash equivalents . . . . . . . . . . . . . .                          .   .   .         4.3        0.9       11.3
Net increase/(decrease) in cash and cash equivalents . . . . . . . . . . . . . . . . . . . . .                    .   .   .       330.0      (11.5)     (31.3)
CASH AND CASH EQUIVALENTS:
Beginning of period . . . . . . . . . . . . . . . . . . . . . . . . . . . . . . . . . . . . . . . . . . . . . . .                269.8         281.3        312.6
End of period . . . . . . . . . . . . . . . . . . . . . . . . . . . . . . . . . . . . . . . . . . . . . . . . . . . $            599.8 $       269.8 $      281.3

SUPPLEMENTAL DISCLOSURE OF CASH FLOW INFORMATION:
Net change in short-term borrowings and commercial paper for the period . . . . . . . . . $                                     (713.1) $        2.2 $       10.2
Cash paid during the period for:
  Interest, net of capitalized interest . . . . . . . . . . . . . . . . . . . . . . . . . . . . . . . . . . . $                   39.8 $        52.7 $       35.3
  Income taxes . . . . . . . . . . . . . . . . . . . . . . . . . . . . . . . . . . . . . . . . . . . . . . . . . . $             162.0 $       259.5 $      342.2

                                               See Notes to Consolidated Financial Statements.

                                                                                 42
STARBUCKS CORPORATION
                           CONSOLIDATED STATEMENTS OF SHAREHOLDERS’ EQUITY
                                              (In millions)
                                                                                                             Other               Accumulated
                                                                                                 Additional Additional              Other
                                                                                  Common Stock    Paid-in    Paid-in   Retained Comprehensive
                                                                                 Shares Amount    Capital    Capital   Earnings Income/(Loss)     Total

Balance, October 1, 2006 . . . . . . . .         .   .   .   .   .   .   .   . 756.6     $0.7    $     —      $39.4   $2,151.1     $ 37.3       $ 2,228.5
  Net earnings. . . . . . . . . . . . . . . .    .   .   .   .   .   .   .   .   —        —            —        —        672.6         —            672.6
  Unrealized holding loss, net . . . . .         .   .   .   .   .   .   .   .   —        —            —        —          —        (20.4)          (20.4)
  Translation adjustment, net of tax .           .   .   .   .   .   .   .   .   —        —            —        —          —         37.7            37.7
  Comprehensive income . . . . . . . . . . . . . . . .                                                                                             689.9
  Stock-based compensation expense . . . .                       ....              —      —          106.4      —          —           —           106.4
  Exercise of stock options, including tax
    benefit of $95.3. . . . . . . . . . . . . . . .              ....             12.8    —          225.2      —          —           —           225.2
  Sale of common stock, including tax
    provision of $0.1 . . . . . . . . . . . . . . .              ....      1.9            —          46.8       —          —           —             46.8
  Repurchase of common stock . . . . . . . .                     . . . . (33.0)           —        (378.4)      —       (634.3)        —         (1,012.7)
Balance, September 30, 2007 . . . . . . . . . . . . . . 738.3                            $0.7    $     —      $39.4   $2,189.4     $ 54.6       $ 2,284.1
  Cumulative impact of adoption of accounting
    requirements for uncertain tax positions . . .            —                           —           (1.6)     —         (1.7)        —            (3.3)
  Net earnings. . . . . . . . . . . . . . . . . . . . . . . . —                           —             —       —        315.5         —           315.5
  Unrealized holding gain, net. . . . . . . . . . . . .       —                           —             —       —          —          0.8            0.8
  Translation adjustment, net of tax . . . . . . . . .        —                           —             —       —          —         (7.0)          (7.0)
  Comprehensive income . . . . . . . . . . . . . . . .                                                                                             309.3
  Stock-based compensation expense . . . . . . .                             .     —      —           76.8      —          —           —            76.8
  Exercise of stock options, including tax
    benefit of $8.4 . . . . . . . . . . . . . . . . . . .                    .     6.6    —           77.4      —          —           —            77.4
  Sale of common stock, including tax benefit
    of $0.1 . . . . . . . . . . . . . . . . . . . . . . . . .                .   2.8      —          41.9       —          —           —            41.9
  Repurchase of common stock . . . . . . . . . . .                           . (12.2)     —        (194.5)      —       (100.8)        —          (295.3)
Balance, September 28, 2008 . . . . . .          .   .   .   .   .   .   .   . 735.5     $0.7    $     —      $39.4   $2,402.4     $ 48.4       $ 2,490.9
  Net earnings. . . . . . . . . . . . . . . .    .   .   .   .   .   .   .   .   —        —            —        —        390.8         —            390.8
  Unrealized holding gains, net . . . .          .   .   .   .   .   .   .   .   —        —            —        —          —          1.8             1.8
  Translation adjustment, net of tax .           .   .   .   .   .   .   .   .   —        —            —        —          —         15.2            15.2
  Comprehensive income . . . . . . . . . . . . . . . .                                                                                             407.8
  Stock-based compensation expense . . . . . . . .                                 —      —           84.3      —          —           —            84.3
  Exercise of stock options, including tax
    benefit of $5.3 . . . . . . . . . . . . . . . . . . . .                        4.9    —           35.9      —          —           —            35.9
  Sale of common stock, including tax benefit
    of $0.1 . . . . . . . . . . . . . . . . . . . . . . . . . .                    2.5    —           26.8      —          —           —            26.8
Balance, September 27, 2009 . . . . . . . . . . . . . . 742.9                            $0.7    $ 147.0      $39.4   $2,793.2     $ 65.4       $ 3,045.7


                                             See Notes to Consolidated Financial Statements.

                                                                                          43
STARBUCKS CORPORATION
                       NOTES TO CONSOLIDATED FINANCIAL STATEMENTS
           Fiscal Years ended September 27, 2009, September 28, 2008 and September 30, 2007

Note 1: Summary of Significant Accounting Policies
Description of Business
Starbucks Corporation (together with its subsidiaries, “Starbucks” or the “Company”) purchases and roasts high-
quality whole bean coffees and sells them, along with fresh, rich-brewed coffees, Italian-style espresso beverages,
cold blended beverages, a variety of complementary food items, a selection of premium teas, and beverage-related
accessories and equipment, primarily through its Company-operated retail stores. Starbucks also sells coffee and tea
products and licenses its trademark through other channels such as licensed stores, and through certain of its
licensees and equity investees, Starbucks produces and sells a variety of ready-to-drink beverages. All channels
outside the Company-operated retail stores are collectively known as specialty operations. Additional details on the
nature of the Company’s business are in Item 1 of this 10-K.
Starbucks has three reportable operating segments: United States (“US”), International and Global Consumer
Products Group (“CPG”). See Note 18 for additional details.

Principles of Consolidation
The consolidated financial statements reflect the financial position and operating results of Starbucks, including
wholly owned subsidiaries and investees controlled by the Company. Investments in entities that the Company does
not control, but has the ability to exercise significant influence over operating and financial policies, are accounted
for under the equity method. Investments in entities in which Starbucks does not have the ability to exercise
significant influence are accounted for under the cost method. Intercompany transactions and balances have been
eliminated.

Fiscal Year End
Starbucks fiscal year ends on the Sunday closest to September 30. The fiscal years ended on September 27, 2009,
September 28, 2008 and September 30, 2007 all included 52 weeks. Starbucks 2010 fiscal year will include
53 weeks, with the 53rd week falling in its fourth fiscal quarter.

Subsequent Events
The Company evaluated subsequent events and transactions for potential recognition or disclosure in the financial
statements through November 20, 2009, the day the financial statements were issued.

Estimates and Assumptions
Preparing financial statements in conformity with accounting principles generally accepted in the United States of
America (“GAAP”) requires management to make estimates and assumptions that affect the reported amounts of
assets, liabilities, revenues and expenses. Examples include, but are not limited to, estimates for asset and goodwill
impairments, stock-based compensation forfeiture rates, and future asset retirement obligations; assumptions
underlying self-insurance reserves; and the potential outcome of future tax consequences of events that have been
recognized in the financial statements. Actual results and outcomes may differ from these estimates and
assumptions.

Cash and Cash Equivalents
The Company considers all highly liquid instruments with a maturity of three months or less at the time of purchase
to be cash equivalents. The Company maintains cash and cash equivalent balances with financial institutions that

                                                          44
exceed federally insured limits. The Company has not experienced any losses related to these balances, and
management believes its credit risk to be minimal.

Cash Management
The Company’s cash management system provides for the funding of all major bank disbursement accounts on a
daily basis as checks are presented for payment. Under this system, outstanding checks are in excess of the cash
balances at certain banks, which creates book overdrafts. Book overdrafts are presented as a current liability in
Accounts payable on the consolidated balance sheets.

Short-term and Long-term Investments
The Company’s short-term and long-term investments consist primarily of investment grade debt securities, equity
mutual funds, and equity exchange-traded funds, all of which are classified as available-for-sale or trading. As of
September 27, 2009, a substantial portion of the Company’s available-for-sale investments consisted of auction rate
securities, as described in more detail in Note 3. Trading securities are recorded at fair value with unrealized holding
gains and losses included in net earnings. Available-for-sale securities are recorded at fair value, and unrealized
holding gains and losses are recorded, net of tax, as a component of accumulated other comprehensive income.
Available-for-sale securities with remaining maturities of less than one year and those identified by management at
time of purchase for funding operations in less than one year are classified as short term, and all other
available-for-sale securities are classified as long term. Unrealized losses are charged against net earnings when
a decline in fair value is determined to be other than temporary. Management reviews several factors to determine
whether a loss is other than temporary, such as the length and extent of the fair value decline, the financial condition
and near term prospects of the issuer, and for equity investments, the Company’s intent and ability to hold the
security for a period of time sufficient to allow for any anticipated recovery in fair value. For debt securities,
management also evaluates whether the Company has the intent to sell or will likely be required to sell before its
anticipated recovery. Realized gains and losses are accounted for on the specific identification method. Purchases
and sales are recorded on a trade date basis.

Fair Value of Financial Instruments
The carrying value of cash and cash equivalents approximates fair value because of the short-term maturity of those
instruments. The fair value of the Company’s investments in marketable debt and equity securities, equity mutual
funds and equity exchange-traded funds, is based upon the quoted market price on the last business day of the fiscal
year. Where an observable quoted market price for a security does not exist, the Company estimates fair value using
a variety of valuation methodologies. Such methodologies include comparing the security with securities of
publicly traded companies in similar lines of business, applying revenue multiples to estimated future operating
results and estimating discounted cash flows. See Note 3 and 7 for additional information and Note 5 for the
methods used to measure fair value. The fair value of the Company’s debt is estimated based on the quoted market
prices for the same or similar issues or on the current rates offered to the Company for debt of the same remaining
maturities. The carrying value of short-term debt approximates fair value. The estimated fair value of Starbucks
$550 million of 6.25% Senior Notes was approximately $591 million and $536 million as of September 27, 2009
and September 28, 2008, respectively.

Derivative Instruments
The Company manages its exposure to various risks within the consolidated financial statements according to an
umbrella risk management policy. Under this policy, Starbucks may engage in transactions involving various
derivative instruments, with maturities generally not longer than five years, to hedge interest rates, commodity
prices, and foreign currency denominated revenues, purchases, assets and liabilities.
The Company records all derivatives on the balance sheets at fair value. For a cash flow hedge, the effective portion
of the derivative’s gain or loss is initially reported as a component of other comprehensive income (“OCI”) and

                                                          45
subsequently reclassified into net earnings when the hedged exposure affects net earnings. For a net investment
hedge, the effective portion of the derivative’s gain or loss is reported as a component of OCI.
Cash flow hedges related to anticipated transactions are designated and documented at the inception of each hedge
by matching the terms of the contract to the underlying transaction. The Company classifies the cash flows from
hedging transactions in the same categories as the cash flows from the respective hedged items. Once established,
cash flow hedges are generally not removed until maturity unless an anticipated transaction is no longer likely to
occur. For discontinued or dedesignated cash flow hedges, the related accumulated derivative gains or losses are
recognized in Net interest income and other on the consolidated statements of earnings.
Forward contract effectiveness for cash flow hedges is calculated by comparing the fair value of the contract to the
change in value of the anticipated transaction using forward rates on a monthly basis. For net investment hedges, the
spot-to-spot method is used to calculate effectiveness. Under this method, the change in fair value of the forward
contract attributable to the changes in spot exchange rates (the effective portion) is reported as a component of OCI.
The remaining change in fair value of the forward contract (the ineffective portion) is reclassified into net earnings.
Any ineffectiveness is recognized immediately in Net interest income and other on the consolidated statements of
earnings.
The Company also enters into certain foreign currency forward contracts and commodity swap and futures contracts
that are not designated as hedging instruments for accounting purposes. These contracts are recorded at fair value,
with the changes in fair value recognized in Net interest income and other on the consolidated statements of
earnings.
See Note 5 for additional information on the Company’s fair value measurements related to derivative instruments.

Allowance for Doubtful Accounts
Allowance for doubtful accounts is calculated based on historical experience, customer credit risk and application
of the specific identification method. As of September 27, 2009 and September 28, 2008, the allowance for doubtful
accounts was $5.0 million and $4.5 million, respectively.

Inventories
Inventories are stated at the lower of cost (primarily moving average cost) or market. The Company records
inventory reserves for obsolete and slow-moving items and for estimated shrinkage between physical inventory
counts. Inventory reserves are based on inventory turnover trends, historical experience and application of the
specific identification method. As of September 27, 2009 and September 28, 2008, inventory reserves were
$21.1 million and $25.5 million, respectively.

Property, Plant and Equipment
Property, plant and equipment are carried at cost less accumulated depreciation. Depreciation of property, plant and
equipment, which includes assets under capital leases, is provided on the straight-line method over estimated useful
lives, generally ranging from two to seven years for equipment and 30 to 40 years for buildings. Leasehold
improvements are amortized over the shorter of their estimated useful lives or the related lease life, generally
10 years. For leases with renewal periods at the Company’s option, Starbucks generally uses the original lease term,
excluding renewal option periods, to determine estimated useful lives. If failure to exercise a renewal option
imposes an economic penalty to Starbucks, management may determine at the inception of the lease that renewal is
reasonably assured and include the renewal option period in the determination of appropriate estimated useful lives.
The portion of depreciation expense related to production and distribution facilities is included in Cost of sales
including occupancy costs on the consolidated statements of earnings. The costs of repairs and maintenance are
expensed when incurred, while expenditures for refurbishments and improvements that significantly add to the
productive capacity or extend the useful life of an asset are capitalized. When assets are retired or sold, the asset cost
and related accumulated depreciation are eliminated with any remaining gain or loss reflected in net earnings.

                                                           46
Goodwill
The Company tests its goodwill for impairment on an annual basis, or more frequently if circumstances indicate
reporting unit carrying values exceed their fair values. Fair value is estimated by projecting discounted cash flows
from the reporting unit in addition to other quantitative and qualitative analyses. If the carrying amount of goodwill
exceeds the implied estimated fair value, an impairment charge to current operations is recorded to reduce the
carrying value to the implied estimated fair value.
Starbucks conducted its annual test for its consolidated entities in the third fiscal quarter, resulting in $7 million of
goodwill impairment in fiscal 2009 related to the US operating segment’s Hawaii reporting unit, which is comprised
of retail store operations. The current and future projected operating results for the Hawaii operations, which were
acquired in fiscal 2006, were lower than originally anticipated due to the overall economic slowdown and its impact
on the travel industry in particular, resulting in a partial impairment of the related goodwill. There was no
impairment of goodwill in fiscal 2008 and 2007.

Other Intangible Assets
Other intangible assets consist primarily of trademarks with indefinite lives which are tested for impairment
annually or more frequently if indefinite useful lives are no longer appropriate. Definite-lived intangible assets,
which mainly consist of contract-based patents and copyrights, are amortized over their estimated useful lives, and
are tested for impairment when facts and circumstances indicate that the carrying values may not be recoverable.
For further information on other intangible assets, see Note 9. Based on the impairment tests performed there was no
impairment of other intangible assets in fiscal 2009, 2008 and 2007.

Long-lived Assets
When facts and circumstances indicate that the carrying values of long-lived assets may be impaired, an evaluation
of recoverability is performed by comparing the carrying values of the assets to projected undiscounted future cash
flows in addition to other quantitative and qualitative analyses. Upon indication that the carrying values of such
assets may not be recoverable, the Company compares the fair value of long-lived assets to their carrying value and
recognizes an impairment loss by a charge to net earnings for the excess of carrying value over fair value. The fair
value of the assets is estimated using the discounted future cash flows of the assets. Property, plant and equipment
assets are grouped at the lowest level for which there are identifiable cash flows when assessing impairment. Cash
flows for retail assets are identified at the individual store level. Long-lived assets to be disposed of are reported at
the lower of their carrying amount, or fair value less estimated costs to sell.
The Company recognized net impairment and disposition losses of $224.4 million, $325.0 million and $26.0 million
in fiscal 2009, 2008 and 2007, respectively, primarily due to underperforming Company-operated retail stores. The
net losses in fiscal 2009 and 2008 include $129.2 million and $201.6 million, respectively, of asset impairments
related to the US and International store closures and charges incurred for office facilities no longer occupied by the
Company due to the reduction in positions within Starbucks leadership structure and non-store organization. See
Note 2 for further details. Depending on the underlying asset that is impaired, these losses may be recorded in any
one of the operating expense lines on the consolidated statements of earnings: for retail operations, the net
impairment and disposition losses are recorded in Restructuring charges and Store operating expenses; for specialty
operations, these losses are recorded in Restructuring charges and Other operating expenses; and for all other
operations, these losses are recorded in Cost of sales including occupancy costs, General and administrative
expenses, or Restructuring charges.

Insurance Reserves
The Company uses a combination of insurance and self-insurance mechanisms, including a wholly owned captive
insurance entity and participation in a reinsurance pool, to provide for the potential liabilities for certain risks,
including workers’ compensation, healthcare benefits, general liability, property insurance, and director and
officers’ liability insurance. Liabilities associated with the risks that are retained by the Company are not discounted

                                                           47
and are estimated, in part, by considering historical claims experience, demographic factors, severity factors and
other actuarial assumptions.

Revenue Recognition
Consolidated revenues are presented net of intercompany eliminations for wholly owned subsidiaries and investees
controlled by the Company and for licensees accounted for under the equity method, based on the Company’s
percentage ownership. Additionally, consolidated revenues are recognized net of any discounts, returns, allowances
and sales incentives, including coupon redemptions and rebates.

Stored Value Cards
Revenues from the Company’s stored value cards, such as the Starbucks Card, and gift certificates are recognized
when tendered for payment, or upon redemption. Outstanding customer balances are included in Deferred revenue
on the consolidated balance sheets. There are no expiration dates on the Company’s stored value cards or gift
certificates, and Starbucks does not charge any service fees that cause a decrement to customer balances.
While the Company will continue to honor all stored value cards and gift certificates presented for payment,
management may determine the likelihood of redemption to be remote for certain card and certificate balances due
to, among other things, long periods of inactivity. In these circumstances, if management also determines there is no
requirement for remitting balances to government agencies under unclaimed property laws, card and certificate
balances may then be recognized in the consolidated statements of earnings in Net interest income and other. For the
fiscal years ended September 27, 2009, September 28, 2008 and September 30, 2007 income recognized on
unredeemed stored value card balances and gift certificates was $26.0 million, $13.6 million and $12.9 million,
respectively.

Retail Revenues
Company-operated retail store revenues are recognized when payment is tendered at the point of sale. Starbucks
maintains a sales return allowance to reduce retail revenues for estimated future product returns, including brewing
equipment, based on historical patterns. Retail store revenues are reported net of sales, use or other transaction taxes
that are collected from customers and remitted to taxing authorities.

Specialty Revenues
Specialty revenues consist primarily of product sales to customers other than through Company-operated retail
stores, as well as royalties and other fees generated from licensing operations. Sales of coffee, tea and related
products are generally recognized upon shipment to customers, depending on contract terms. Shipping charges
billed to customers are also recognized as revenue, and the related shipping costs are included in Cost of sales
including occupancy costs on the consolidated statements of earnings.
Specific to retail store licensing arrangements, initial nonrefundable development fees are recognized upon
substantial performance of services for new market business development activities, such as initial business, real
estate and store development planning, as well as providing operational materials and functional training courses
for opening new licensed retail markets. Additional store licensing fees are recognized when new licensed stores are
opened. Royalty revenues based upon a percentage of reported sales and other continuing fees, such as marketing
and service fees, are recognized on a monthly basis when earned. For certain licensing arrangements, where the
Company intends to acquire an ownership interest, the initial nonrefundable development fees are deferred to Other
long-term liabilities on the consolidated balance sheets until acquisition, at which point the fees are reflected as a
reduction of the Company’s investment.
Other arrangements involving multiple elements and deliverables as well as upfront fees are individually evaluated
for revenue recognition. Cash payments received in advance of product or service delivery are recorded in Deferred
revenue until earned.

                                                          48
Advertising
The Company expenses most advertising costs as they are incurred, except for certain production costs that are
expensed the first time the advertising campaign takes place and direct-response advertising, which is capitalized
and amortized over its expected period of future benefits.
Advertising expenses, recorded in Store operating expenses, Other operating expenses and General and admin-
istrative expenses on the consolidated statements of earnings, totaled $126.3 million, $129.0 million and
$103.5 million in fiscal 2009, 2008 and 2007, respectively. As of September 27, 2009 and September 28,
2008, $7.2 million and $8.8 million, respectively, of capitalized advertising costs were recorded in Prepaid
expenses and other current assets, and Other assets on the consolidated balance sheets.

Research and Development
Starbucks expenses research and development costs as they are incurred. The Company spent approximately
$6.5 million, $7.2 million and $7.0 million during fiscal 2009, 2008 and 2007, respectively, on technical research
and development activities, in addition to customary product testing and product and process improvements in all
areas of its business.

Store Preopening Expenses
Costs incurred in connection with the start-up and promotion of new store openings are expensed as incurred.

Operating Leases
Starbucks leases retail stores, roasting and distribution facilities and office space under operating leases. Most lease
agreements contain tenant improvement allowances, rent holidays, lease premiums, rent escalation clauses and/or
contingent rent provisions. For purposes of recognizing incentives, premiums and minimum rental expenses on a
straight-line basis over the terms of the leases, the Company uses the date of initial possession to begin amortization,
which is generally when the Company enters the space and begins to make improvements in preparation of intended
use.
For tenant improvement allowances and rent holidays, the Company records a deferred rent liability in Accrued
occupancy costs and Other long-term liabilities on the consolidated balance sheets and amortizes the deferred rent
over the terms of the leases as reductions to rent expense on the consolidated statements of earnings.
For premiums paid upfront to enter a lease agreement, the Company records a deferred rent asset in Prepaid
expenses and other current assets and Other assets on the consolidated balance sheets and then amortizes the
deferred rent over the terms of the leases as additional rent expense on the consolidated statements of earnings.
For scheduled rent escalation clauses during the lease terms or for rental payments commencing at a date other than
the date of initial occupancy, the Company records minimum rental expenses on a straight-line basis over the terms
of the leases on the consolidated statements of earnings.
Certain leases provide for contingent rents, which are determined as a percentage of gross sales in excess of
specified levels. The Company records a contingent rent liability in Accrued occupancy costs on the consolidated
balance sheets and the corresponding rent expense when specified levels have been achieved or when management
determines that achieving the specified levels during the fiscal year is probable.
When ceasing operations in Company-operated stores under operating leases, in cases where the lease contract
specifies a termination fee due to the landlord, the Company records such expense at the time written notice is given
to the landlord. In cases where terms, including termination fees, are yet to be negotiated with the landlord, the
Company will record the expense upon signing of an agreement with the landlord. Finally, in cases where the
landlord does not allow the Company to prematurely exit its lease, but allows for subleasing, the Company estimates
the fair value of any sublease income that can be generated from the location and expenses the present value of the
excess of remaining lease payments to the landlord over the projected sublease income at the cease-use date.

                                                          49
Asset Retirement Obligations
Starbucks recognizes a liability for the fair value of required asset retirement obligations (“ARO”) when such
obligations are incurred. The Company’s AROs are primarily associated with leasehold improvements which, at the
end of a lease, the Company is contractually obligated to remove in order to comply with the lease agreement. At the
inception of a lease with such conditions, the Company records an ARO liability and a corresponding capital asset in
an amount equal to the estimated fair value of the obligation. The liability is estimated based on a number of
assumptions requiring management’s judgment, including store closing costs, cost inflation rates and discount
rates, and is accreted to its projected future value over time. The capitalized asset is depreciated using the
convention for depreciation of leasehold improvement assets. Upon satisfaction of the ARO conditions, any
difference between the recorded ARO liability and the actual retirement costs incurred is recognized as an operating
gain or loss in the consolidated statements of earnings. As of September 27, 2009 and September 28, 2008, the
Company’s net ARO asset included in Net property, plant and equipment was $15.1 million and $18.5 million,
respectively, while the Company’s net ARO liability included in Other long-term liabilities was $43.4 million and
$44.6 million, as of the same respective dates.

Stock-based Compensation
The Company maintains several equity incentive plans under which it may grant non-qualified stock options,
incentive stock options, restricted stock, restricted stock units (“RSUs”) or stock appreciation rights to employees,
non-employee directors and consultants. The Company also has employee stock purchase plans (“ESPP”). RSUs
issued by the Company are equivalent to nonvested shares under the applicable accounting guidance. See Note 14
for additional details.

Foreign Currency Translation
The Company’s international operations generally use their local currency as their functional currency. Assets and
liabilities are translated at exchange rates in effect at the balance sheet date. Income and expense accounts are
translated at the average monthly exchange rates during the year. Resulting translation adjustments are recorded as a
component of Accumulated other comprehensive income on the consolidated balance sheets.

Income Taxes
The Company computes income taxes using the asset and liability method, under which deferred income taxes are
provided for the temporary differences between the financial statement carrying amounts and the tax basis of the
Company’s assets and liabilities. The Company will establish a valuation allowance for deferred tax assets if it is
more likely than not that these items will either expire before the Company is able to realize their benefits, or that
future deductibility is uncertain. Periodically, the valuation allowance is reviewed and adjusted based on
management’s assessments of realizable deferred tax assets.
Starbucks adopted the new accounting requirements for uncertain tax positions on the first day of the Company’s
first fiscal quarter of 2008. The cumulative impact of adopting the new accounting requirements is shown in the
consolidated statements of shareholders’ equity. The Company recognizes the tax benefit from an uncertain tax
position only if it is more likely than not that the tax position will be sustained on examination by the taxing
authorities, based on the technical merits of the position. The tax benefits recognized in the financial statements
from such a position are measured based on the largest benefit that has a greater than 50% likelihood of being
realized upon ultimate settlement. The Company recognizes interest and penalties related to income tax matters in
income tax expense. See Note 15 for additional details.

Earnings per Share
Basic earnings per share is computed on the basis of the weighted average number of shares and common stock units
that were outstanding during the period. Diluted earnings per share includes the dilutive effect of common stock
equivalents consisting of certain shares subject to stock options and RSUs, using the treasury stock method.
Performance-based RSUs are considered diluted when the related performance criterion has been met.

                                                         50
Common Stock Share Repurchases
The Company may repurchase shares of its common stock under a program authorized by its Board of Directors
including pursuant to a contract, instruction or written plan meeting the requirements of Rule 10b5-1(c)(1) of the
Securities Exchange Act of 1934. In accordance with the Washington Business Corporation Act, share repurchases
are not displayed separately as treasury stock on the consolidated balance sheets or consolidated statements of
shareholders’ equity. Instead, the par value of repurchased shares is deducted from Common stock and the
remaining excess repurchase price over par value is deducted from Additional paid-in capital and from Retained
earnings, once additional paid-in capital is depleted. See Note 13 for additional information.

Recent Accounting Pronouncements
Starbucks adopted the new guidance issued by the Financial Accounting Standards Board (“FASB”) for fair value
measurement for its financial assets and liabilities effective September 29, 2008 (see Note 5 for additional
disclosures). The guidance defines fair value, establishes a framework for measuring fair value in GAAP and
expands disclosures about fair value measurements. This guidance is effective for nonfinancial assets and liabilities
for Starbucks first fiscal quarter of 2010. The Company believes that the adoption of this new guidance for its
nonfinancial assets and liabilities will not have a material impact on its financial statements.
In December 2007, the FASB issued authoritative guidance on business combinations, establishing principles and
requirements for how an acquirer recognizes and measures in its financial statements the identifiable assets
acquired, the liabilities assumed, any resulting goodwill, and any noncontrolling interest in an acquiree. The
guidance also provides for disclosures to enable users of the financial statements to evaluate the nature and financial
effects of the business combination. This new guidance will be effective for Starbucks first fiscal quarter of 2010
and must be applied prospectively to business combinations completed in fiscal 2010 and beyond.
In December 2007, the FASB issued authoritative guidance on accounting and reporting for noncontrolling interests
in subsidiaries. The guidance clarifies that a noncontrolling interest in a subsidiary should be accounted for as a
component of equity separate from the parent’s equity. Starbucks will apply the new guidance relating to
noncontrolling interests beginning in the first fiscal quarter of 2010 on a prospective basis, except for the
presentation and disclosure requirements, which will be applied retrospectively. The adoption of this guidance
will not have a material impact on the Company’s financial statements.
In June 2009, the FASB issued authoritative guidance on the consolidation of variable interest entities (“VIE”),
which will be effective for Starbucks first fiscal quarter of 2011. The new guidance requires a qualitative approach
to identifying a controlling financial interest in a variable interest entity, and requires ongoing assessment of
whether an entity is a VIE and whether an interest in a VIE makes the holder the primary beneficiary of the VIE. The
Company is currently evaluating the impact that adoption may have on its consolidated financial statements.

Note 2: Restructuring Charges
In fiscal 2009, Starbucks continued to execute its restructuring efforts to position the Company for long-term
profitable growth. These efforts have been focused on both the global Company-operated store base and the non-
retail support organization. Starbucks actions to rationalize its store portfolio have included plans (announced in
July 2008 and January 2009) to close approximately 800 Company-operated stores in the US, restructure its
Australia market, and close approximately 100 additional Company-operated stores internationally. Since those
announcements, nearly all of the approximately 800 US stores, 61 stores in Australia and 41 in other International
markets have been closed.
US Store Closures — In fiscal 2009, the Company closed 383 of the approximately 600 stores announced in July
2008, bringing the total number of US closures under this restructuring action to 588 stores. The Company also
closed 183 of the approximately 200 stores announced for closure in January 2009.
International Store Closures — During fiscal 2009, the Company closed 41 of the approximately 100 stores
announced for closure in January 2009. The Company expects to complete the remaining closures in fiscal 2010,
and will recognize the associated lease exit costs concurrently with the actual closures.

                                                          51
Workforce Reduction and Other Related Costs — Workforce reductions related to store closures and non-store
support positions resulted in the recognition of $19.0 million in employee termination costs in fiscal 2009. In
addition, in fiscal 2009, Starbucks recognized $47.8 million of valuation adjustments on corporate office facilities
that were no longer intended to be occupied by the Company.
Restructuring charges by type and a reconciliation of the associated accrued liability (in millions):
                                                                          Lease Exit                        Employee
                                                                          and Other           Asset        Termination
                                                                         Related Costs     Impairments        Costs        Total

       Total expected costs. . . . . . . . . . . . . . . . . . . . .         $ 263.1         $330.8          $ 37.0       $ 630.9
       Expenses recognized in fiscal 2009(1) . . . . . . . .                   184.2          129.2            19.0         332.4
       Expenses recognized in fiscal 2008(1) . . . . . . . .                    47.8          201.6            17.5         266.9
       Costs incurred in fiscal 2009(1) . . . . . . . . . . . . .              169.5          129.2            19.0         317.7
       Costs incurred in fiscal 2008(1) . . . . . . . . . . . . .               62.6          201.6            17.5         281.7
       Costs incurred cumulative to date . . . . . . . . . . .                 232.1          330.8            36.5         599.4
       Accrued liability as of September 30, 2007 . . .                      $    —                          $ —          $    —
       Costs incurred in fiscal 2008, excluding non-
         cash charges and credits(2) . . . . . . . . . . . . . .                  72.4                         17.5          89.9
       Cash payments . . . . . . . . . . . . . . . . . . . . . . . .             (24.4)                       (12.1)        (36.5)
       Accrued liability as of September 28, 2008 . . .                           48.0                          5.4          53.4
       Costs incurred in fiscal 2009, excluding non-
         cash charges and credits(2) . . . . . . . . . . . . . .                 192.6                         19.0         211.6
       Cash payments . . . . . . . . . . . . . . . . . . . . . . . .            (137.8)                       (23.2)       (161.0)
       Accrued liability as of September 27, 2009 . . .                      $ 102.8                         $ 1.2        $ 104.0

Restructuring charges by reportable segment (in millions):
                                                                                                           Unallocated
                                                                                    US     International   Corporate(3)    Total

       Total expected costs . . . . . . . . . . . . . . . . . . . . . . . . .     $458.8      $75.9           $96.2       $630.9
       Expenses recognized in fiscal 2009(1) . . . . . . . . . . . .               246.3       27.0            59.1        332.4
       Expenses recognized in fiscal 2008(1) . . . . . . . . . . . .               210.9       19.2            36.8        266.9
       Costs incurred in fiscal 2009(1) . . . . . . . . . . . . . . . . .          231.4       27.1            59.2        317.7
       Costs incurred in fiscal 2008(1) . . . . . . . . . . . . . . . . .          225.7       19.2            36.8        281.7
       Costs incurred cumulative to date . . . . . . . . . . . . . . .             457.1       46.3            96.0        599.4
(1)
      The difference between expenses recognized and costs incurred within a period is due to lease termination
      agreements that were finalized in one period for store closures to occur in a subsequent period. Such termination
      fees are amortized on a straight-line basis from the date of the termination agreement to the date of closure.
(2)
      Non-cash charges and credits for Lease exit and other related costs primarily represent deferred rent balances
      recognized as expense credits at the cease-use date.
(3)
      Includes $1.0 million of employee termination costs for the CPG segment for fiscal 2009.


                                                                        52
Note 3: Investments
Short-term and long-term investments (in millions):
                                                                                                   Gross        Gross
                                                                                                 Unrealized   Unrealized
                                                                                     Amortized    Holding      Holding     Fair
                                                                                       Cost        Gains       Losses      Value

     September 27, 2009
     Short-term investments — available-for-sale securities:
       Corporate debt securities . . . . . . . . . . . . . . . . . . . . .            $ 2.5                                $ 2.5
       Government treasury securities . . . . . . . . . . . . . . . .                  19.0                                 19.0
         Total . . . . . . . . . . . . . . . . . . . . . . . . . . . . . . . . . .     21.5                                 21.5
     Short-term investments — trading securities . . . . . . . . .                     58.5                                 44.8
     Total short-term investments . . . . . . . . . . . . . . . . . . . .             $80.0                                $66.3
     Long-term investments — available-for-sale securities:
       State and local government obligations. . . . . . . . . . .                    $57.8        $—           $(2.1)     $55.7
       Corporate debt securities . . . . . . . . . . . . . . . . . . . . .             14.7         0.8            —        15.5
     Total long-term investments. . . . . . . . . . . . . . . . . . . . .             $72.5        $0.8         $(2.1)     $71.2
     September 28, 2008
     Short-term investments — available-for-sale securities:
       Corporate debt securities . . . . . . . . . . . . . . . . . . . . .            $ 3.0                                $ 3.0
         Total . . . . . . . . . . . . . . . . . . . . . . . . . . . . . . . . . .      3.0                                  3.0
     Short-term investments — trading securities . . . . . . . . .                     58.2                                 49.5
     Total short-term investments . . . . . . . . . . . . . . . . . . . .             $61.2                                $52.5
     Long-term investments — available-for-sale securities:
       State and local government obligations. . . . . . . . . . .                    $65.8        $—           $(6.0)     $59.8
         Corporate debt securities . . . . . . . . . . . . . . . . . . .               12.1         —            (0.5)      11.6
     Total long-term investments. . . . . . . . . . . . . . . . . . . . .             $77.9        $—           $(6.5)     $71.4


Available-for-sale securities
Proceeds from sales of available-for-sale securities were $5.0 million, $75.9 million and $47.5 million and in fiscal
years 2009, 2008 and 2007, respectively. For fiscal years 2009, 2008 and 2007, there were immaterial realized gains
and losses on sales and maturities.
As of September 27, 2009, the Company’s long-term available-for-sale securities of $71.2 million included
$55.7 million invested in auction rate securities (“ARS”). As of September 28, 2008, the Company’s long-term
available-for-sale securities of $71.4 million included $59.8 million invested in ARS. ARS have long-dated
maturities but provide liquidity through a Dutch auction process that resets the applicable interest rate at pre-
determined calendar intervals. Due to the auction failures that began in February 2008, these securities became
illiquid and were classified as long-term investments. The investment principal associated with the failed auctions
will not be accessible until:
     • successful auctions resume;
     • an active secondary market for these securities develops;
     • the issuers replace these securities with another form of financing; or
     • final payments are made according to the contractual maturities of the debt issues which range from 21 to
       36 years.

                                                                         53
The Company does not intend to sell the ARS, nor is it likely it will be required to sell the ARS before their
anticipated recovery. The Company expects such recoveries to occur prior to the contractual maturities. In fiscal
2009, one ARS was called at par value of $7.4 million and one ARS was partially called at par value of $0.6 million.

The Company had $2.1 million and $6.0 million of accumulated unrealized losses on ARS as of the end of fiscal
2009 and 2008, respectively, determined to be temporary, which is included in Accumulated other comprehensive
income as a reduction in shareholders’ equity. As of September 27, 2009, approximately $4.9 million in ARS were
rated A/B2 by Standard & Poor’s and Moody’s, respectively. All of the remaining securities were rated investment
grade or higher by two or more of the following rating agencies: Moody’s, Standard & Poor’s and Fitch Ratings. The
Company’s ARS are collateralized by portfolios of student loans, substantially all of which are guaranteed by the
United States Department of Education.

The following table presents the length of time available-for-sale securities were in continuous unrealized loss
positions but were not determined to be other-than-temporarily impaired (in millions):


Consecutive Monthly Unrealized Losses

                                                                                                                      Greater Than
                                                                                                  Less Than            or Equal to
                                                                                                 12 Months              12 months
                                                                                               Gross                 Gross
                                                                                             Unrealized            Unrealized
                                                                                              Holding       Fair    Holding       Fair
                                                                                              Losses       Value    Losses       Value

     September 27, 2009
     State and local government obligations . . . . . . . . . . . . . . .                      $ —        $ —        $(2.1)     $55.7
     Total . . . . . . . . . . . . . . . . . . . . . . . . . . . . . . . . . . . . . . . .     $ —        $ —        $(2.1)     $55.7
     September 28, 2008
     State and local government obligations . . . . . . . . . . . . . . .                      $(6.0)     $59.8      $ —        $ —
     Corporate debt securities . . . . . . . . . . . . . . . . . . . . . . . . .                (0.5)      11.6        —          —
     Total . . . . . . . . . . . . . . . . . . . . . . . . . . . . . . . . . . . . . . . .     $(6.5)     $71.4      $ —        $ —

Gross unrealized holding losses on the state and local obligations pertain to the Company’s eleven ARS. As
Starbucks does not intend to sell these securities, nor is it likely it will be required to sell these securities before their
anticipated recovery, which may be at maturity, the Company does not consider these securities to be
other-than-temporarily impaired.

There were no realized losses recorded for other than temporary impairments during fiscal years 2009, 2008 or
2007.


Trading securities

Trading securities are comprised of marketable equity mutual funds and equity exchange-traded funds that
approximate a portion of the Company’s liability under the Management Deferred Compensation Plan (“MDCP”),
a defined contribution plan. The corresponding deferred compensation liability of $68.3 million and $68.0 million
in fiscal 2009 and 2008, respectively, is included in Accrued compensation and related costs on the consolidated
balance sheets. The changes in net unrealized holding gains/losses in the trading portfolio included in earnings for
the years ended September 27, 2009 and September 28, 2008 were a net loss of $4.9 million and $14.5 million,
respectively.

                                                                            54
Note 4: Derivative Financial Instruments
Cash Flow Hedges
The Company and certain subsidiaries enter into cash flow derivative instruments to hedge portions of anticipated
revenue streams and inventory purchases in currencies other than the entity’s functional currency. Outstanding
forward contracts, which comprise the majority of the Company’s derivative instruments, hedge monthly forecasted
revenue transactions denominated in Japanese yen and Canadian dollars, as well as forecasted inventory purchases
denominated in US dollars for foreign operations. From time to time, the Company also uses futures contracts to
hedge the variable price component for a small portion of its price-to-be-fixed green coffee purchase contracts.
The Company had net derivative losses of $3.9 million and $9.2 million, net of taxes, in Accumulated OCI as of
September 27, 2009 and September 28, 2008, respectively, related to cash flow hedges. Of the net derivative losses
accumulated as of September 28, 2009, $0.9 million pertain to hedging instruments that will be dedesignated within
12 months and will also continue to experience fair value changes before affecting earnings. Ineffectiveness from
hedges that were discontinued in fiscal years 2009 and 2008 was insignificant. Outstanding contracts will expire
within 36 months.

Net Investment Hedges
Net investment derivative instruments are used to hedge the Company’s equity method investment in Starbucks
Coffee Japan, Ltd. (“Starbucks Japan”) as well as the Company’s net investments in its Canada, UK and China
subsidiaries, to minimize foreign currency exposure.
The Company had net derivative losses of $19.8 million and $13.0 million, net of taxes, in Accumulated OCI as of
September 27, 2009 and September 28, 2008, respectively, related to net investment derivative hedges. Outstanding
contracts will expire within 18 months.

Other Derivatives
The Company enters into certain foreign currency forward contracts that are not designated as hedging instruments
to mitigate the translation risk of certain balance sheet items. These contracts are recorded at fair value, with the
changes in fair value recognized in Net interest income and other on the consolidated statements of earnings. For the
fiscal years 2009 and 2008, these forward contracts resulted in a net gain of $20.0 million and a net loss $0.1 million,
respectively. These gains and losses were largely offset by the financial impact of translating foreign currency
denominated payables and receivables, which are also recognized in Net interest income and other.
In the third quarter of fiscal 2009, the Company entered into certain swap and futures contracts that are not
designated as hedging instruments to mitigate the price uncertainty of a portion of its future purchases of dairy
products and diesel fuel. These contracts are recorded at fair value, with the changes in fair value recognized in Net
interest income and other on the consolidated statement of earnings. For the fiscal year 2009, these swaps and
futures contracts resulted in a net loss of $0.6 million.


                                                          55
Fair values of derivative instruments on the consolidated balance sheet as of September 27, 2009 (in millions):
                                                          Assets                                         Liabilities
Contract Type                          Balance Sheet Location             Fair Value    Balance Sheet Location                    Fair Value

Derivatives designated as hedging instrument for accounting purposes:
Cash Flow Hedges:
  Foreign Exchange . . . . . Prepaid expenses and
                             other current assets           $ 6.3     Other accrued expenses . .                                   $ 6.6
  Foreign Exchange . . . . . Other assets                             Other long-term
                                                              5.5     liabilities . . . . . . . . . . . . .                           5.6
                                                                             11.8                                                    12.2
Net Investment Hedges:
  Foreign Exchange . . . . .           Prepaid expenses and
                                       other current assets                   0.4       Other accrued expenses . .                    4.7
   Foreign Exchange . . . . .          Other assets                                     Other long-term
                                                                               —        liabilities . . . . . . . . . . . . .         6.4
                                                                              0.4                                                    11.1
Total derivatives designated as hedging instrument for
  accounting purposes . . . . . . . . . . . . . . . . . . . . . . . . .    $12.2                                                   $23.3
Derivatives not designated as hedging instruments for accounting purposes:
  Foreign Exchange . . . . . Prepaid expenses and
                              other current assets          $ 0.9     Other accrued expenses . .                                   $ 9.6
  Commodity . . . . . . . . . Prepaid expenses and
                              other current assets            0.1     Other accrued expenses . .                                      0.3
Total derivatives not designated as hedging instruments
  for accounting purposes . . . . . . . . . . . . . . . . . . . . . .        1.0                                                     9.9
  Total Derivatives . . . . .                                              $13.2                                                   $33.2

The following table presents the effect of derivative instruments on the consolidated statements of earnings in fiscal
2009 (in millions):
                                                                          Location of Gain/(Loss)
                                                                             Reclassified from
                                                                               Accumulated
                                                                           OCI into Earnings -             Gain/(Loss) Reclassed from
Contract Type                        Gain/(Loss) Recognized in OCI           Effective Portion            Accumulated OCI to Earnings

Derivatives designated as hedging instruments for accounting purposes:
Cash Flow Hedges:
  Foreign Exchange(1) . .           $ 9.3              Total net revenue . . . . .                                      $(4.5)
                                                       Cost of sales including
                                                       occupancy costs . . . . . .                                         6.0
  Commodity . . . . . . . .            (1.5)           Cost of sales including
                                                       occupancy costs . . . . . .                                        (1.0)
  Interest rate(2) . . . . . .           —             Interest expense . . . . . .                                       (0.7)
                                                   7.8                                                                    (0.2)
Net Investment Hedges:
  Foreign Exchange(3) . .                        (10.8)                                                                     —
   Total . . . . . . . . . . . . .              $ (3.0)                                                                 $(0.2)


                                                                     56
Location of Gain/(Loss)             Gain/(Loss)
                                                                    Recognized in Earnings         Recognized in Earnings

Derivatives not designated as hedging instruments for accounting purposes:
  Foreign Exchange                                       Interest income and other, net                    $22.8
  Commodity                                              Interest Income and other, net                    $ (0.6)
(1)
      In fiscal 2009, $0.3 million of gain was recognized in Net interest income and other related to the ineffective
      portion.
(2)
      The Company entered into, dedesignated and settled forward interest rate contracts to hedge movements in
      interest rates prior to issuing its $550 million 6.25% Senior Notes in fiscal 2007. The resulting net losses from
      these contracts will continue to be reclassified to Interest expense on the consolidated statements of earnings
      over the life of the Senior Notes due in 2017.
(3)
      In fiscal 2009, $3.7 million of gain was recognized in Net interest income and other related to the ineffective
      portion.
The Company had the following outstanding derivative contracts as of September 27, 2009, based on notional
amounts:
      • $708 million in foreign exchange contracts
      • $25 million in dairy contracts
      • $7 million in diesel contracts

Note 5: Fair Value Measurements
The Company adopted the new fair value accounting guidance related to financial assets and liabilities effective
September 29, 2008, and will adopt the new fair value accounting guidance for nonfinancial assets and liabilities in
the first fiscal quarter of 2010. The new fair value accounting guidance allows for this two-step adoption approach.
The Company continues to evaluate the potential impact of the adoption of fair value measurements related to its
property, plant and equipment, goodwill and other intangible assets.
The guidance defines fair value, establishes a framework for measuring fair value under GAAP and expands
disclosures about fair value measurements. It also establishes a fair value hierarchy that prioritizes the inputs used to
measure fair value:
      • Level 1: Observable inputs that reflect unadjusted quoted prices for identical assets or liabilities traded in
        active markets.
      • Level 2: Inputs other than quoted prices included within Level 1 that are observable for the asset or
        liability, either directly or indirectly.
      • Level 3: Inputs that are generally unobservable. These inputs may be used with internally developed
        methodologies that result in management’s best estimate of fair value.


                                                           57
Financial Assets and Liabilities Measured at Fair Value on a Recurring Basis (in millions):
                                                                                             Sep 27, 2009   Level 1   Level 2   Level 3

     Assets:
     Trading securities . . . . . . . . . . . . . . . . . . . . . . . . . . . . . . .          $ 44.8       $44.8     $ —       $ —
     Available-for-sale securities . . . . . . . . . . . . . . . . . . . . . . .                 92.7        19.0      18.0      55.7
     Derivatives . . . . . . . . . . . . . . . . . . . . . . . . . . . . . . . . . . . .         13.2          —       13.2       —
     Total . . . . . . . . . . . . . . . . . . . . . . . . . . . . . . . . . . . . . . . .     $150.7       $63.8     $31.2     $55.7
     Liabilities:
     Derivatives . . . . . . . . . . . . . . . . . . . . . . . . . . . . . . . . . . . .       $ 33.2       $ —       $33.2     $ —
Trading securities include equity mutual funds and exchange-traded funds. For these securities, the Company uses
quoted prices in active markets for identical assets to determine their fair value, thus they are considered to be
Level 1 instruments.
Available-for-sale securities include government treasury securities, corporate bonds and ARS. For government
treasury securities, the Company uses quoted prices in active markets for identical assets to determine their fair
value, thus they are considered to be Level 1 instruments. The Company uses observable direct and indirect inputs
for corporate bonds, which are considered Level 2 instruments. Level 3 instruments are comprised solely of ARS,
all of which are considered to be illiquid due to the auction failures that began in February 2008. The Company
values ARS using an internally developed valuation model, whose inputs include interest rate curves, credit and
liquidity spreads, and effective maturity.
Derivative assets and liabilities include foreign currency forward contracts, commodity swaps and futures contracts.
Where applicable, the Company uses quoted prices in an active market for identical derivative assets and liabilities
that are traded on exchanges. These derivative assets and liabilities are coffee and dairy futures contracts, and are
included in Level 1. Derivative assets and liabilities included in Level 2 are over-the-counter currency forward
contracts and commodity swaps whose fair values are estimated using industry-standard valuation models. Such
models project future cash flows and discount the future amounts to a present value using market-based observable
inputs, including interest rate curves and forward and spot prices for currencies and commodities.

Changes in Level 3 Instruments Measured at Fair Value on a Recurring Basis (in millions):
                                                                                                                                 ARS

     Beginning balance, September 28, 2008 . . . . . . . . . . . . . . . . . . . . . . . . . . . . . . . . . . . . . . . . $59.8
     Total reduction in unrealized losses included in other comprehensive income . . . . . . . . . . . . .                          3.9
     Purchases, sales, issuances, and settlements . . . . . . . . . . . . . . . . . . . . . . . . . . . . . . . . . . . . .        (8.0)
     Transfers in (out) of Level 3 . . . . . . . . . . . . . . . . . . . . . . . . . . . . . . . . . . . . . . . . . . . . . . . .   —
     Ending balance, September 27, 2009 . . . . . . . . . . . . . . . . . . . . . . . . . . . . . . . . . . . . . . . . . . $55.7

Financial Assets and Liabilities Measured at Fair Value on a Nonrecurring Basis
The Company measures certain financial assets, including its cost and equity method investments, at fair value on a
nonrecurring basis. These assets are recognized at fair value when they are deemed to be other-than-temporarily
impaired.


                                                                            58
Note 6: Inventories
Inventories consisted of the following (in millions):
                                                                                                                   Sep 27, 2009   Sep 28, 2008

     Coffee:
       Unroasted . . . . . . . . . . . . . . . . . . . . . . . . . . . . . . . . . . . . . . . . . . . . . .         $381.6         $377.7
       Roasted. . . . . . . . . . . . . . . . . . . . . . . . . . . . . . . . . . . . . . . . . . . . . . . .          76.7           89.6
     Other merchandise held for sale . . . . . . . . . . . . . . . . . . . . . . . . . . . . . . .                    116.0          120.6
     Packaging and other supplies. . . . . . . . . . . . . . . . . . . . . . . . . . . . . . . . . .                   90.6          104.9
     Total . . . . . . . . . . . . . . . . . . . . . . . . . . . . . . . . . . . . . . . . . . . . . . . . . . .     $664.9         $692.8

Other merchandise held for sale includes, among other items, serveware, tea and brewing equipment.
As of September 27, 2009, the Company had committed to purchasing green coffee totaling $155 million under
fixed-price contracts and an estimated $84 million under price-to-be-fixed contracts. The Company believes, based
on relationships established with its suppliers in the past, the risk of non-delivery on such purchase commitments is
remote.

Note 7: Equity and Cost Investments
Equity and cost investments (in millions):
                                                                                                                   Sep 27, 2009   Sep 28, 2008

     Equity method investments . . . . . . . . . . . . . . . . . . . . . . . . . . . . . . . . . . .                 $313.2         $267.9
     Cost method investments . . . . . . . . . . . . . . . . . . . . . . . . . . . . . . . . . . . . .                 39.1           34.7
     Total . . . . . . . . . . . . . . . . . . . . . . . . . . . . . . . . . . . . . . . . . . . . . . . . . . .     $352.3         $302.6


Equity Method Investments
Equity investees and ownership interests by reportable operating segment:
                                                                                                                   Sep 27, 2009   Sep 28, 2008

     United States
        StarCon, LLC . . . . . . . . . . . . . . . . . . . . . . . . . . . . . . . . . . . . . . . . . . .              —%           50.0%
     International
        Starbucks Coffee Korea Co., Ltd. . . . . . . . . . . . . . . . . . . . . . . . . . . . .                      50.0           50.0
        Starbucks Coffee Austria GmbH . . . . . . . . . . . . . . . . . . . . . . . . . . . . .                       50.0           50.0
        Starbucks Coffee Switzerland AG . . . . . . . . . . . . . . . . . . . . . . . . . . . .                       50.0           50.0
        Starbucks Coffee España, S.L . . . . . . . . . . . . . . . . . . . . . . . . . . . . . . .                    50.0           50.0
        President Starbucks Coffee Taiwan Ltd. . . . . . . . . . . . . . . . . . . . . . . .                          50.0           50.0
        Shanghai President Coffee Co. . . . . . . . . . . . . . . . . . . . . . . . . . . . . . .                     50.0           50.0
        Starbucks Coffee France SAS . . . . . . . . . . . . . . . . . . . . . . . . . . . . . . .                     50.0           50.0
        Berjaya Starbucks Coffee Company Sdn. Bhd. (Malaysia) . . . . . . . . . .                                     50.0           50.0
        Starbucks Brasil Comercio de Cafes Ltda. . . . . . . . . . . . . . . . . . . . . . .                          49.0           49.0
        Starbucks Coffee Japan, Ltd. . . . . . . . . . . . . . . . . . . . . . . . . . . . . . . . .                  40.1           40.1
        Starbucks Coffee Portugal Lda. . . . . . . . . . . . . . . . . . . . . . . . . . . . . . .                    50.0           50.0
     CPG
        The North American Coffee Partnership . . . . . . . . . . . . . . . . . . . . . . . .                         50.0           50.0
        Starbucks Ice Cream Partnership . . . . . . . . . . . . . . . . . . . . . . . . . . . . .                     50.0           50.0

                                                                            59
StarCon, LLC was a joint venture formed in March 2007 with Concord Music Group, Inc. (“Concord”). The
Company sold its 50% ownership interest to Concord in early fiscal 2009. The International entities operate
licensed Starbucks retail stores. See Note 19 for a discussion of a transaction affecting the Company’s ownership
related to its markets in France, Spain and Portugal. The Company also has licensed the rights to produce and
distribute Starbucks branded products to two partnerships in which the Company holds 50% equity interests. The
North American Coffee Partnership with the Pepsi-Cola Company develops and distributes bottled Frappuccino»
beverages and Starbucks DoubleShot» espresso drinks. Starbucks Ice Cream Partnership developed and distributed
super premium ice creams, and was in the process of being dissolved at the end of fiscal 2009. It was replaced by a
licensing agreement with Unilever for the manufacturing, marketing and distribution of Starbucks super-premium
ice cream products in the US.
Prior to fiscal 2005, Starbucks acquired equity interest in its licensed operations of Malaysia, Austria, Shanghai,
Spain, Switzerland and Taiwan. The carrying amount of these investments was $24.3 million more than the
underlying equity in net assets due to acquired goodwill, which is evaluated for impairment annually. No
impairments were recorded during fiscal years 2009, 2008 or 2007.
The Company’s share of income and losses from its equity method investments is included in Income from equity
investees on the consolidated statements of earnings. Also included in this line item is the Company’s proportionate
share of gross margin resulting from coffee and other product sales to, and royalty and license fee revenues
generated from, equity investees. Revenues generated from these related parties, net of eliminations, were
$125.3 million, $128.1 million and $107.9 million in fiscal years 2009, 2008 and 2007, respectively. Related
costs of sales, net of eliminations, were $64.9 million, $66.2 million and $57.1 million in fiscal years 2009, 2008
and 2007, respectively. As of September 27, 2009 and September 28, 2008, there were $37.6 million and
$40.6 million of accounts receivable, respectively, on the consolidated balance sheets from equity investees
primarily related to product sales and store license fees.
As of September 27, 2009, the aggregate market value of the Company’s investment in Starbucks Japan was
approximately $241 million, based on its available quoted market price.
Summarized combined financial information of the Company’s equity method investees, which represent 100% of
the investees’ financial information (in millions):
     Financial Position as of                                                                            Sep 27, 2009   Sep 28, 2008

     Current assets . . . . . . . . . .    ...................................                             $315.8         $247.2
     Noncurrent assets . . . . . . .       ...................................                              657.6          604.9
     Current liabilities . . . . . . .     ...................................                              292.0          273.5
     Noncurrent liabilities. . . . .       ...................................                               76.5           59.8

     Results of Operations for Fiscal Year Ended                                          Sep 27, 2009   Sep 28, 2008   Sep 30, 2007

     Net revenues . . . . . . . . . . . . . . . . . . . . . . . . . . . . . . . . . . .    $2,100.1       $1,961.0       $1,452.9
     Operating income . . . . . . . . . . . . . . . . . . . . . . . . . . . . . . .           192.5          171.3          186.2
     Net earnings . . . . . . . . . . . . . . . . . . . . . . . . . . . . . . . . . . .       155.8          136.9          159.5

Cost Method Investments
The Company has equity interests in entities that develop and operate Starbucks licensed retail stores in several
global markets. The value of these investments was $36.6 million and $31.9 million as of September 27, 2009 and
September 28, 2008, respectively. Additionally, Starbucks has investments in privately held equity securities
unrelated to Starbucks licensed retail stores. The value of these investments was $2.5 million at September 27, 2009
and $2.8 million at September 28, 2008. As of September 27, 2009 and September 28, 2008, management
determined that the estimated fair values of each cost method investment exceeded the related carrying values. In
the third quarter of fiscal 2009 Starbucks recognized a loss of $0.3 million on one of the investments that is unrelated
to Starbucks licensed retail stores. There were no realized losses recorded for other-than-temporary impairment of
the Company’s cost method investments during fiscal years 2008 or 2007.

                                                                        60
Starbucks has the ability to acquire additional interests in some of these cost method investees at certain intervals.
Depending on the Company’s total percentage of ownership interest and its ability to exercise significant influence
over financial and operating policies, additional investments may require the retroactive application of the equity
method of accounting.

Note 8: Property, Plant and Equipment

Property, plant and equipment (in millions):
                                                                                                                     Sep 27, 2009         Sep 28, 2008

     Land . . . . . . . . . . . . . . . . . . . . . . . . . . . . . . . . . . . . . . . . . . . . . . . . . . .       $      58.2          $      59.1
     Buildings . . . . . . . . . . . . . . . . . . . . . . . . . . . . . . . . . . . . . . . . . . . . . . . .              231.5                217.7
     Leasehold improvements . . . . . . . . . . . . . . . . . . . . . . . . . . . . . . . . . . . . .                     3,349.0              3,363.1
     Store equipment . . . . . . . . . . . . . . . . . . . . . . . . . . . . . . . . . . . . . . . . . . .                1,073.4              1,045.3
     Roasting equipment . . . . . . . . . . . . . . . . . . . . . . . . . . . . . . . . . . . . . . . .                     282.9                220.7
     Furniture, fixtures and other . . . . . . . . . . . . . . . . . . . . . . . . . . . . . . . . . .                      586.7                517.8
     Work in progress . . . . . . . . . . . . . . . . . . . . . . . . . . . . . . . . . . . . . . . . . .                   119.2                293.6
                                                                                                                         5,700.9                5,717.3
     Less accumulated depreciation and amortization . . . . . . . . . . . . . . . . . . .                               (3,164.5)              (2,760.9)
     Property, plant and equipment, net . . . . . . . . . . . . . . . . . . . . . . . . . . . . . .                   $ 2,536.4            $ 2,956.4


Note 9: Other Intangible Assets and Goodwill

Other intangible assets (in millions):
                                                                                                                     Sep 27, 2009         Sep 28, 2008

     Indefinite-lived intangibles . . . . . . . . . . . . . . . . . . . . . . . . . . . . . . . . . . .                   $60.8                $58.3
     Definite-lived intangibles . . . . . . . . . . . . . . . . . . . . . . . . . . . . . . . . . . . .                    15.0                 14.2
     Accumulated amortization . . . . . . . . . . . . . . . . . . . . . . . . . . . . . . . . . . . .                      (7.6)                (5.9)
     Definite-lived intangibles, net . . . . . . . . . . . . . . . . . . . . . . . . . . . . . . . . .                      7.4                    8.3
     Total other intangible assets . . . . . . . . . . . . . . . . . . . . . . . . . . . . . . . . . .                    $68.2                $66.6
     Definite-lived intangibles approximate remaining weighted average useful
       life in years. . . . . . . . . . . . . . . . . . . . . . . . . . . . . . . . . . . . . . . . . . . . .                  8                    8

Amortization expense for definite-lived intangibles was $1.7 million, $1.5 million and $1.0 million during fiscal
2009, 2008 and 2007, respectively.

Estimated amortization expense for each of the next five fiscal years and thereafter, as of September 27, 2009
(in millions):
     Fiscal Year Ending

     2010 . . . . . . . . . . . . . . . . . . . . . . . . . . . . . . . . . . . . . . .   ............................                              $1.1
     2011 . . . . . . . . . . . . . . . . . . . . . . . . . . . . . . . . . . . . . . .   ............................                               1.0
     2012 . . . . . . . . . . . . . . . . . . . . . . . . . . . . . . . . . . . . . . .   ............................                               1.0
     2013 . . . . . . . . . . . . . . . . . . . . . . . . . . . . . . . . . . . . . . .   ............................                               0.9
     2014 . . . . . . . . . . . . . . . . . . . . . . . . . . . . . . . . . . . . . . .   ............................                               0.8
     Thereafter . . . . . . . . . . . . . . . . . . . . . . . . . . . . . . . . . . .     ............................                               2.6
     Total . . . . . . . . . . . . . . . . . . . . . . . . . . . . . . . . . . . . . . . . . . . . . . . . . . . . . . . . . . . . . . . . . . .    $7.4

                                                                             61
Changes in the carrying amount of goodwill by reportable operating segment for the fiscal year ended September 27,
2009 (in millions):
                                                                                     United States       International         CPG        Total

     Balance as of September 28, 2008 . . . . . . . . . . . . . .                      $118.1               $117.4             $31.0     $266.5
     Purchase price adjustment of previous acquisitions . .                                —                  (1.2)              —         (1.2)
     Impairment . . . . . . . . . . . . . . . . . . . . . . . . . . . . . . .            (7.0)                  —                —         (7.0)
     Other . . . . . . . . . . . . . . . . . . . . . . . . . . . . . . . . . . . .         —                   0.8               —          0.8
     Balance as of September 27, 2009 . . . . . . . . . . . . . .                      $111.1               $117.0             $31.0     $259.1

United States
The impairment of $7.0 million relates to the Company’s Hawaii reporting unit as discussed further in Note 1.

International
The decrease in goodwill of $1.2 million was due to purchase price adjustments for property, plant and equipment
acquired as a part of the Coffee Vision, Inc. acquisition, completed in the fourth quarter of fiscal 2008. The increase
in goodwill of $0.8 million included in Other was due to foreign currency fluctuations.

Note 10:      Debt
Debt consisted of the following (in millions):
                                                                                                                 Sep 27, 2009        Sep 28, 2008

     Commercial paper program (end of period weighted average interest rate
       of 3.4)% . . . . . . . . . . . . . . . . . . . . . . . . . . . . . . . . . . . . . . . . . . . . . . .      $     —             $ 413.0
     Revolving credit facility (end of period weighted average interest rate of
       3.5)% . . . . . . . . . . . . . . . . . . . . . . . . . . . . . . . . . . . . . . . . . . . . . . . . .            —              300.0
     Current portion of long-term debt . . . . . . . . . . . . . . . . . . . . . . . . . . . . . .                       0.2               0.7
       Short-term debt . . . . . . . . . . . . . . . . . . . . . . . . . . . . . . . . . . . . . . . . . .            0.2                713.7
     6.25% 10-year Senior Notes (due Aug 2017) . . . . . . . . . . . . . . . . . . . . . .                          549.2                549.2
     Other long-term debt. . . . . . . . . . . . . . . . . . . . . . . . . . . . . . . . . . . . . . . .              0.1                  0.4
        Long-term debt . . . . . . . . . . . . . . . . . . . . . . . . . . . . . . . . . . . . . . . . . .          549.3                549.6
        Total debt . . . . . . . . . . . . . . . . . . . . . . . . . . . . . . . . . . . . . . . . . . . . . .     $549.5              $1,263.3

Revolving Credit Facility and Commercial Paper Program
The Company has a $1 billion unsecured credit facility (the “credit facility”) with various banks, of which
$100 million may be used for issuances of letters of credit. The credit facility is available for working capital, capital
expenditures and other corporate purposes, which may include acquisitions and share repurchases. The credit
facility is currently set to terminate in August 2011. On October 31, 2008, the Company entered into an amendment
to its facility that, among other changes, increased the interest rate range for borrowings under the credit facility to
0.21% to 0.67% over LIBOR or the greater of the bank prime rate or the Federal Funds Rate plus 0.50%. The
specific spread over LIBOR will continue to depend upon the Company’s long-term credit ratings assigned by
Moody’s and Standard & Poor’s rating agencies and the Company’s coverage ratio. The credit facility contains
provisions requiring the Company to maintain compliance with certain covenants, including a minimum fixed
charge coverage ratio which measures the Company’s ability to cover financing expenses.
Under the Company’s commercial paper program it may issue unsecured commercial paper notes, up to a maximum
aggregate amount outstanding at any time of $1 billion, with individual maturities that may vary, but not exceed
397 days from the date of issue. The program is backstopped by the Company’s credit facility, and the combined

                                                                            62
borrowing limit is $1 billion for the commercial paper program and the credit facility. The Company may issue
commercial paper from time to time, and the proceeds of the commercial paper financing will be used for working
capital needs, capital expenditures and other corporate purposes, which may include acquisitions and share
repurchases.
As of September 27, 2009, the Company also had $14.1 million in letters of credit outstanding under the credit
facility, leaving a total of $985.9 million in remaining borrowing capacity under the combined credit facility and
commercial paper program. As of September 28, 2008, letters of credit totaling $15.9 million were outstanding.

Long-term Debt
In August 2007, the Company issued $550 million of 6.25% Senior Notes (the “notes”) due in August 2017, in an
underwritten registered public offering. Interest is payable semi-annually on February 15 and August 15 of each
year. The notes require the Company to maintain compliance with certain covenants, which limit future liens and
sale and leaseback transactions on certain material properties.
Other long term debt, totaling $0.1 million as of September 27, 2009, matures in fiscal 2011.
Scheduled principal payments on long-term debt are as follows (in millions):
     Fiscal Year Ending

     2010 . . . . . . .   ..................................................                                             . . . . . . . . $ 0.3
     2011 . . . . . . .   ..................................................                                             ........          0.1
     2012 . . . . . . .   ..................................................                                             ........           —
     2013 . . . . . . .   ..................................................                                             ........           —
     2014 . . . . . . .   ..................................................                                             ........           —
     Thereafter . . .     ..................................................                                             . . . . . . . . 550.0
     Total principal payments . . . . . . . . . . . . . . . . . . . . . . . . . . . . . . . . . . . . . . . . . . . . . . . . . . $550.4

Interest Expense
Interest expense, net of interest capitalized, was $39.1 million, $53.4 million and $38.2 million in fiscal 2009, 2008
and 2007, respectively. In fiscal 2009, 2008 and 2007, $2.9 million, $7.2 million and $3.9 million, respectively, of
interest was capitalized for new store and other asset construction projects, and included in Net property, plant and
equipment on the consolidated balance sheets.

Note 11:      Other Long-term Liabilities
Other long-term liabilities (in millions):
                                                                                                                   Sep 27, 2009   Sep 28, 2008

     Deferred rent . . . . . . . . . . . . . . . . . . . . . . . . . . . . . . . . . . . . . . . . . . . . .         $266.0         $303.9
     Unrecognized tax benefits . . . . . . . . . . . . . . . . . . . . . . . . . . . . . . . . . . . .                 55.1           60.4
     Asset retirement obligations . . . . . . . . . . . . . . . . . . . . . . . . . . . . . . . . . .                  43.4           44.6
     Minority interest . . . . . . . . . . . . . . . . . . . . . . . . . . . . . . . . . . . . . . . . . . .           11.2           18.3
     Other . . . . . . . . . . . . . . . . . . . . . . . . . . . . . . . . . . . . . . . . . . . . . . . . . . .       25.1           15.2
     Total . . . . . . . . . . . . . . . . . . . . . . . . . . . . . . . . . . . . . . . . . . . . . . . . . . .     $400.8         $442.4

Deferred rent liabilities represent amounts for tenant improvement allowances, rent escalation clauses and rent
holidays related to certain operating leases. The Company amortizes deferred rent over the terms of the leases as
reductions to rent expense on the consolidated statements of earnings. Unrecognized tax benefits represent the
estimated long-term portion of the Company’s gross unrecognized tax benefits including interest. See Notes 1 and
15 for additional information. Asset retirement obligations represent the estimated fair value of the Company’s

                                                                            63
future costs of removing leasehold improvements at the termination of leases for certain stores and administrative
facilities. Minority interest represents the collective ownership interests of minority shareholders for operations
accounted for under the consolidation method, in which Starbucks owns less than 100% of the equity interest. The
other remaining long-term liabilities generally include obligations to be settled or paid for one year beyond each
period presented, for items such as hedging instruments and the long-term portion of capital lease obligations.


Note 12:      Leases

In the fourth quarter of fiscal 2009 Starbucks determined that there was an immaterial classification error in the
lease footnote of the 2008 10-K. Amounts of $25.7 million and $22.7 million for the fiscal years ended
September 28, 2008 and September 30, 2007, respectively, were incorrectly classified as contingent rent that
should have been classified as minimum rentals. The total for rent expense under operating leases was not impacted.
The following table reflects the corrected amounts for fiscal 2008 and 2007.

Rental expense under operating lease agreements (in millions):
     Fiscal Year Ended                                                                         Sep 27, 2009      Sep 28, 2008        Sep 30, 2007

     Minimum rentals . . . . . . . . . . . . . . . . . . . . . . . . . . . . . . . .             $690.0             $709.1              $609.9
     Contingent rentals . . . . . . . . . . . . . . . . . . . . . . . . . . . . . . .              24.7               32.0                28.2
     Total . . . . . . . . . . . . . . . . . . . . . . . . . . . . . . . . . . . . . . . . .     $714.7             $741.1             $638.1

Minimum future rental payments under noncancelable operating leases as of September 27, 2009 (in millions):
     Fiscal Year Ending

     2010 . . . . . . . . . . . . . . . . . . . . .   . . . . . . . . . . . . . . . . . . . . . . . . . . . . . . . . . . . . . . . . . . . $ 706.7
     2011 . . . . . . . . . . . . . . . . . . . . .   ...........................................                                              669.0
     2012 . . . . . . . . . . . . . . . . . . . . .   ...........................................                                              612.3
     2013 . . . . . . . . . . . . . . . . . . . . .   ...........................................                                              551.0
     2014 . . . . . . . . . . . . . . . . . . . . .   ...........................................                                              488.1
     Thereafter . . . . . . . . . . . . . . . . .     ...........................................                                            1,362.1
     Total minimum lease payments . . . . . . . . . . . . . . . . . . . . . . . . . . . . . . . . . . . . . . . . . . . .               $4,389.2

The Company has subleases related to certain of its operating leases. During fiscal 2009, 2008 and 2007, the
Company recognized sublease income of $7.1 million, $3.5 million and $3.6 million, respectively.

The Company had capital lease obligations of $7.8 million and $6.7 million as of September 27, 2009 and
September 28, 2008, respectively. Capital lease obligations expire at various dates, with the latest maturity in 2015.
The current portion of the total obligation is included in Other accrued expenses and the remaining long-term
portion is included in Other long-term liabilities on the consolidated balance sheets. Assets held under capital leases
are included in Net property, plant and equipment on the consolidated balance sheets.

The Company had $76.2 million and $91.1 million in prepaid rent included in Prepaid expenses and other current
assets on the consolidated balance sheets as of September 27, 2009 and September 28, 2008, respectively.


Note 13:      Shareholders’ Equity

In addition to 1.2 billion shares of authorized common stock with $0.001 par value per share, the Company has
authorized 7.5 million shares of preferred stock, none of which was outstanding at September 27, 2009.

                                                                            64
Share repurchase activity was as follows (in millions, except for average price data):
     Fiscal Year Ending                                                                                  Sep 27, 2009   Sep 28, 2008

     Number of shares acquired . . . . . . . . . . . . . . . . . . . . . . . . . . . . . . . . . . .         —              12.2
     Average price per share of acquired shares. . . . . . . . . . . . . . . . . . . . . . . .               —            $24.12
     Total accrual-based cost of acquired shares . . . . . . . . . . . . . . . . . . . . . . .               —            $295.3
     Total cash-based cost of acquired shares . . . . . . . . . . . . . . . . . . . . . . . . .              —            $311.4

The difference between the accrual-based and cash-based cost of acquired shares represents the effect of the net
change in unsettled trades from the prior fiscal year end.

As of September 27, 2009, 6.3 million shares remained available for repurchase under current authorizations.

Comprehensive Income

Comprehensive income includes all changes in equity during the period, except those resulting from transactions
with shareholders of the Company. It has two components: net earnings and other comprehensive income.
Accumulated other comprehensive income reported on the Company’s consolidated balance sheets consists of
foreign currency translation adjustments and the unrealized gains and losses, net of applicable taxes, on
available-for-sale securities and on derivative instruments designated and qualifying as cash flow and net
investment hedges.

Comprehensive income, net of related tax effects (in millions):
     Fiscal Year Ended                                                                    Sep 27, 2009   Sep 28, 2008   Sep 30, 2007

     Net earnings . . . . . . . . . . . . . . . . . . . . . . . . . . . . . . . . . . .     $390.8         $315.5         $672.6
       Unrealized holding gains/(losses) on available-for-sale
          securities, net of tax (provision)/benefit of $(1.9),
          $2.4, and ($0.2) in 2009, 2008 and 2007,
          respectively . . . . . . . . . . . . . . . . . . . . . . . . . . . . . . . .          3.3           (4.0)           0.3
       Unrealized holding gains/(losses) on cash flow hedging
          instruments, net of tax (provision)/benefit of $(2.4),
          ($0.4) and $7.5 in 2009, 2008 and 2007,
          respectively . . . . . . . . . . . . . . . . . . . . . . . . . . . . . . . .          4.0            0.7          (12.8)
       Unrealized holding losses on net investment hedging
          instruments, net of tax benefit of $4.0, $0.6 and $5.2
          in 2009, 2008 and 2007, respectively . . . . . . . . . . . . .                       (6.8)          (0.9)          (8.8)
       Reclassification adjustment for net losses realized in net
          earnings for cash flow hedges, net of tax benefit of
          $0.8, $3.0 and $0.5 in 2009, 2008 and 2007,
          respectively . . . . . . . . . . . . . . . . . . . . . . . . . . . . . . . .          1.3            5.0            0.9
     Net unrealized gain/(loss) . . . . . . . . . . . . . . . . . . . . . . . . .               1.8            0.8          (20.4)
     Translation adjustment, net of tax benefit of $6.0, $0.3 and
       $— in 2009, 2008, and 2007, respectively. . . . . . . . . . . .                        15.2            (7.0)         37.7
     Total comprehensive income . . . . . . . . . . . . . . . . . . . . . . .               $407.8         $309.3         $689.9

The favorable translation adjustment change during fiscal 2009 of $15.2 million was primarily due to the weakening
of the US dollar against the Japanese yen, Australian dollar and the euro. The unfavorable translation adjustment
change during fiscal 2008 of $7.0 million was primarily due to the strengthening of the US dollar against several
currencies including the Australian dollar, Korean won and Canadian dollar. The favorable translation adjustment
change during fiscal 2007 of $37.7 million was primarily due to the weakening of the US dollar against several
currencies including the euro, Canadian dollar and British pound.

                                                                        65
Components of Accumulated other comprehensive income, net of tax (in millions):
     Fiscal Year Ended                                                                                     Sep 27, 2009   Sep 28, 2008

     Net unrealized losses on available-for-sale securities . . . . . . . . . . . . . . . .                  $ (0.8)        $ (4.1)
     Net unrealized losses on hedging instruments. . . . . . . . . . . . . . . . . . . . . .                  (23.7)         (22.2)
     Translation adjustment . . . . . . . . . . . . . . . . . . . . . . . . . . . . . . . . . . . . . .        89.9           74.7
     Accumulated other comprehensive income . . . . . . . . . . . . . . . . . . . . . . . .                  $ 65.4         $ 48.4

As of September 27, 2009, the translation adjustment of $89.9 million was net of tax provisions of $1.0 million. As
of September 28, 2008, the translation adjustment of $74.7 million was net of tax provisions of $7.0 million.

Note 14:      Employee Stock and Benefit Plans
The Company maintains several equity incentive plans under which it may grant non-qualified stock options,
incentive stock options, restricted stock, RSUs, or stock appreciation rights to employees, non-employee directors
and consultants. The Company issues new shares of common stock upon exercise of stock options and the vesting of
RSUs. The Company also has employee stock purchase plans (“ESPP”).
As of September 27, 2009, there were 38.2 million shares of common stock available for issuance pursuant to future
equity-based compensation awards and 9.8 million shares available for issuance under its ESPP plans.
Total stock based compensation and ESPP expense recognized in the consolidated financial statements
(in millions):
     Fiscal Year Ended                                                                      Sep 27, 2009   Sep 28, 2008   Sep 30, 2007

        Stock option expense . . . . . . . . . . . . . . . . . . . . . . . . . . .            $61.6          $57.6          $ 92.3
        RSU expense . . . . . . . . . . . . . . . . . . . . . . . . . . . . . . . . .          16.6            5.6             —
        ESPP expense . . . . . . . . . . . . . . . . . . . . . . . . . . . . . . . .            5.0           11.8            11.6
     Total stock-based compensation expense on the
       consolidated statements of earnings . . . . . . . . . . . . . . . .                    $83.2          $75.0          $103.9
     Total related tax benefit . . . . . . . . . . . . . . . . . . . . . . . . . . .          $29.3          $24.0          $ 35.3
     Stock-based compensation capitalized in the respective
       fiscal year, as included in Net property, plant and
       equipment and inventories on the consolidated balance
       sheets . . . . . . . . . . . . . . . . . . . . . . . . . . . . . . . . . . . . . .     $ 1.3          $ 1.9          $ 2.5

Stock Option Plans
Stock options to purchase the Company’s common stock are granted at the fair market value of the stock on the date
of grant. The majority of options become exercisable in four equal installments beginning a year from the date of
grant and generally expire 10 years from the date of grant, except for options granted in the exchange program,
described below, which have a seven year life. Options granted to non-employee directors generally vest over one to
three years. Nearly all outstanding stock options are non-qualified stock options.
The fair value of each stock option granted is estimated on the grant date using the Black-Scholes-Merton (“BSM”)
option valuation model. The assumptions used to calculate the fair value of options granted are evaluated and
revised, as necessary, to reflect market conditions and the Company’s experience. Options granted are valued using
the multiple option valuation approach, and the resulting expense is recognized over the requisite service period for
each separately vesting portion of the award. Compensation expense is recognized only for those options expected
to vest, with forfeitures estimated at the date of grant based on the Company’s historical experience and future
expectations.
On March 18, 2009, Starbucks shareholders approved a proposal to allow for a one-time stock option exchange
program, designed to provide eligible employees an opportunity to exchange certain outstanding underwater stock

                                                                          66
options for a lesser amount of new options to be granted with lower exercise prices. Stock options eligible for
exchange were those with an exercise price per share greater than $19.00 that were granted prior to December 1,
2007 under the Company’s Amended and Restated 2005 Long-Term Equity Incentive Plan (the “2005 Plan”), the
Amended and Restated Key Employee Stock Option Plan-1994 or the 1991 Company-Wide Stock Option Plan. On
May 1, 2009 Starbucks commenced the option exchange program, which expired on May 29, 2009. A total of
14.3 million eligible stock options were tendered by employees, representing 65% of the total stock options eligible
for exchange. On June 1, 2009, the Company granted an aggregate of 4.7 million new stock options in exchange for
the eligible stock options surrendered. The exercise price of the new stock options was $14.92, which was the
closing price of Starbucks common stock on June 1, 2009. The new stock options were granted under the 2005 Plan.
No incremental stock option expense was recognized for the exchange because the fair value of the new options,
using standard employee stock option valuation techniques, was approximately equal to the fair value of the
surrendered options they replaced.
The fair value of stock option awards and ESPP shares was estimated at the grant date with the following weighted
average assumptions for the fiscal years ended September 27, 2009, September 28, 2008 and September 30, 2007
(excludes options granted in the 2009 stock option exchange program described above):
                                     Employee Stock Options
                                    Granted During the Period                             ESPP
Fiscal Year Ended                  2009      2008        2007           2009              2008                 2007

Expected term (in years) . . . .            4.9     4.7    4.7     0.25 - 0.5            0.25 - 0.5           0.25 - 0.5
Expected stock price
  volatility . . . . . . . . . . . . . . 44.5%     29.3%  28.9%   37% - 64%            26% - 44%             28% - 31%
Risk-free interest rate . . . . . .         2.2%    3.4%   4.6% 0.2% - 1.7%           1.3% - 4.5%           4.7% - 5.1%
Expected dividend yield . . . . .           0.0%    0.0%   0.0%        0.0%                  0.0%                  0.0%
Weighted average grant
  price . . . . . . . . . . . . . . . . . $8.97  $22.11 $36.04  $      10.92         $        14.52     $         24.59
Estimated fair value per
  option granted . . . . . . . . . . $3.61       $ 6.85 $11.72  $       2.67         $           4.00   $             6.03
The expected term of the options represents the estimated period of time until exercise and is based on historical
experience of similar awards, giving consideration to the contractual terms, vesting schedules and expectations of
future employee behavior. Expected stock price volatility is based on a combination of historical volatility of the
Company’s stock and the one-year implied volatility of its traded options, for the related vesting periods. The risk-
free interest rate is based on the implied yield available on US Treasury zero-coupon issues with an equivalent
remaining term. As the Company does not pay dividends, the dividend yield is 0%. The amounts shown above for
the estimated fair value per option granted are before the estimated effect of forfeitures, which reduce the amount of
expense recorded on the consolidated statement of earnings.
The BSM option valuation model was developed for use in estimating the fair value of traded options, which have
no vesting restrictions and are fully transferable. The Company’s employee stock options have characteristics
significantly different from those of traded options, and changes in the subjective input assumptions can materially
affect the fair value estimate. Because Starbucks stock options do not trade on a secondary exchange, employees do
not derive a benefit from holding stock options unless there is an increase, above the grant price, in the market price
of the Company’s stock. Such an increase in stock price would benefit all shareholders commensurately.


                                                          67
Stock option transactions from October 1, 2006, through September 27, 2009 (in millions, except per share and
contractual life amounts):

                                                                                                       Weighted     Weighted
                                                                                                        Average      Average
                                                                                           Shares       Exercise   Remaining      Aggregate
                                                                                          Subject to     Price     Contractual     Intrinsic
                                                                                           Options     per Share   Life (Years)     Value

Outstanding, October 1, 2006 .              .......................                          69.4       16.83          6.2        1,196.2
  Granted . . . . . . . . . . . . . . . .   .......................                          12.3       36.04
  Exercised . . . . . . . . . . . . . .     .......................                         (12.7)      10.23
  Expired/forfeited . . . . . . . . .       .......................                          (3.5)      30.92
Outstanding, September 30, 2007 . . . . . . . . . . . . . . . . . . . . . .                  65.5       20.97          6.2          507.5
  Granted . . . . . . . . . . . . . . . . . . . . . . . . . . . . . . . . . . . . . . .      15.4       22.11
  Exercised . . . . . . . . . . . . . . . . . . . . . . . . . . . . . . . . . . . . .        (6.6)      10.71
  Expired/forfeited . . . . . . . . . . . . . . . . . . . . . . . . . . . . . . . .         (11.3)      28.49
Outstanding, September 28, 2008 . . . . . . . . . . . . . . . . . . . . . .                  63.0       20.96          5.7          114.9
  Granted . . . . . . . . . . . . . . . . . . . . . . . . . . . . . . . . . . . . . . .      30.9        8.97
  Granted under option exchange program. . . . . . . . . . . . . . .                          4.7       14.92
  Exercised . . . . . . . . . . . . . . . . . . . . . . . . . . . . . . . . . . . . .        (7.2)       7.31
  Expired/forfeited . . . . . . . . . . . . . . . . . . . . . . . . . . . . . . . .         (13.5)      18.99
  Cancelled under option exchange program . . . . . . . . . . . . .                         (14.3)      29.34
Outstanding, September 27, 2009 . . . . . . . . . . . . . . . . . . . . . .                 63.6        14.75          6.7          442.4
Exercisable, September 27, 2009 . . . . . . . . . . . . . . . . . . . . . .                 27.5        17.69          4.1          142.1
Vested and expected to vest, September 27, 2009 . . . . . . . . . .                         57.8        15.12          6.5          388.6

The aggregate intrinsic value in the table above is the amount by which the market value of the underlying stock
exceeded the exercise price of outstanding options, is before applicable income taxes and represents the amount
optionees would have realized if all in-the-money options had been exercised on the last business day of the period
indicated. The closing per share market value of the Company’s stock on September 25, 2009 was $19.83.

As of September 27, 2009, total unrecognized stock-based compensation expense, net of estimated forfeitures,
related to nonvested stock options was approximately $68 million, before income taxes, and is expected to be
recognized over a weighted average period of approximately 2.7 years. The total intrinsic value of stock options
exercised was $44 million, $50 million and $274 million during the three fiscal years ended September 27, 2009.
The total fair value of options vested was $75 million, $99 million and $28 million during fiscal years 2009, 2008
and 2007, respectively.


RSUs

The Company has both time-vested and performance-based RSUs. Time-vested RSUs are awarded to eligible
employees and entitle the grantee to receive shares of common stock at the end of a vesting period, subject solely to
the employee’s continuing employment. The Company’s performance-based RSUs are awarded to eligible
employees and entitle the grantee to receive shares of common stock if the Company achieves specified
performance goals for the full fiscal year in the year of award and the grantee remains employed during the
subsequent vesting period. The fair value of RSUs is based on the closing price of Starbucks common stock on the
award date. Expense for performance-based RSUs is recognized when it is probable the performance goal will be
achieved.

                                                                           68
Summary of all RSU transactions from October 1, 2006 through September 27, 2009 (in millions, except per share
and contractual life amounts):
                                                                                            Weighted          Weighted
                                                                                            Average            Average
                                                                                  Number   Grant Date        Remaining       Aggregate
                                                                                    of     Fair Value        Contractual      Intrinsic
                                                                                  Shares   per Share         Life (Years)      Value

     Nonvested, October 1, 2006, . . . . . . . . . . . . . . . . . .                —       $      —               —          $ —
       Granted . . . . . . . . . . . . . . . . . . . . . . . . . . . . . . . .      0.2         27.83
       Vested . . . . . . . . . . . . . . . . . . . . . . . . . . . . . . . . .     —              —
       Forfeited/Cancelled . . . . . . . . . . . . . . . . . . . . . . .            —              —
     Nonvested, September 30, 2007 . . . . . . . . . . . . . . . .                  0.2         27.83              3.0           4.7
       Granted . . . . . . . . . . . . . . . . . . . . . . . . . . . . . . . .      2.0         16.43
       Vested . . . . . . . . . . . . . . . . . . . . . . . . . . . . . . . . .      —             —
       Forfeited/Cancelled . . . . . . . . . . . . . . . . . . . . . . .           (0.2)        17.27
     Nonvested, September 28, 2008 . . . . . . . . . . . . . . . .                  2.0      17.36                 2.5          30.5
       Granted . . . . . . . . . . . . . . . . . . . . . . . . . . . . . . . .      3.3       8.78
       Vested . . . . . . . . . . . . . . . . . . . . . . . . . . . . . . . . .      —          —
       Forfeited/Cancelled . . . . . . . . . . . . . . . . . . . . . . .           (0.9)     13.94
     Nonvested, September 27, 2009 . . . . . . . . . . . . . . . .                  4.4      11.55                 1.6          88.2

As of September 27, 2009, total unrecognized stock-based compensation expense related to nonvested RSUs, net of
estimated forfeitures, was approximately $23 million, before income taxes, which is expected to be recognized over
a weighted average period of approximately 2.4 years.

ESPP
The Company’s ESPP allows eligible employees to contribute up to 10% of their base earnings toward the quarterly
purchase of the Company’s common stock, subject to an annual maximum dollar amount. The ESPP for US
employees was amended in March 2009 to change the employees’ purchase price to 95% of the fair market value of
the stock on the last business day of the quarterly offering period. Prior to the amendment, the employees’ purchase
price was 85% of the lesser of the fair market value of the stock on the first or last business day of the quarterly
offering period.
Summary of transactions under this ESPP from fiscal year 2007 through 2009 (shares in millions):
                                                                                                                             Average
                                                                                                                             Price Per
                                                                                                                    Shares    Share

     Issued during fiscal year 2007. . . . . . . . . . . . . . . . . . . . . . . . . . . . . . . . . . . .   ...      1.9      24.59
     Issued during fiscal year 2008. . . . . . . . . . . . . . . . . . . . . . . . . . . . . . . . . . . .   ...      2.9      14.52
     Issued during fiscal year 2009. . . . . . . . . . . . . . . . . . . . . . . . . . . . . . . . . . . .   ...      2.5      10.92
     Total number of shares issuable under the plan . . . . . . . . . . . . . . . . . . . . . . .            ...     32.0
     Total number of shares issued since inception . . . . . . . . . . . . . . . . . . . . . . . .           ...     23.5
     Shares available for future issuance. . . . . . . . . . . . . . . . . . . . . . . . . . . . . . . .     ...      8.5
Starbucks has an additional employee stock purchase plan in the UK, which allows eligible UK employees to
purchase shares of common stock through payroll deductions during six-month offering periods at the lesser of the
fair market value of the stock at the beginning or at the end of the offering period. The Company awards one
matching share for each six shares purchased under the plan. The Company did not initiate a new offering period at
the conclusion of the six-month offering period that ended April 30, 2009, and does not plan to reactivate plan

                                                                          69
offerings in the immediate future. The total number of shares issuable under the plan is 1.4 million. As of
September 27, 2009, 1.3 million shares were available for future issuance.

Deferred Stock Plan
Starbucks has a deferred stock plan for certain key employees that enables participants in the plan to defer receipt of
ownership of common shares from the exercise of nonqualified stock options. The minimum deferral period is five
years. As of September 27, 2009, receipt of 3.4 million shares was deferred under the terms of this plan. The rights
to receive these shares, represented by common stock units, are included in the calculation of basic and diluted
earnings per share as common stock equivalents. No new initial deferrals are permitted under this plan; the plan
permits re-deferrals of previously deferred shares.

Defined Contribution Plans
Starbucks maintains voluntary defined contribution plans, both qualified and non-qualified, covering eligible
employees as defined in the plan documents. Participating employees may elect to defer and contribute a portion of
their eligible compensation to the plans up to limits stated in the plan documents, not to exceed the dollar amounts
set by applicable laws. Effective beginning in plan year 2009, the Company changed to a fully discretionary
matching contribution, from one based on a fixed schedule tied to participant contribution percentage and
employment tenure.
The Company’s matching contributions to all US and non-US plans were $19.7 million, $25.3 million and
$20.1 million in fiscal years 2009, 2008 and 2007, respectively.

Note 15:      Income Taxes
Provision for income taxes (in millions):
     Fiscal Year Ended                                                                         Sep 27, 2009   Sep 28, 2008   Sep 30, 2007

     Current taxes:
       Federal . . . . . . . . . . . . . . . . . . . . . . . . . . . . . . .     ......          $165.3        $ 180.4         $326.7
       State . . . . . . . . . . . . . . . . . . . . . . . . . . . . . . . . .   ......            35.0           34.3           65.3
       Foreign . . . . . . . . . . . . . . . . . . . . . . . . . . . . . . .     ......            26.3           40.4           31.2
     Deferred taxes, net. . . . . . . . . . . . . . . . . . . . . . . . .        ......           (58.2)        (111.1)         (39.5)
     Total . . . . . . . . . . . . . . . . . . . . . . . . . . . . . . . . . . . . . . . . .     $168.4        $ 144.0         $383.7

Reconciliation of the statutory federal income tax rate with the Company’s effective income tax rate:
     Fiscal Year Ended                                                                         Sep 27, 2009   Sep 28, 2008   Sep 30, 2007

     Statutory rate. . . . . . . . . . . . . . . . . . . . . . . . . . . . . . . . . . .          35.0%          35.0%          35.0%
     State income taxes, net of federal income tax benefit . . . . .                               2.6            2.8            3.4
     Foreign earnings taxed at lower rates . . . . . . . . . . . . . . . . .                      (2.3)          (3.6)          (1.1)
     Domestic production activity deduction . . . . . . . . . . . . . . .                         (2.3)          (2.6)          (0.5)
     Credit resulting from employment audit . . . . . . . . . . . . . . .                         (2.0)            —              —
     Other, net . . . . . . . . . . . . . . . . . . . . . . . . . . . . . . . . . . . . .         (0.9)          (0.3)          (0.5)
     Effective tax rate . . . . . . . . . . . . . . . . . . . . . . . . . . . . . . . .           30.1%          31.3%          36.3%

US income and foreign withholding taxes have not been provided on approximately $520 million of cumulative
undistributed earnings of foreign subsidiaries and equity investees. The Company intends to reinvest these earnings
for the foreseeable future. If these amounts were distributed to the US, in the form of dividends or otherwise, the
Company would be subject to additional US income taxes. Determination of the amount of unrecognized deferred
income tax liabilities on these earnings is not practicable because such liability, if any, is dependent on circum-
stances existing if and when remittance occurs.

                                                                            70
Tax effect of temporary differences and carryforwards that comprise significant portions of deferred tax assets and
liabilities (in millions):
                                                                                                                    Sep 27, 2009   Sep 28, 2008

     Deferred tax assets:
       Accrued occupancy costs . . . . . . . . . . . . . . . . . . . . . . . . . . . . . . . . . . .                  $ 51.5         $ 54.8
       Accrued compensation and related costs. . . . . . . . . . . . . . . . . . . . . . . .                            70.1           56.2
       Other accrued expenses . . . . . . . . . . . . . . . . . . . . . . . . . . . . . . . . . . . .                   24.5           25.2
       Asset retirement obligation asset . . . . . . . . . . . . . . . . . . . . . . . . . . . . .                      13.9           13.3
       Deferred revenue . . . . . . . . . . . . . . . . . . . . . . . . . . . . . . . . . . . . . . . . .               39.3           36.0
       Asset impairments . . . . . . . . . . . . . . . . . . . . . . . . . . . . . . . . . . . . . . . .                99.7           80.8
       Tax credits . . . . . . . . . . . . . . . . . . . . . . . . . . . . . . . . . . . . . . . . . . . . .            61.4           26.1
       Stock based compensation . . . . . . . . . . . . . . . . . . . . . . . . . . . . . . . . . .                     96.6           79.6
       Other . . . . . . . . . . . . . . . . . . . . . . . . . . . . . . . . . . . . . . . . . . . . . . . . .          56.1           49.6
        Total . . . . . . . . . . . . . . . . . . . . . . . . . . . . . . . . . . . . . . . . . . . . . . . . . .      513.1          421.6
        Valuation allowance . . . . . . . . . . . . . . . . . . . . . . . . . . . . . . . . . . . . . .                (20.3)         (20.0)
     Total deferred tax asset, net of valuation allowance . . . . . . . . . . . . . . . . .                            492.8          401.6
     Deferred tax liabilities:
       Property, plant and equipment . . . . . . . . . . . . . . . . . . . . . . . . . . . . . . .                      (45.6)         (18.1)
       Other . . . . . . . . . . . . . . . . . . . . . . . . . . . . . . . . . . . . . . . . . . . . . . . . .          (25.4)         (21.4)
        Total . . . . . . . . . . . . . . . . . . . . . . . . . . . . . . . . . . . . . . . . . . . . . . . . . .       (71.0)         (39.5)
     Net deferred tax asset . . . . . . . . . . . . . . . . . . . . . . . . . . . . . . . . . . . . . . .             $421.8         $362.1
     Reported as:
       Current deferred income tax asset . . . . . . . . . . . . . . . . . . . . . . . . . . . .                      $286.6         $234.2
       Long-term deferred income tax asset (included in Other assets) . . . . . .                                      135.2          127.9
     Net deferred tax asset . . . . . . . . . . . . . . . . . . . . . . . . . . . . . . . . . . . . . . .             $421.8         $362.1

The Company will establish a valuation allowance if either it is more likely than not that the deferred tax asset will
expire before the Company is able to realize their benefits, or the future deductibility is uncertain. Periodically, the
valuation allowance is reviewed and adjusted based on management’s assessments of realizable deferred tax assets.
The valuation allowance as of September 27, 2009 and September 28, 2008 was related to net operating losses of
consolidated foreign subsidiaries. The net change in the total valuation allowance for the years ended September 27,
2009, and September 28, 2008, was an increase of $0.3 million and $6.3 million, respectively.
As of September 27, 2009, the Company has foreign tax credit carryforwards of $38.5 million with expiration dates
between fiscal years 2013 and 2019. As of the end of fiscal 2009, the Company also has capital loss carryforwards of
$1.1 million with expiration dates between fiscal years 2010 and 2014.
Taxes currently payable of $57.2 million and $14.8 million are included in Accrued taxes on the consolidated
balance sheets as of September 27, 2009 and September 28, 2008, respectively.

Uncertain Tax Positions
As described in Note 1, on October 1, 2007, the first day of the Company’s fiscal 2008, Starbucks adopted new
accounting requirements for uncertain tax positions. The cumulative effects of the related changes were recorded as
a decrease of $1.7 million and $1.6 million, respectively, to the Company’s fiscal 2008 opening balances of retained
earnings and additional paid-in capital. The Company also recorded an increase of $28.5 million to current income
tax assets, an increase of $12.2 million to long-term income tax assets, a decrease of $24.6 million to current tax
liabilities and an increase of $68.6 million to long-term tax liabilities.

                                                                            71
As of September 27, 2009, the Company had $49.1 million of gross unrecognized tax benefits of which
$25.4 million, if recognized, would affect the effective tax rate. The Company recognizes interest and penalties
related to income tax matters in income tax expense. As of September 27, 2009 and September 28, 2008, the
Company had accrued interest and penalties of $9.9 million and $9.1 million, respectively, before benefit of federal
tax deduction, recorded on its consolidated balance sheets.
The following table summarizes the activity related to the Company’s unrecognized tax benefits from October 1,
2007 to September 27, 2009 (in millions):
                                                                                                              Sep 27, 2009   Sep 28, 2008

     Beginning balance . . . . . . . . . . . . . . . . . . . . . . . . . . . . . . . . . . . . . . . . .        $ 52.6         $ 58.3
     Increase related to prior year tax positions . . . . . . . . . . . . . . . . . . . . . . . .                  4.2           64.9
     Decrease related to prior year tax positions . . . . . . . . . . . . . . . . . . . . . . .                  (11.6)         (37.2)
     Increase related to current year tax positions . . . . . . . . . . . . . . . . . . . . . .                    8.4           17.0
     Decrease related to current year tax positions. . . . . . . . . . . . . . . . . . . . . .                    (0.9)          (5.4)
     Decreases related to settlements with taxing authorities . . . . . . . . . . . . . .                         (3.0)         (11.1)
     Decreases related to lapsing of statute of limitations . . . . . . . . . . . . . . . .                       (0.6)         (33.9)
     Ending balance . . . . . . . . . . . . . . . . . . . . . . . . . . . . . . . . . . . . . . . . . . . .     $ 49.1         $ 52.6

Starbucks is currently under routine audit by various jurisdictions outside the US as well as US state taxing
jurisdictions for fiscal years 2003 through 2008. The Company is no longer subject to US federal or state
examination for years before fiscal year 2005, with the exception of three states. The Company is subject to income
tax in many jurisdictions outside the US, none of which are individually material to the consolidated financial
statements.
There is a reasonable possibility that the unrecognized tax benefits will change within the next 12 months, but the
Company does not expect this change to be material to the consolidated financial statements.

Note 16:     Earnings per Share
Calculation of net earnings per common share (“EPS”) — basic and diluted (in millions, except EPS):
     Fiscal Year Ended                                                                     Sep 27, 2009       Sep 28, 2008   Sep 30, 2007

     Net earnings . . . . . . . . . . . . . . . . . . . . . . . . . . . . . . . . . . .      $390.8             $315.5         $672.6
       Weighted average common shares and common stock
          units outstanding (for basic calculation) . . . . . . . . . . .                      738.7             731.5          749.8
       Dilutive effect of outstanding common stock options and
          RSUs . . . . . . . . . . . . . . . . . . . . . . . . . . . . . . . . . . . . .          7.2             10.2           20.3
        Weighted average common and common equivalent
         shares outstanding (for diluted calculation) . . . . . . . . .                        745.9             741.7          770.1
     EPS — basic . . . . . . . . . . . . . . . . . . . . . . . . . . . . . . . . . . .       $ 0.53             $ 0.43         $ 0.90
     EPS — diluted . . . . . . . . . . . . . . . . . . . . . . . . . . . . . . . . . .       $ 0.52             $ 0.43         $ 0.87
Potential dilutive shares consist of the incremental common shares issuable upon the exercise of outstanding stock
options (both vested and non-vested) and unvested RSUs, using the treasury stock method. Potential dilutive shares
are excluded from the computation of earnings per share if their effect is antidilutive. The number of antidilutive
options totaled 16.6 million, 40.4 million and 10.4 million, in fiscal years 2009, 2008 and 2007, respectively.

Note 17:     Commitments and Contingencies
Guarantees
The Company has unconditionally guaranteed the repayment of certain Japanese yen-denominated bank loans and
related interest and fees of an unconsolidated equity investee, Starbucks Japan. The guarantees continue until the

                                                                         72
loans, including accrued interest and fees, have been paid in full. The Company’s maximum exposure under this
commitment is disclosed in the table below and is limited to the sum of unpaid principal and interest, as well as other
related expenses. These amounts will vary based on fluctuations in the yen foreign exchange rate.
Starbucks has commitments under which it unconditionally guarantees its proportionate share of certain borrowings
of unconsolidated equity investees. The Company’s maximum exposure under these commitments disclosed in the
table below excludes interest and other related costs. The fair value of these guarantees is included in Equity and
cost investments and Other accrued expenses on the consolidated balance sheets.
The following table presents information on unconditional guarantees as of September 27, 2009 (in millions):
                                                                                                    Estimated Fair Value
                                                                        Maximum    Year Guarantee       Recorded on
                                                                        Exposure     Expires in         Balance Sheet

Japanese yen-denominated bank loans . . . . . . . . . . . . . . . . .    $ 2.9             2014            $ —(1)
Borrowings of other unconsolidated equity investees . . . . . . .        $17.9     2009 to 2012            $3.7

(1)
      Since there has been no modification of these loan guarantees subsequent to the Company’s adoption of
      accounting requirements for guarantees, Starbucks has applied the disclosure provisions only and has not
      recorded the guarantees on its consolidated balance sheets.

Legal Proceedings
On October 8, 2004, a former hourly employee of the Company filed a lawsuit in San Diego County Superior Court
entitled Jou Chau v. Starbucks Coffee Company. The lawsuit alleged that the Company violated the California Labor
Code by allowing shift supervisors to receive tips. More specifically, the lawsuit alleged that since shift supervisors
direct the work of baristas, they qualify as “agents” of the Company and are therefore excluded from receiving tips
under California Labor Code Section 351, which prohibits employers and their agents from collecting or receiving
tips left by patrons for other employees. The lawsuit further alleges that because the tipping practices violated the
Labor Code, they were unfair practices under the California Unfair Competition Law. On February 28, 2008, the
trial court ruled against the Company in the liability phase of the trial and on March 20, 2008 the court ordered the
Company to pay approximately $87 million in restitution, plus interest. The Company appealed the decision of the
trial court and on June 2, 2009 the California Court of Appeal reversed the trial court’s judgment in its entirety and
ruled in favor of Starbucks. The Court of Appeal denied plaintiffs’ petition for rehearing and reaffirmed its ruling on
July 2, 2009. The plaintiffs filed a petition for review with the California Supreme Court on July 13, 2009. The
California Supreme Court denied plaintiffs’ petition for review. The trial court has been ordered to enter judgment
for Starbucks and dismiss the case.
On June 30, 2005, three individuals, Erik Lords, Hon Yeung, and Donald Brown filed a lawsuit in Orange County
Superior Court, California. The lawsuit alleged that the Company violated the California Labor Code section 432.8
by asking job applicants to disclose at the time of application convictions for marijuana related offenses more than
two years old. The California Court of Appeal issued a ruling on December 10, 2008 instructing the trial judge to
enter summary judgment against plaintiffs and the California Supreme Court has rejected the plaintiffs’ appeal. The
matter is now back before the trial court awaiting final dismissal.
The Company is party to various other legal proceedings arising in the ordinary course of its business, but it is not
currently a party to any legal proceeding that management believes would have a material adverse effect on the
consolidated financial position or results of operations of the Company.

Note 18:     Segment Reporting
Segment information is prepared on the same basis that the Company’s management reviews financial information
for operational decision making purposes. Starbucks has three reportable operating segments: US, International and
CPG. In the fourth fiscal quarter of 2009, the Company changed the composition of its reportable segments. The US
foodservice business, which was previously reported in the US segment, is now reported in the CPG segment, as a

                                                             73
result of internal management realignments within the US and CPG businesses. Segment information for all prior
periods presented has been revised to reflect this change.


United States

The Company’s US operations represent 80% of total Company-operated retail revenues, 33% of total specialty
revenues and 73% of total net revenues for fiscal year 2009. US operations sell coffee and other beverages,
complementary food, whole bean coffees, and coffee brewing equipment and merchandise primarily through
Company-operated retail stores. Specialty operations within the US include licensed retail stores, and other
initiatives related to the Company’s core business.


International

The Company’s International operations represent the remaining 20% of Company-operated retail revenues and
20% of total specialty revenues as well as 19% of total net revenues for fiscal year 2009. International operations
sell coffee and other beverages, complementary food, whole bean coffees, and coffee brewing equipment and
merchandise through Company-operated retail stores in the UK, Canada and several other markets. Specialty
operations in International primarily include retail store licensing operations in nearly 40 countries and foodservice
accounts, primarily in Canada and the UK. Many of the Company’s International operations are in early stages of
development that require a more extensive support organization, relative to the current levels of revenue and
operating income, than in the US.


Global Consumer Products Group

The Company’s CPG segment represents 47% of total specialty revenues and 8% of total net revenues for fiscal year
2009. CPG operations sell a selection of whole bean and ground coffees as well as a selection of premium Tazo»
teas through licensing arrangements in US and international markets. CPG operations also produce and sell
ready-to-drink beverages which include, among others, bottled Frappuccino» beverages, Starbucks DoubleShot»
espresso drinks, and Discoveries» chilled cup coffee, as well as Starbucks» super-premium ice creams through its
marketing and distribution agreements and joint ventures. The US foodservice business sells coffee and other
related products to institutional foodservice companies with the majority of its sales through national broadline
distribution networks.

Unallocated Corporate includes expenses pertaining to corporate administrative functions that support the oper-
ating segments but are not specifically attributable to or managed by any segment and are not included in the
reported financial results of the operating segments. These unallocated corporate expenses include certain general
and administrative expenses, related depreciation and amortization expenses, restructuring charges and amounts
included in Net interest income and other and Interest expense on the consolidated statements of earnings.

The Company’s revenue mix by product type was as follows (in millions):
Fiscal Year Ended                                                                  Sep 27, 2009          Sep 28, 2008          Sep 30, 2007

Beverage . . . . . . . . . . . . . . . . . . . . . . . . . . . . . . . .      $6,238.4            64% $ 6,663.3         64% $6,029.1          64%
Food. . . . . . . . . . . . . . . . . . . . . . . . . . . . . . . . . . . .    1,680.2            17%   1,511.7         15% 1,332.7           14%
Whole bean coffees. . . . . . . . . . . . . . . . . . . . . . . . .              965.2            10%     987.8          9%    913.1          10%
Other(1) . . . . . . . . . . . . . . . . . . . . . . . . . . . . . . . . .       890.8             9%   1,220.2         12% 1,136.6           12%
Total . . . . . . . . . . . . . . . . . . . . . . . . . . . . . . . . . . .   $9,774.6       100% $10,383.0         100% $9,411.5        100%

(1)
      Other includes royalty and licensing revenues, beverage-related accessories and equipment.

                                                                              74
The tables below represent information by geographic area (in millions):
Fiscal Year Ended                                                                                       Sep 27, 2009   Sep 28, 2008   Sep 30, 2007

Net revenues from external customers:
United States . . . . . . . . . . . . . . . . . . . . . . . . . . . . . . . . . . . . . . . . . .        $7,787.7      $ 8,227.0       $7,678.9
Other countries . . . . . . . . . . . . . . . . . . . . . . . . . . . . . . . . . . . . . . . .           1,986.9        2,156.0        1,732.6
Total . . . . . . . . . . . . . . . . . . . . . . . . . . . . . . . . . . . . . . . . . . . . . . . .    $9,774.6      $10,383.0       $9,411.5

No customer accounts for 10% or more of the Company’s revenues. Revenues are shown based on the geographic
location of the customers. Revenues from countries other than the US consist primarily of revenues from Canada
and the UK, which together account for approximately 66% of net revenues from other countries for fiscal 2009.
                                                                                                        Sep 27, 2009   Sep 28, 2008   Sep 30, 2007

Long-lived assets:
United States . . . . . . . . . . . . . . . . . . . . . . . . . . . . . . . . . . . . . . . . . .        $2,776.7       $3,099.9       $2,990.6
Other countries . . . . . . . . . . . . . . . . . . . . . . . . . . . . . . . . . . . . . . . .             764.3          824.8          667.9
Total . . . . . . . . . . . . . . . . . . . . . . . . . . . . . . . . . . . . . . . . . . . . . . . .    $3,541.0       $3,924.7       $3,658.5

Management evaluates the performance of its operating segments based on net revenues and operating income. The
accounting policies of the operating segments are the same as those described in the summary of significant
accounting policies in Note 1. Operating income represents earnings before Net interest income and other, Interest
expense and Income taxes. Management does not evaluate the performance of its operating segments using asset
measures. The identifiable assets by segment disclosed in this note are those assets specifically identifiable with
each segment and include net property, plant and equipment, equity and cost investments, goodwill, and other
intangible assets. Corporate assets are primarily comprised of cash and investments, assets of the corporate
headquarters and roasting facilities, and inventory. The methodology used to identify specific assets with the
segments in fiscal 2009 was applied to the fiscal 2008 and 2007 amounts disclosed below.


                                                                              75
The table below presents information by operating segment for the fiscal years noted (in millions):
                                                                                                                                                Unallocated
                                                                                                 United States   International     CPG          Corporate           Total
Fiscal 2009:
Net Revenues:
  Company-operated retail . . .            ................                                        $6,572.1       $1,608.0       $     —         $       —        $ 8,180.1
  Specialty:
     Licensing . . . . . . . . . . . .     .....     .   .   .   .   .   .   .   .   .   .   .        528.9           266.2          427.2               —          1,222.3
     Foodservice and other . . .           .....     .   .   .   .   .   .   .   .   .   .   .          3.6            46.2          322.4               —            372.2
       Total specialty . . . . . . .       .....     .   .   .   .   .   .   .   .   .   .   .        532.5           312.4          749.6               —          1,594.5
Total net revenues . . . . . . . . .       .....     .   .   .   .   .   .   .   .   .   .   .      7,104.6         1,920.4          749.6               —          9,774.6
Depreciation and amortization .            .....     .   .   .   .   .   .   .   .   .   .   .        378.1           102.5            5.7              48.4          534.7
Income from equity investees .             .....     .   .   .   .   .   .   .   .   .   .   .          0.5            53.6           67.8                —           121.9
Operating income/(loss) . . . . .          .....     .   .   .   .   .   .   .   .   .   .   .        531.8            92.9          296.3            (359.0)         562.0
Equity method investments . . .            .....     .   .   .   .   .   .   .   .   .   .   .           —            248.8           64.4               —            313.2
Total assets . . . . . . . . . . . . . .   .....     .   .   .   .   .   .   .   .   .   .   .      1,650.0         1,071.3          102.1           2,753.4        5,576.8
Net impairment and disposition             losses    .   .   .   .   .   .   .   .   .   .   .        120.8            45.9             —               57.7          224.4
Fiscal 2008:
Net Revenues:
  Company-operated retail . . . . . . . .            ...........                                   $6,997.7       $1,774.2       $     —         $       —        $ 8,771.9
  Specialty:
     Licensing . . . . . . . . . . . . . . . . .     .   .   .   .   .   .   .   .   .   .   .        504.2           274.8          392.6               —          1,171.6
     Foodservice and other . . . . . . . .           .   .   .   .   .   .   .   .   .   .   .         30.1            54.4          355.0               —            439.5
       Total specialty . . . . . . . . . . . .       .   .   .   .   .   .   .   .   .   .   .        534.3           329.2          747.6               —          1,611.1
Total net revenues . . . . . . . . . . . . . .       .   .   .   .   .   .   .   .   .   .   .      7,532.0         2,103.4          747.6               —         10,383.0
Depreciation and amortization . . . . . .            .   .   .   .   .   .   .   .   .   .   .        395.4           108.8            6.3              38.8          549.3
Income (loss) from equity investees . .              .   .   .   .   .   .   .   .   .   .   .         (1.3)           54.2           60.7                —           113.6
Operating income/(loss) . . . . . . . . . .          .   .   .   .   .   .   .   .   .   .   .        454.2           110.0          279.2            (339.5)         503.9
Equity method investments . . . . . . . .            .   .   .   .   .   .   .   .   .   .   .         (0.5)          223.6           44.8                —           267.9
Total assets . . . . . . . . . . . . . . . . . . .   .   .   .   .   .   .   .   .   .   .   .      1,966.3         1,066.0           85.6           2,554.7        5,672.6
Net impairment and disposition losses                .   .   .   .   .   .   .   .   .   .   .        275.1            19.0             —               30.9          325.0
Fiscal 2007:
Net Revenues:
  Company-operated retail . . .            ................                                        $6,560.9       $1,437.4       $     —         $       —        $ 7,998.3
  Specialty:
     Licensing . . . . . . . . . . . .     .....     .   .   .   .   .   .   .   .   .   .   .        439.1           220.9          366.3                —         1,026.3
     Foodservice and other . . .           .....     .   .   .   .   .   .   .   .   .   .   .         22.9            37.9          326.1                —           386.9
       Total specialty . . . . . . .       .....     .   .   .   .   .   .   .   .   .   .   .        462.0           258.8          692.4                —         1,413.2
Total net revenues . . . . . . . . .       .....     .   .   .   .   .   .   .   .   .   .   .      7,022.9         1,696.2          692.4                —         9,411.5
Depreciation and amortization .            .....     .   .   .   .   .   .   .   .   .   .   .        341.7            84.2            6.6              34.7          467.2
Income from equity investees .             .....     .   .   .   .   .   .   .   .   .   .   .          0.8            45.7           61.5                —           108.0
Operating income/(loss) . . . . .          .....     .   .   .   .   .   .   .   .   .   .   .      1,005.2           137.7          248.9            (337.9)       1,053.9
Equity method investments . . .            .....     .   .   .   .   .   .   .   .   .   .   .          0.8           196.9           36.8                —           234.5
Total assets . . . . . . . . . . . . . .   .....     .   .   .   .   .   .   .   .   .   .   .      2,078.7           948.7           90.0           2,226.5        5,343.9
Net impairment and disposition             losses    .   .   .   .   .   .   .   .   .   .   .          9.3            15.1             —                1.6           26.0

The table below reconciles the total of the reportable segments’ operating income to the Company’s consolidated
earnings before income taxes (in millions):
Fiscal Year Ended                                                                                                       Sep 27, 2009         Sep 28, 2008       Sep 30, 2007

Operating income . . . . . . . . . . . . . . . . . . . . . . . . . . . . . . . . . . . . . . .                            $562.0               $503.9            $1,053.9
Interest income and other, net . . . . . . . . . . . . . . . . . . . . . . . . . . . . . .                                  36.3                  9.0                40.4
Interest expense . . . . . . . . . . . . . . . . . . . . . . . . . . . . . . . . . . . . . . . .                           (39.1)               (53.4)              (38.0)
Earnings before income taxes . . . . . . . . . . . . . . . . . . . . . . . . . . . . . .                                  $559.2               $459.5            $1,056.3

                                                                                                    76
Note 19:      Subsequent Event
On September 30, 2009, Starbucks acquired 100 percent ownership of the Company’s business in France,
converting it from a 50% joint venture with Sigla S.A. (Grupo Vips) of Spain to a Company-operated market.
Starbucks simultaneously sold its 50% ownership interests in the Spain and Portugal markets to Grupo Vips,
converting them to licensed markets.

Note 20:      Summarized Quarterly Financial Information (unaudited, in millions, except EPS)
                                                                   First       Second     Third       Fourth      Total

2009:
  Net revenues . . . . . . . . . . . . . . . . . . . . . . . . . . $2,615.2   $2,333.3   $2,403.9    $2,422.2   $ 9,774.6
  Operating income(1) . . . . . . . . . . . . . . . . . . . . .       117.7       40.9      204.0       199.4       562.0
  Net earnings(1) . . . . . . . . . . . . . . . . . . . . . . . . .    64.3       25.0      151.5       150.0       390.8
  EPS — diluted . . . . . . . . . . . . . . . . . . . . . . . . .      0.09       0.03       0.20        0.20        0.52
2008:
  Net revenues . . . . . . . . . . . . . . . . . . . . . . . . . . $2,767.6   $2,526.0   $2,574.0    $2,515.4   $10,383.0
  Operating income/(loss)(2) . . . . . . . . . . . . . . . .          333.1      178.2      (21.6)       14.2       503.9
                        (2)
  Net earnings/(loss) . . . . . . . . . . . . . . . . . . . .         208.1      108.7       (6.7)        5.4       315.5
  EPS — diluted . . . . . . . . . . . . . . . . . . . . . . . . .      0.28       0.15      (0.01)       0.01        0.43
(1)
      Includes pretax restructuring charges of $75.5 million, $152.1 million, $51.6 million and $53.2 million for the
      first, second, third and fourth fiscal quarters respectively.
(2)
      Includes pretax restructuring charges of $167.7 million and $99.2 million for the third and fourth fiscal quarters,
      respectively.


                                                                  77
REPORT OF INDEPENDENT REGISTERED PUBLIC ACCOUNTING FIRM
To the Board of Directors and Shareholders of Starbucks Corporation
Seattle, Washington
We have audited the accompanying consolidated balance sheets of Starbucks Corporation and subsidiaries (the
“Company”) as of September 27, 2009 and September 28, 2008, and the related consolidated statements of
earnings, shareholders’ equity, and cash flows for each of the three years in the period ended September 27, 2009.
These financial statements are the responsibility of the Company’s management. Our responsibility is to express an
opinion on these financial statements based on our audits.
We conducted our audits in accordance with the standards of the Public Company Accounting Oversight Board
(United States). Those standards require that we plan and perform the audit to obtain reasonable assurance about
whether the financial statements are free of material misstatement. An audit includes examining, on a test basis,
evidence supporting the amounts and disclosures in the financial statements. An audit also includes assessing the
accounting principles used and significant estimates made by management, as well as evaluating the overall
financial statement presentation. We believe that our audits provide a reasonable basis for our opinion.
In our opinion, such consolidated financial statements present fairly, in all material respects, the financial position
of Starbucks Corporation and subsidiaries as of September 27, 2009 and September 28, 2008, and the results of their
operations and their cash flows for each of the three years in the period ended September 27, 2009, in conformity
with accounting principles generally accepted in the United States of America.
We have also audited, in accordance with the standards of the Public Company Accounting Oversight Board
(United States), the Company’s internal control over financial reporting as of September 27, 2009, based on criteria
established in Internal Control — Integrated Framework issued by the Committee of Sponsoring Organizations of
the Treadway Commission and our report dated November 20, 2009 expressed an unqualified opinion on the
Company’s internal control over financial reporting.


/s/ DELOITTE & TOUCHE LLP

Seattle, Washington
November 20, 2009


                                                          78
Item 9.   Changes in and Disagreements with Accountants on Accounting and Financial Disclosure

Not applicable.


Item 9A. Controls and Procedures

Disclosure Controls and Procedures

The Company maintains disclosure controls and procedures that are designed to ensure that material information
required to be disclosed in the Company’s periodic reports filed or submitted under the Securities Exchange Act of
1934, as amended (the “Exchange Act”), is recorded, processed, summarized and reported within the time periods
specified in the SEC’s rules and forms. Starbucks disclosure controls and procedures are also designed to ensure that
information required to be disclosed in the reports the Company files or submits under the Exchange Act is
accumulated and communicated to the Company’s management, including its principal executive officer and
principal financial officer as appropriate, to allow timely decisions regarding required disclosure.

During the fourth quarter of fiscal 2009 the Company carried out an evaluation, under the supervision and with the
participation of the Company’s management, including the chief executive officer and the chief financial officer, of
the effectiveness of the design and operation of the disclosure controls and procedures, as defined in Rules 13a-15(e)
and 15d-15(e) under the Exchange Act. Based upon that evaluation, the Company’s chief executive officer and chief
financial officer concluded that the Company’s disclosure controls and procedures were effective, as of the end of
the period covered by this report (September 27, 2009).

During the fourth quarter of fiscal 2009, there were no changes in the Company’s internal control over financial
reporting (as defined in Rules 13a-15(f) and 15d-15(f) of the Exchange Act) that materially affected or are
reasonably likely to materially affect internal control over financial reporting.

The certifications required by Section 302 of the Sarbanes-Oxley Act of 2002 are filed as exhibits 31.1 and 31.2,
respectively, to this 10-K.


Report of Management on Internal Control over Financial Reporting

The management of Starbucks is responsible for establishing and maintaining adequate internal control over
financial reporting. Internal control over financial reporting is a process to provide reasonable assurance regarding
the reliability of the Company’s financial reporting for external purposes in accordance with accounting principles
generally accepted in the United States of America. Internal control over financial reporting includes maintaining
records that in reasonable detail accurately and fairly reflect the Company’s transactions; providing reasonable
assurance that transactions are recorded as necessary for preparation of the Company’s financial statements;
providing reasonable assurance that receipts and expenditures are made in accordance with management autho-
rization; and providing reasonable assurance that unauthorized acquisition, use or disposition of company assets
that could have a material effect on the Company’s financial statements would be prevented or detected on a timely
basis. Because of its inherent limitations, internal control over financial reporting is not intended to provide absolute
assurance that a misstatement of the Company’s financial statements would be prevented or detected.

Management conducted an evaluation of the effectiveness of the Company’s internal control over financial
reporting based on the framework and criteria established in Internal Control — Integrated Framework, issued by
the Committee of Sponsoring Organizations of the Treadway Commission. This evaluation included review of the
documentation of controls, evaluation of the design effectiveness of controls, testing of the operating effectiveness
of controls and a conclusion on this evaluation. Based on this evaluation, management concluded that the
Company’s internal control over financial reporting was effective as of September 27, 2009.

The Company’s internal control over financial reporting as of September 27, 2009, has been audited by Deloitte &
Touche LLP, an independent registered public accounting firm, as stated in their report which is included herein.

                                                           79
Report of Independent Registered Public Accounting Firm

To the Board of Directors and Shareholders of Starbucks Corporation
Seattle, Washington

We have audited the internal control over financial reporting of Starbucks Corporation and subsidiaries (the
“Company”) as of September 27, 2009, based on criteria established in Internal Control — Integrated Framework
issued by the Committee of Sponsoring Organizations of the Treadway Commission. The Company’s management
is responsible for maintaining effective internal control over financial reporting and for its assessment of the
effectiveness of internal control over financial reporting, included in the accompanying Report of Management on
Internal Control over Financial Reporting. Our responsibility is to express an opinion on the Company’s internal
control over financial reporting based on our audit.

We conducted our audit in accordance with the standards of the Public Company Accounting Oversight Board
(United States). Those standards require that we plan and perform the audit to obtain reasonable assurance about
whether effective internal control over financial reporting was maintained in all material respects. Our audit
included obtaining an understanding of internal control over financial reporting, assessing the risk that a material
weakness exists, testing and evaluating the design and operating effectiveness of internal control based on the
assessed risk, and performing such other procedures as we considered necessary in the circumstances. We believe
that our audit provides a reasonable basis for our opinion.

A company’s internal control over financial reporting is a process designed by, or under the supervision of, the
company’s principal executive and principal financial officers, or persons performing similar functions, and
effected by the company’s board of directors, management, and other personnel to provide reasonable assurance
regarding the reliability of financial reporting and the preparation of financial statements for external purposes in
accordance with generally accepted accounting principles. A company’s internal control over financial reporting
includes those policies and procedures that (1) pertain to the maintenance of records that, in reasonable detail,
accurately and fairly reflect the transactions and dispositions of the assets of the company; (2) provide reasonable
assurance that transactions are recorded as necessary to permit preparation of financial statements in accordance
with generally accepted accounting principles, and that receipts and expenditures of the company are being made
only in accordance with authorizations of management and directors of the company; and (3) provide reasonable
assurance regarding prevention or timely detection of unauthorized acquisition, use, or disposition of the company’s
assets that could have a material effect on the financial statements.

Because of the inherent limitations of internal control over financial reporting, including the possibility of collusion
or improper management override of controls, material misstatements due to error or fraud may not be prevented or
detected on a timely basis. Also, projections of any evaluation of the effectiveness of the internal control over
financial reporting to future periods are subject to the risk that the controls may become inadequate because of
changes in conditions, or that the degree of compliance with the policies or procedures may deteriorate.

In our opinion, the Company maintained, in all material respects, effective internal control over financial reporting
as of September 27, 2009, based on the criteria established in Internal Control — Integrated Framework issued by
the Committee of Sponsoring Organizations of the Treadway Commission.

We have also audited, in accordance with the standards of the Public Company Accounting Oversight Board
(United States), the consolidated financial statements as of and for the fiscal year ended September 27, 2009, of the
Company and our report dated November 20, 2009 expressed an unqualified opinion on those financial statements.


/s/ DELOITTE & TOUCHE LLP

Seattle, Washington
November 20, 2009

                                                          80
Item 9B. Other Information

None.


                                                      PART III

As used in this Part III, “Starbucks” and the “Company” mean Starbucks Corporation.


Item 10. Directors, Executive Officers and Corporate Governance

The information required by this item regarding the Company’s directors is incorporated herein by reference to the
sections entitled “Proposal 1 — Election Of Directors” and “Executive Compensation — Section 16(a) Beneficial
Ownership Reporting Compliance” and “Corporate Governance — Board Committees and Related Matters” in the
Company’s definitive Proxy Statement for the Annual Meeting of Shareholders to be held on March 24, 2010 (the
“Proxy Statement”). Information regarding the Company’s executive officers is set forth in Item 4 of Part 1 of this
Report under the caption “Executive Officers of the Registrant.”

The Company adopted a code of ethics applicable to its chief executive officer, chief financial officer, controller and
other finance leaders, which is a “code of ethics” as defined by applicable rules of the SEC. This code is publicly
available on the Company’s website at www.starbucks.com/aboutus/corporate_governance.asp. If the Company
makes any amendments to this code other than technical, administrative or other non-substantive amendments, or
grants any waivers, including implicit waivers, from a provision of this code to the Company’s chief executive
officer, chief financial officer or controller, the Company will disclose the nature of the amendment or waiver, its
effective date and to whom it applies on its website or in a report on Form 8-K filed with the SEC.


Item 11. Executive Compensation

The information required by this item is incorporated by reference to the sections entitled “Executive Compen-
sation” and “Corporate Governance — Compensation Committee” in the Proxy Statement.


Item 12. Security Ownership of Certain Beneficial Owners and Management and Related Shareholder
         Matters

The information required by this item is incorporated by reference to the sections entitled “Beneficial Ownership of
Common Stock” and “Executive Compensation — Equity Compensation Plan Information” in the Proxy
Statement.


Item 13. Certain Relationships and Related Transactions, and Director Independence

The information required by this item is incorporated by reference to the section entitled “Executive Compensa-
tion — Certain Relationships and Related Transactions” and “Corporate Governance — Affirmative Determina-
tions Regarding Director Independence and Other Matters” in the Proxy Statement.


Item 14. Principal Accountant Fees and Services

The information required by this item is incorporated by reference to the sections entitled “Independent Registered
Public Accounting Firm Fees” and “Policy on Audit Committee Pre-Approval of Audit and Permissible Non-Audit
Services of the Independent Registered Public Accounting Firm” in the Proxy Statement.

                                                          81
PART IV

Item 15.   Exhibits and Financial Statement Schedules
(a) The following documents are filed as a part of this 10-K:

1. Financial Statements
The following financial statements are included in Part II, Item 8 of this 10-K:
    • Consolidated Statements of Earnings for the fiscal years ended September 27, 2009, September 28, 2008 and
      September 30, 2007;
    • Consolidated Balance Sheets as of September 27, 2009 and September 28, 2008;
    • Consolidated Statements of Cash Flows for the fiscal years ended September 27, 2009 September 28, 2008
      and September 30, 2007;
    • Consolidated Statements of Shareholders’ Equity for the fiscal years ended September 27, 2009,
      September 28, 2008 and September 30, 2007;
    • Notes to Consolidated Financial Statements; and
    • Reports of Independent Registered Public Accounting Firm

2. Financial Statement Schedules
Financial statement schedules are omitted because they are not required or are not applicable, or the required
information is provided in the consolidated financial statements or notes described in Item 15(a)(1) above.

3. Exhibits
The Exhibits listed in the Index to Exhibits, which appears immediately following the signature page and is
incorporated herein by reference, are filed as part of this 10-K.


                                                       82
SIGNATURES
Pursuant to the requirements of Section 13 or 15(d) of the Securities Exchange Act of 1934, as amended, the
registrant has duly caused this report to be signed on its behalf by the undersigned, thereunto duly authorized.


                                                           STARBUCKS CORPORATION


                                                           By: /s/   Howard Schultz
                                                               Howard Schultz
                                                               chairman, president and chief executive officer

November 20, 2009

                                            POWER OF ATTORNEY
Know all persons by these presents, that each person whose signature appears below constitutes and appoints
Howard Schultz and Troy Alstead, and each of them, as such person’s true and lawful attorneys-in-fact and agents,
with full power of substitution and resubstitution, for such person and in such person’s name, place and stead, in any
and all capacities, to sign any and all amendments to this Report, and to file the same, with all exhibits thereto, and
other documents in connection therewith, with the Securities and Exchange Commission, granting unto said
attorneys-in-fact and agents, and each of them, full power and authority to do and perform each and every act and
thing requisite and necessary to be done in connection therewith, as fully to all intents and purposes as such person
might or could do in person, hereby ratifying and confirming that all said attorneys-in-fact and agents, or any of
them or their or such person’s substitute or substitutes, may lawfully do or cause to be done by virtue thereof.
Pursuant to the requirements of the Securities Exchange Act of 1934, as amended, this report has been signed below
by the following persons on behalf of the Registrant and in the capacities indicated as of November 20, 2009.
                    Signature                                                     Title


By: /s/ Howard Schultz                                     chairman, president and chief executive officer
    Howard Schultz

By: /s/ Troy Alstead                                  executive vice president, chief financial officer and chief
    Troy Alstead                                        administrative officer (principal financial officer and
                                                                    principal accounting officer)

By: /s/ Barbara Bass                                                            director
    Barbara Bass

By: /s/ William W. Bradley                                                      director
    William W. Bradley

By: /s/ Mellody Hobson                                                          director
    Mellody Hobson

By: /s/ Kevin Johnson                                                           director
    Kevin Johnson


                                                          83
Signature          Title
By: /s/ Olden Lee                   director
    Olden Lee

By: /s/ Sheryl Sandberg             director
    Sheryl Sandberg

By: /s/ James G. Shennan Jr.        director
    James G. Shennan Jr.

By: /s/ Javier G. Teruel            director
    Javier G. Teruel

By: /s/ Myron E. Ullman III         director
    Myron E. Ullman III

By: /s/ Craig E. Weatherup          director
    Craig E. Weatherup


                               84
INDEX TO EXHIBITS

                                                                   Incorporated by Reference
Exhibit                                                                              Date of      Exhibit    Filed
Number                 Exhibit Description                  Form      File No.     First Filing   Number    Herewith

 3.1      Restated Articles of Incorporation of             10-Q     0-20322        05/12/06       3.1
          Starbucks Corporation
 3.2      Amended and Restated Bylaws of Starbucks          8-K      0-20322         1/12/09       3.2
          Corporation
 4.1      Form of Indenture                             S-3 ASR 333-145572           8/20/07       4.1
 4.2      Form of Note for 6.25% Senior Notes due         8-K    0-20322             8/23/07       4.2
          2017
 4.3      Form of Supplemental Indenture for                8-K      0-20322         8/23/07       4.3
          6.25% Senior Notes due 2017
10.1*     Starbucks Corporation Amended and                 8-K      0-20322         3/20/09      10.2
          Restated Key Employee Stock Option
          Plan — 1994, as amended and restated
          through March 18, 2009
10.2*     Starbucks Corporation Amended and                 10-K     0-20322        12/23/03      10.2
          Restated 1989 Stock Option Plan for Non-
          Employee Directors
10.3      Starbucks Corporation 1991 Company-Wide           8-K      0-20322         3/20/09      10.3
          Stock Option Plan, as amended and restated
          through March 18, 2009
10.3.1    Starbucks Corporation 1991 Company-Wide           10-K     0-20322        12/23/03      10.3.1
          Stock Option Plan — Rules of the UK
          Sub-Plan, as amended and restated through
          November 20, 2003
10.4*     Starbucks Corporation Employee Stock              10-Q     0-20322         2/04/09      10.6
          Purchase Plan — 1995 as amended and
          restated through April 1, 2009
10.5      Amended and Restated Lease, dated as of           10-K     0-20322        12/20/01      10.5
          January 1, 2001, between First and Utah
          Street Associates, L.P. and Starbucks
          Corporation
10.6*     Starbucks Corporation Executive                   8-K      0-20322         9/25/06      10.1
          Management Bonus Plan, as amended and
          restated effective September 19, 2006
10.7*     Starbucks Corporation Management                  S-8     333-65181       10/01/98       4.1
          Deferred Compensation Plan
10.8*     Starbucks Corporation 1997 Deferred Stock         10-K     0-20322        12/23/99      10.17
          Plan
10.9      Starbucks Corporation UK Share Save Plan          10-K     0-20322        12/23/03      10.9
10.10*    Starbucks Corporation Directors Deferred          10-K     0-20322        12/23/03      10.10
          Compensation Plan, as amended and
          restated effective September 29, 2003
10.11*    Consulting Agreement dated April 6, 2009          10-Q     0-20322        08/05/09      10.1
          between Starbucks Corporation and Olden
          Lee
10.12     Starbucks Corporation UK Share Incentive          10-K     0-20322        12/14/06      10.12
          Plan, as amended and restated effective
          November 14, 2006

                                                       85
Incorporated by Reference
Exhibit                                                                              Date of      Exhibit    Filed
Number                 Exhibit Description                  Form      File No.     First Filing   Number    Herewith
10.13*    Starbucks Corporation 2005 Long-Term              8-K      0-20322        03/20/09      10.1
          Equity Incentive Plan, as amended and
          restated effective March 18, 2009
10.14*    2005 Key Employee Sub-Plan to the                 10-Q     0-20322        02/10/06      10.2
          Starbucks Corporation 2005 Long-Term
          Equity Incentive Plan, as amended and
          restated effective November 15, 2005
10.15*    2005 Non-Employee Director Sub-Plan to            8-K      0-20322        02/10/05      10.3
          the Starbucks Corporation 2005 Long-Term
          Equity Incentive Plan
10.16*    Stock Option Grant Agreement for Purchase         8-K      0-20322        02/10/05      10.4
          of Stock under the 2005 Key Employee
          Sub-Plan to the Starbucks Corporation 2005
          Long-Term Equity Incentive Plan
10.17*    Stock Option Grant Agreement for Purchase         8-K      0-20322        02/10/05      10.5
          of Stock under the 2005 Non-Employee
          Director Sub-Plan to the Starbucks
          Corporation 2005 Long-Term Equity
          Incentive Plan
10.18*    Letter Agreement dated as of February 11,         10-Q     0-20322        02/16/05      10.1
          2005 by and among the Company, the
          Schultz Irrevocable Trust and the Howard
          D. Schultz Irrevocable Trust
10.19*    Letter Agreement dated February 5, 2009           10-Q     0-20322        05/06/09      10.4
          between Starbucks Corporation and John
          Culver
10.20     2005 Company-Wide Sub-Plan to the                 10-Q     0-20322        08/10/05      10.1
          Starbucks Corporation 2005 Long-Term
          Equity Incentive Plan
10.21     Stock Option Grant Agreement for Purchase         10-Q     0-20322        08/10/05      10.2
          of Stock under the 2005 Company-Wide
          Sub-Plan to the Starbucks Corporation 2005
          Long-Term Equity Incentive Plan
10.22     Credit Agreement dated August 12, 2005            8-K      0-20322        08/15/05      10.1
          among Starbucks Corporation, Bank of
          America, N.A., as Administrative Agent,
          Swing Line Lender and L/C Issuer,
          Wachovia Bank N.A. and Citibank, N.A., as
          Co-Documentation Agents, Banc of
          America Securities LLC and Wells Fargo
          Bank, N.A., as Joint Lead Arrangers and
          Joint Book Managers, Wells Fargo Bank,
          N.A., as Syndication Agent, and the other
          Lenders party thereto.
10.23     Commercial Paper Dealer Agreement                 8-K      0-20322         3/27/07      10.1.1
          between Starbucks Corporation and Banc of
          America Securities LLC, dated as of
          March 27, 2007


                                                       86
Incorporated by Reference
Exhibit                                                                                 Date of      Exhibit    Filed
Number                 Exhibit Description                  Form         File No.     First Filing   Number    Herewith
10.24     Commercial Paper Dealer Agreement                 8-K         0-20322         3/27/07      10.1.2
          between Starbucks Corporation and
          Goldman, Sachs & Co., dated as of
          March 27, 2007
10.25*    Letter Agreement dated April 2, 2007              8-K         0-20322         4/3/07       10.1
          between Starbucks Corporation and Peter J.
          Bocian
10.26*    Letter Agreement dated July 16, 2007              8-K         0-20322         7/17/07      10.1
          between Starbucks Corporation and Martin
          Coles
10.27*    Letter Agreement dated February 19, 2008          10-Q        0-20322        05/08/08      10.1
          between Starbucks Corporation and Arthur
          Rubinfeld
10.28*    Letter Agreement dated January 10, 2008           10-Q        0-20322        05/08/08      10.2
          between Starbucks Corporation and Chet
          Kuchinad
10.29*    Letter Agreement dated February 21, 2008          10-Q        0-20322        05/08/08      10.3
          between Starbucks Corporation and Clifford
          Burrows
10.30     Amendment No. 4 to Credit Agreement               8-K         0-20322        10/31/08      10.1
          dated October 31, 2008, among Starbucks
          Corporation, Bank of America, N.A., as
          Administrative Agent and the Lenders party
          thereto
10.31     Amendment No. 5 to Credit Agreement               10-Q        0-20322        08/05/09      10.2
          dated June 8, 2009, among Starbucks
          Corporation, Bank of America, N.A., as
          Administrative Agent and the Lenders party
          thereto
10.32*    Letter Agreement dated November 6, 2008           8-K         0-20322        11/12/08      10.1
          between Starbucks Corporation and Troy
          Alstead
10.33*    Time Vested Restricted Stock Unit                 8-K         0-20322         11/7/08      10.1
          Agreement (US) under Starbucks
          Corporation 2005 Long-Term Equity
          Incentive Plan
10.34*    Time Vested Restricted Stock Unit                 8-K         0-20322         11/7/08      10.2
          Agreement (International) under Starbucks
          Corporation 2005 Long-Term Equity
          Incentive Plan
10.35*    Performance Based Restricted Stock Unit           8-K         0-20322         11/7/08      10.3
          Agreement under Starbucks Corporation
          2005 Long-Term Equity Incentive Plan
12        Computation of Ratio of Earnings to Fixed               —              —             —     —            X
          Charges
21        Subsidiaries of Starbucks Corporation                   —              —             —     —            X
23        Consent of Independent Registered Public                —              —             —     —            X
          Accounting Firm


                                                       87
Incorporated by Reference
Exhibit                                                                                 Date of      Exhibit    Filed
Number                  Exhibit Description                    Form      File No.     First Filing   Number    Herewith

31.1      Certification of Principal Executive Officer            —              —             —     —            X
          Pursuant to Rule 13a-14 of the Securities
          Exchange Act of 1934, As Adopted
          Pursuant to Section 302 of the Sarbanes-
          Oxley Act of 2002
31.2      Certification of Principal Financial Officer            —              —             —     —            X
          Pursuant to Rule 13a-14 of the Securities
          Exchange Act of 1934, As Adopted Pursuant
          to Section 302 of the Sarbanes-Oxley Act of
          2002
32        Certifications of Principal Executive Officer           —              —             —     —            X
          and Principal Financial Officer Pursuant to
          18 USC. Section 1350, As Adopted Pursuant
          to Section 906 of the Sarbanes-Oxley Act of
          2002

* Denotes a management contract or compensatory plan or arrangement.


                                                          88
Market Information                                                       Board of Directors and Senior Officers

Starbucks common stock is traded on the NASDAQ Global Select             Board of Directors
Market (“NASDAQ”), under the symbol SBUX. The following table            Howard Schultz Starbucks Corporation, chairman, president and chief executive officer
shows the quarterly high and low closing sale prices per share of the
                                                                         Barbara Bass Gerson Bakar Foundation, president
Company’s common stock as reported by NASDAQ for each quarter
during the last two fiscal years.                                        William W. Bradley Allen & Company LLC, managing director
                                                                         Mellody Hobson Ariel Investments, LLC, president
September 27, 2009:         High         Low                             Kevin Johnson Juniper Networks, Inc., chief executive officer
Fourth Quarter             $20.76      $12.97                            Olden Lee PepsiCo, Inc., retired executive
Third Quarter               15.30        11.11                           Sheryl Sandberg Facebook, Inc., chief operating officer
Second Quarter              12.39        8.27
                                                                         James G. Shennan, Jr. Trinity Ventures, general partner emeritus
First Quarter               14.87         7.17
                                                                         Javier G. Teruel Colgate-Palmolive Company, retired vice chairman
September 28, 2008:                                                      Myron E. Ullman, III J.C. Penney Company, Inc., chairman and chief executive officer
Fourth Quarter             $16.92      $13.58                            Craig E. Weatherup Pepsi-Cola Company, retired chief executive officer
Third Quarter               18.60       15.66
Second Quarter              20.47       16.80                            Senior Officers
First Quarter               26.84       20.03                            Howard Schultz chairman, president and chief executive officer
                                                                         Clifford Burrows president, Starbucks Coffee U.S.
The Company’s U.S. Securities and Exchange Commission filings may
be obtained without charge by accessing the Investor Relations section   John Culver president, Starbucks Coffee International
of the Company’s website at http://investor.starbucks.com, at            Michelle Gass president, Seattle’s Best Coffee
http://sec.gov, or by making a request to Investor Relations via the     Arthur Rubinfeld president, Global Development
address, phone number or website listed below.
                                                                         Annie Young-Scrivner chief marketing officer
Investor Relations                                                       Troy Alstead executive vice president, chief financial officer and chief administrative officer
Starbucks Corporation                                                    Paula E. Boggs executive vice president, general counsel and secretary
PO Box 34067                                                             Peter D. Gibbons executive vice president, Global Supply Chain Operations
M/S S-SR1
Seattle, WA 98124-1067
                                                                         Kalen Holmes executive vice president, Partner Resources
(206) 447-1575, ext. 87118                                               Olden Lee interim executive vice president, Partner Resources
http://investor.starbucks.com                                            Chris Carr senior vice president and general manager, Starbucks Licensed Stores
                                                                         Mercy Corrales senior vice president; president, Asia Pacific
Independent Auditors
Deloitte & Touche LLP                                                    Terry Davenport senior vice president, Marketing
                                                                         Stephen Gillett senior vice president, chief information officer and general manager, Digital Ventures
Transfer Agent                                                           Willard (Dub) Hay senior vice president, Coffee
BNY Mellon Shareowner Services
                                                                         Lucy Lee Helm senior vice president, deputy general counsel
Starbucks Coffee Company                                                 Buck Hendrix senior vice president; president, EMEA
c/o BNY Mellon Shareowner Services                                       Charles Jemley senior vice president, Finance-International
PO Box 38015                                                             Louis Jordan senior vice president, Finance-U.S.
Pittsburgh, PA 15252
                                                                         Dorothy J. Kim senior vice president
(888) 835-2866
www.bnymellon.com/shareowner                                             James Koster senior vice president, Partner Resources, U.S. and Global Supply Chain Operations
                                                                         David Landau senior vice president, deputy general counsel and chief compliance officer
Annual Meeting of Shareholders                                           Cosimo LaPorta senior vice president, Operations, Starbucks Coffee International
March 24, 2010
10:00 a.m. PST                                                           Barbara Le Marrec senior vice president; chief retail officer, Starbucks Coffee Japan
Marion Oliver McCaw Hall                                                 Dan Loeb senior vice president; president, Greater China
Seattle, WA                                                              James McDermet senior vice president, Northeast Division
Live webcast at: http://investor.starbucks.com
                                                                         Michael Malanga senior vice president, U.S. Store Development, Global Strategy and Support Services
                                                                         Colin Moore senior vice president; president, Starbucks Coffee Americas
GLOBAL RESPONSIBILITY                                                    Tim Pfeiffer senior vice president, Store Design
Starbucks is committed to being a deeply responsible company in the      Craig Russell senior vice president, Store Services
communities where it does business around the world. The Company’s
                                                                         Michael Stafford senior vice president, Talent Management
focus is on ethically sourcing high-quality coffee, reducing its
environmental impacts and contributing positively to communities.        Carl Sweat senior vice president, Global Beverage
Starbucks Global Responsibility strategy and commitments are integral    Clarice Turner senior vice president, North Division
to the Company’s overall business strategy. As a result, Starbucks       Vivek Varma senior vice president, Public Affairs
believes it delivers benefits to the Company and its stakeholders,
including employees, business partners, customers, suppliers,            Jinlong Wang senior vice president, SCI Business Development and chairman, Greater China
shareholders, community members and others. For an overview of           Mark Wesley senior vice president, Global Development-International
Starbucks Global Responsibility strategy and commitments, please         Rossann Williams senior vice president, South Division
see Starbucks fiscal 2009 Global Responsibility Report, available
online at starbucks.com/sharedplanet on Earth Day, April 22, 2010.
Fiscal 2009 will stand out as a year filled
with many challenges and opportunities
for Starbucks. With the commitment and
hard work of our resourceful partners,
and the support of millions of loyal
customers around the world, Starbucks
not only weathered the storm but emerged
as a much more innovative, efficient
and sustainable organization. For this,
Starbucks sincerely thanks all of those
who played a part.

In fiscal 2010, our commitment is to
remain focused on driving rigorous
discipline throughout our business, and
introducing relevant innovation—while
continuously enhancing the Starbucks
Experience—which will continue to
differentiate Starbucks for years to come.


To minimize our environmental impact, the Starbucks Corporation Fiscal 2009 Annual Report, not the 10-K, was printed
on paper manufactured from 100% post-consumer recycled fibers, certified Processed Chlorine Free (PCF), using 100%
Green-e certified renewable energy. We’ll keep looking for ways to further reduce our environmental footprint.
© 2009 Starbucks Corporation. All rights reserved. SJBQ410OTH-00551

Sbux informe 2009

  • 1.
    Starbucks Corporation Fiscal2009 Annual Report
  • 2.
    Fiscal 2009 FinancialHighlights Stores Open at Fiscal Year End Net Revenues (In Billions) (Company-Operated and Licensed Stores) International 16,680 16,635 $10.4 United States $9.8 15,011 $9.4 12,440 $7.8 10,241 $6.4 2005 2006 2007 2008 2009 2005 2006 2007 2008 2009 Comparable Store Sales Growth Operating Income (In Millions) & Operating Margin (In %) (Company-Operated Stores Open 13 Months or Longer) GAAP GAAP Non-GAAP Non-GAAP 8% $1,054 7% $894 $894*** $843** 5% $781 $339 $332 12.3% 11.5% 11.2% $562 $504 2005 2006 2007 2008 2009 9.2%*** 8.1%** - 3% 5.7% 4.9% 2005 2006 2007 2008 2009 - 6% Earnings per Diluted Share Operating Cash Flow & Capital Expenditures (In Millions) GAAP EPS Cash from Operations Non-GAAP EPS $0.87 Capital Expenditures $1,389 $1,331 $0.80*** $1,259 $0.71** $0.28 $1,132 $0.71* $923 $1,080 $0.61 $0.28 $985 $771 $643 $0.52 $0.43 $446 2005 2006 2007 2008 2009 2005 2006 2007 2008 2009 * 2006 includes $0.02 of expense resulting from the ** 2008 Non-GAAP measure. Excludes $339 million in pretax *** 2009 Non-GAAP measure. Excludes $332 million cumulative impact of the adoption of an accounting restructuring charges and transformation expenses. in pretax restructuring charges. change for asset retirement obligations.
  • 3.
    Dear Shareholders, In myletter to you two years ago, I expressed concern over challenges confronting our business of a breadth and magnitude unlike anything I had ever seen before. For the first time, we were beginning to see traffic in our U.S. stores slow. Strong competitors were entering our business. And perhaps most troublesome, where in the past Starbucks had always been forward-thinking and nimble in its decision-making and execution, like many fast-growing companies before us, we had allowed our success to make us complacent. As I returned to the role of president and chief executive officer, it was obvious to me, and to our leadership team, that Starbucks needed nothing less than a full-fledged transformation to return to profitable growth. Since then, we have worked through the multitude of challenges required to revitalize our brand and transform our company—all in the face of the worst global economic environment of our generation. Today, I am pleased to report that we have made and continue to make significant progress in transforming Starbucks and returning the company to sustainable, profitable growth while preserving our values and guiding principles. Our Transformation Journey Our blueprint for change was the transformation agenda: improving the state of our business through better training, tools and products; renewing our attention to store-level economics and operating efficiency; reigniting our emotional attachment with customers; and realigning Starbucks organization for the long term. In fiscal 2009, the seeds of our transformation began to take root. Disciplined Operations We applied rigor and discipline to all areas of the business and put sharp focus on unit economics. We focused on operational excellence—from supply chain to back-end IT systems to store operations. We also developed a better go-to- market engine, with stronger creative execution and more effective channels to reach our customers. Together, these efforts are enabling us to make better- informed decisions—and to bring products and initiatives to market faster and more cost effectively. At the same time, we took steps to permanently improve our cost structure, which resulted in removing $580 million in costs from the business in fiscal 2009 alone. But it was clear to us that cost reductions and improved operating efficiencies alone were not enough. True transformation would require us to improve our customer experience, and to once again aggressively differentiate and innovate. Innovating for a Better Customer Experience In conjunction with our focus on operations, we made significant investments to improve the customer experience in our stores. Our store partners have made measurable improvements in service, beverage quality and store condition. As a result, over the past fiscal year, our already high customer satisfaction scores have increased a full 10 percentage points. For this, I applaud our store partners all over the world, who define the Starbucks Experience one cup at a time, every day. As consumer trends evolved in the face of the weakening global economy, we responded quickly with relevant innovation in our loyalty card program and with compelling value offerings and innovative food pairings. We elevated and reaffirmed our leadership in coffee quality, evolving our sustainable sourcing, roasting and blending approaches. We also renewed our commitment to espresso excellence, ensuring that we are providing the highest-quality handcrafted, customized beverages to suit every customer’s taste. The results have validated our focus. Sales of Starbucks® Anniversary Blend coffee exceeded those of any year since it launched in 1996. Our partnership with (RED)™ continues to outperform expectations, generating enough money during its first year to buy more than seven million daily doses of medicine to help fight AIDS in Africa. Our decision to offer both Pike Place Roast™ and a bolder roast profile with fresher brew times has been extremely well received by our core customers. And our seasonal beverages such as Pumpkin Spice Latte and Caramel Brulée Latte were customer favorites this holiday season. As consumers have increasingly requested healthier food choices, we responded by offering new products with whole grains and other wholesome ingredients. We also thoroughly revamped our food offerings: simplifying recipes and taking out artificial trans fat, high-fructose corn syrup and artificial flavors and dyes. Customers will continue to see improved choices and an expanded menu of healthier food choices in the months and year ahead. We applied technology to revolutionize the way we communicate with consumers through social and digital media. Starbucks has been named the most engaged consumer brand, using communities such as Facebook, Twitter and My Starbucks Idea to connect with our customers outside the store environment. We are in constant dialogue with our
  • 4.
    customers, allowing usto understand their needs and stay top-of-mind in this increasingly competitive retail environment. We also launched popular iPhone applications to help customers find our stores, determine nutrition information and reload their Starbucks Cards. In fiscal 2009, we unveiled a bold and innovative store design approach, with new concepts in Seattle, Paris and London—all enthusiastically received. All newly constructed company-operated stores worldwide will be LEED®-certified beginning this calendar year, moving us closer to our goal of significantly reducing our environmental footprint. This initiative, coupled with locally relevant store designs and renovations, is helping us form deep and long-lasting connections with customers in their own neighborhoods. Finally, we stayed true to who we are and our mission to inspire and nurture the human spirit—one person, one cup and one neighborhood at a time. For our partners, despite economic pressure, we continued to offer health care benefits to eligible full- and part-time partners, something we have done for over 20 years. We were also proud to be able to contribute a match under our 401(k) program this year—another benefit that many companies retreated from in 2009. We reaffirmed our commitment to doing business responsibly. This year we became the world’s largest purchaser of Fair Trade Certified™ coffee and partnered with Conservation International to address climate change in coffee-growing regions. And we continued to give back to the communities we serve through volunteer activities and community programs. These efforts are also good business, as consumers increasingly want to build relationships with companies that share their values. Our Path Forward With our progress over the past two years, we are now in a position to take advantage of the global opportunity for Starbucks. Improvements in the U.S. business will allow us to pursue disciplined new store growth internationally. While Starbucks now operates in more than 50 countries (we added Portugal, Bulgaria and Poland in fiscal 2009), we are still in the early stages of international growth. We expect future growth for Starbucks to come from deeper expansion in markets where we already have a strong presence, such as the UK, Canada and Japan. Our progress in China continues, and we believe it will one day be the largest market for Starbucks outside the U.S. As part of our international strategy, we will also seize opportunities to move beyond our retail stores. Extending our profitable global consumer products group allows us to reach more customers in more places, and we plan to grow this business at an accelerated pace around the world. We see significant runway for CPG to grow, and we will be poised to capture that opportunity with an evolution of our distribution structure and with an increasing variety of offerings in the grocery channel. Our future lies in our ability to innovate, to be forward-thinking and nimble. In fiscal 2009, we wrote a new playbook for just that with the launch of Starbucks VIA™ Ready Brew. We have been extremely excited to see our customers in North America embrace this 100 percent natural roasted soluble coffee that maintains the high standards of quality and taste of freshly brewed Starbucks® coffee. This is a substantial new global growth platform within our core business, representing the first significant innovation in more than 50 years in the $21 billion global instant coffee category. Starbucks VIA™ also gives customers an easy and affordable single-serve option at home and on-the-go. We look forward to extending the product internationally—both in our stores and in grocery channels—in fiscal 2010. Another growth vehicle will be Seattle’s Best Coffee. Our research tells us we can aggressively position SBC with new customers, and we plan to create compelling franchising and distribution opportunities in 2010. We have ambitious goals for the brand and look forward to making some big moves in the coming months. I am incredibly proud of the loyalty, commitment, passion and tireless efforts of our partners all over the world. Because of them we have been able to successfully navigate some formidable and dangerous headwinds, and to emerge a better and stronger company than we have ever been—ideally positioned to grow and capitalize on global opportunities in the years ahead. I am as optimistic about Starbucks future as I have ever been. In closing, I would like to offer my heartfelt thanks to everyone who touches Starbucks. To our people, who stepped up to the challenge of delivering an exceptional customer experience, to the farmers and suppliers who grow our coffee, to our business partners around the world, to our shareholders for their continued support, and ultimately to our customers—for inviting us into their lives and for giving us the opportunity to earn their loyalty and trust every day. Warm regards, Howard Schultz chairman, president and chief executive officer
  • 5.
    UNITED STATES SECURITIESAND EXCHANGE COMMISSION Washington, DC 20549 Form 10-K ¥ ANNUAL REPORT PURSUANT TO SECTION 13 OR 15(d) OF THE SECURITIES EXCHANGE ACT OF 1934 For the fiscal year ended September 27, 2009 or n TRANSITION REPORT PURSUANT TO SECTION 13 OR 15(d) OF THE SECURITIES EXCHANGE ACT OF 1934 For the transition period from to . Commission File Number: 0-20322 Starbucks Corporation (Exact Name of Registrant as Specified in Its Charter) Washington 91-1325671 (State of Incorporation) (IRS Employer ID) 2401 Utah Avenue South Seattle, Washington 98134 (206) 447-1575 (Address of principal executive offices, zip code, telephone number) Securities Registered Pursuant to Section 12(b) of the Act: Title of Each Class Name of Each Exchange on Which Registered Common Stock, $0.001 par value per share Nasdaq Global Select Market Securities Registered Pursuant to Section 12(g) of the Act: None Indicate by check mark if the registrant is a well-known seasoned issuer, as defined in Rule 405 of the Securities Act. Yes ¥ No n Indicate by check mark if the registrant is not required to file reports pursuant to Section 13 or Section 15(d) of the Act. Yes n No ¥ Indicate by check mark whether the registrant: (1) has filed all reports required to be filed by Section 13 or 15(d) of the Securities Exchange Act of 1934 during the preceding 12 months (or for such shorter period that the registrant was required to file such reports), and (2) has been subject to such filing requirements for the past 90 days. Yes ¥ No n Indicate by check mark whether the registrant has submitted electronically and posted on its corporate Web site, if any, every Interactive Data File required to be submitted and posted pursuant to Rule 405 of Regulation S-T (§ 232.405 of this chapter) during the preceding 12 months (or for such shorter period that the registrant was required to submit and post such files). Yes ¥ No n Indicate by check mark if disclosure of delinquent filers pursuant to Item 405 of Regulation of S-K is not contained herein, and will not be contained, to the best of the registrant’s knowledge, in definitive proxy or information statements incorporated by reference in Part III of this Form 10-K or any amendment to this Form 10-K. ¥ Indicate by check mark whether the registrant is a large accelerated filer, an accelerated filer, a non-accelerated filer, or a smaller reporting company. See the definitions of “large accelerated filer,” “accelerated filer” and “smaller reporting company” in Rule 12b-2 of the Exchange Act. (Check one): Large accelerated filer ¥ Accelerated filer n Non-accelerated filer n Smaller reporting company n (Do not check if a smaller reporting company) Indicate by check mark whether the registrant is a shell company (as defined in Rule 12b-2 of the Exchange Act). Yes n No ¥ The aggregate market value of the voting stock held by non-affiliates of the registrant as of the last business day of the registrant’s most recently completed second fiscal quarter, based upon the closing sale price of the registrant’s common stock on March 27, 2009 as reported on the NASDAQ Global Select Market was $8.4 billion. As of November 13, 2009, there were approximately 740.2 million shares of the registrant’s Common Stock outstanding. DOCUMENTS INCORPORATED BY REFERENCE Portions of the definitive Proxy Statement for the registrant’s Annual Meeting of Shareholders to be held on March 24, 2010 have been incorporated by reference into Part III of this Annual Report on Form 10-K.
  • 7.
    STARBUCKS CORPORATION Form 10-K For the Fiscal Year Ended September 27, 2009 TABLE OF CONTENTS PART I Item 1 Business . . . . . . . . . . . . . . . . . . . . . . . . . . . . . . . . . . . . . . . . . . . . . . . . . . . . . . . . . . . . . . . . . 1 Item 1A Risk Factors . . . . . . . . . . . . . . . . . . . . . . . . . . . . . . . . . . . . . . . . . . . . . . . . . . . . . . . . . . . . . . 8 Item 1B Unresolved Staff Comments . . . . . . . . . . . . . . . . . . . . . . . . . . . . . . . . . . . . . . . . . . . . . . . . . . 14 Item 2 Properties . . . . . . . . . . . . . . . . . . . . . . . . . . . . . . . . . . . . . . . . . . . . . . . . . . . . . . . . . . . . . . . . 14 Item 3 Legal Proceedings . . . . . . . . . . . . . . . . . . . . . . . . . . . . . . . . . . . . . . . . . . . . . . . . . . . . . . . . . . 14 Item 4 Submission of Matters to a Vote of Security Holders . . . . . . . . . . . . . . . . . . . . . . . . . . . . . . . . 14 PART II Item 5 Market for the Registrant’s Common Equity, Related Shareholder Matters and Issuer Purchases of Equity Securities. . . . . . . . . . . . . . . . . . . . . . . . . . . . . . . . . . . . . . . . . . . . . . . . . . . . . . . . . 17 Item 6 Selected Financial Data . . . . . . . . . . . . . . . . . . . . . . . . . . . . . . . . . . . . . . . . . . . . . . . . . . . . . . 19 Item 7 Management’s Discussion and Analysis of Financial Condition and Results of Operations . . . . . 21 Item 7A Quantitative and Qualitative Disclosures About Market Risk . . . . . . . . . . . . . . . . . . . . . . . . . . 39 Item 8 Financial Statements and Supplementary Data . . . . . . . . . . . . . . . . . . . . . . . . . . . . . . . . . . . . . 40 Report of Independent Registered Public Accounting Firm . . . . . . . . . . . . . . . . . . . . . . . . . . . . 78 Item 9 Changes in and Disagreements with Accountants on Accounting and Financial Disclosure . . . . 79 Item 9A Controls and Procedures . . . . . . . . . . . . . . . . . . . . . . . . . . . . . . . . . . . . . . . . . . . . . . . . . . . . . 79 Item 9B Other Information . . . . . . . . . . . . . . . . . . . . . . . . . . . . . . . . . . . . . . . . . . . . . . . . . . . . . . . . . . 81 PART III Item 10 Directors, Executive Officers and Corporate Governance . . . . . . . . . . . . . . . . . . . . . . . . . . . . . 81 Item 11 Executive Compensation . . . . . . . . . . . . . . . . . . . . . . . . . . . . . . . . . . . . . . . . . . . . . . . . . . . . . 81 Item 12 Security Ownership of Certain Beneficial Owners and Management and Related Shareholder Matters . . . . . . . . . . . . . . . . . . . . . . . . . . . . . . . . . . . . . . . . . . . . . . . . . . . . . . . . . . . . . . . . . . 81 Item 13 Certain Relationships and Related Transactions, and Director Independence . . . . . . . . . . . . . . . 81 Item 14 Principal Accountant Fees and Services . . . . . . . . . . . . . . . . . . . . . . . . . . . . . . . . . . . . . . . . . . 81 PART IV Item 15 Exhibits and Financial Statement Schedules . . . . . . . . . . . . . . . . . . . . . . . . . . . . . . . . . . . . . . . 82 SIGNATURES . . . . . . . . . . . . . . . . . . . . . . . . . . . . . . . . . . . . . . . . . . . . . . . . . . . . . . . . . . . . . . . . . . . . 83 INDEX TO EXHIBITS . . . . . . . . . . . . . . . . . . . . . . . . . . . . . . . . . . . . . . . . . . . . . . . . . . . . . . . . . . . . . . 85
  • 8.
  • 9.
    PART I Item 1. Business General Starbucks is the premier roaster and retailer of specialty coffee in the world. Starbucks Corporation was formed in 1985 and its common stock trades on the NASDAQ Global Select Market (“NASDAQ”) under the symbol “SBUX.” Starbucks (together with its subsidiaries, “Starbucks” or the “Company”) purchases and roasts high-quality whole bean coffees and sells them, along with fresh, rich-brewed coffees, Italian-style espresso beverages, cold blended beverages, a variety of complementary food items, a selection of premium teas, and beverage-related accessories and equipment, primarily through Company-operated retail stores. Starbucks also sells coffee and tea products and licenses its trademark through other channels such as licensed retail stores and, through certain of its licensees and equity investees, Starbucks produces and sells a variety of ready-to-drink beverages. All channels outside the Company-operated retail stores are collectively known as specialty operations. The Company’s objective is to maintain Starbucks standing as one of the most recognized and respected brands in the world. To achieve this goal, the Company plans to continue disciplined global expansion of its retail and licensed store base, to introduce relevant new products in all its channels, and to selectively develop new channels of distribution. The Company’s Global Responsibility strategy and commitments related to coffee and the commu- nities it does business in, as well as its focus on being an employer of choice, are also key complements to its business strategies. Segment Financial Information Starbucks has three reportable operating segments, and each segment provided the indicated percentage of total net revenues for fiscal year ended September 27, 2009 (“fiscal 2009”): United States (“US”) (73%), International (19%) and Global Consumer Products Group (“CPG”) (8%). In the fourth fiscal quarter of 2009, the Company changed the composition of its reportable segments. The US foodservice business, which was previously reported in the US segment, is now reported in the CPG segment, as a result of internal management realignments within the US and CPG businesses. Segment information for all prior periods presented has been revised to reflect this change. The US and International segments both include Company-operated retail stores and certain components of specialty operations. Specialty operations within the US include licensed retail stores and other initiatives related to the Company’s core business. International specialty operations primarily consist of retail store licensing operations in nearly 40 countries and foodservice accounts in Canada and the United Kingdom (“UK”). The International segment’s largest markets, based on number of Company-operated and licensed retail stores, are Canada, Japan and the UK. The CPG segment includes packaged coffee and tea, and other branded products sold worldwide through channels such as grocery stores, warehouse clubs and convenience stores, and US foodservice accounts. CPG operates a significant portion of its business through licensing arrangements and joint ventures with large consumer products business partners. This operating model leverages the business partners’ existing infrastructures and as a result, the CPG segment reflects relatively lower revenues, a modest cost structure, and a resulting higher operating margin, compared to the Company’s other two reporting segments, which consist primarily of retail stores. Financial information about Starbucks segments is included in Note 18 to the consolidated financial statements included in Item 8 of this Annual Report on Form 10-K (“10-K” or “Report”). 1
  • 10.
    Revenue Components Revenue componentsas a percentage of total net revenues and related specialty revenues for the fiscal year ended September 27, 2009: % of % of Total Net Specialty Revenues Revenues Revenues Company-operated retail . . . . . . . . . . . . . . . . . . . . . . . . . . . . . . . . . . . . . . . . . 84% Specialty: Licensing: Retail stores . . . . . . . . . . . . . . . . . . . . . . . . . . . . . . . . . . . . . . . . . . . . . . 8 50% Packaged coffee and tea . . . . . . . . . . . . . . . . . . . . . . . . . . . . . . . . . . . . . . 4 23 Branded products . . . . . . . . . . . . . . . . . . . . . . . . . . . . . . . . . . . . . . . . . . . 1 4 Total licensing . . . . . . . . . . . . . . . . . . . . . . . . . . . . . . . . . . . . . . . . . . . . . . . 12 77 Foodservice and other: Foodservice . . . . . . . . . . . . . . . . . . . . . . . . . . . . . . . . . . . . . . . . . . . . . . . 4 23 Other initiatives . . . . . . . . . . . . . . . . . . . . . . . . . . . . . . . . . . . . . . . . . . . . 1 1 Total foodservice and other . . . . . . . . . . . . . . . . . . . . . . . . . . . . . . . . . . . . . 4 23 Total specialty . . . . . . . . . . . . . . . . . . . . . . . . . . . . . . . . . . . . . . . . . . . . . . . . 16 100% Total net revenues . . . . . . . . . . . . . . . . . . . . . . . . . . . . . . . . . . . . . . . . . . . . . . 100% Company-operated and Licensed Retail Store Summary as of September 27, 2009 As a% of Total As a% of Total International As a% of US US Stores International Stores Total Total Stores Company-operated stores . . . . 6,764 61% 2,068 38% 8,832 53% Licensed stores . . . . . . . . . . . 4,364 39 3,439 62 7,803 47 Total . . . . . . . . . . . . . . . . . 11,128 100% 5,507 100% 16,635 100% Starbucks mix of Company-operated versus licensed stores in a given market will vary based on several factors. Some of these factors include the ability to access desirable local retail space, the complexity and expected ultimate size of the market for Starbucks, and the ability to leverage the Company’s support infrastructure in an existing geographic region. Company-operated Retail Stores The Company’s retail goal is to become the leading retailer and brand of coffee in each of its target markets by selling the finest quality coffee and related products, and by providing each customer a unique Starbucks Experience. The Starbucks Experience is built upon superior customer service as well as clean and well-maintained Company-operated retail stores that reflect the personalities of the communities in which they operate, thereby building a high degree of customer loyalty. Starbucks disciplined strategy for expanding its global retail business is to increase its market share by selectively opening additional stores in existing markets, opening stores in new markets, and increasing sales in existing stores, to support its long term strategic objectives. Store growth in specific existing markets will vary due to many factors, including the maturity of the market. As described in more detail in Management’s Discussion and Analysis in this 10-K, Starbucks has taken a number of actions in fiscal 2008 and 2009 to rationalize its store portfolio. These actions have included plans (announced in July 2008 and January 2009) to close a total of approximately 800 Company-operated stores in the US, restructure its 2
  • 11.
    Australia market, andclose approximately 100 additional Company-operated stores internationally. As of the end of fiscal 2009, nearly all of the approximately 800 US stores, 61 stores in Australia and 41 stores in other International markets have been closed. The remaining International closures are expected to be completed by the end of fiscal 2010. Starbucks Company-operated retail stores accounted for 84% of total net revenues during fiscal 2009. Summary of total Company-operated retail store data for the periods indicated: Net Stores Opened (Closed) During the Fiscal Year Ended(1) Stores Open as of Sep 27, 2009 Sep 28, 2008 Sep 27, 2009 Sep 28, 2008 US(2) . . . . . . . . . . . . . . . . . . . . . . . . . . . . . . (474) 445 6,764 7,238 International(3): Canada . . . . . . . . . . . . . . . . . . . . . . . . . 44 104 775 731 United Kingdom . . . . . . . . . . . . . . . . . . 2 84 666 664 China . . . . . . . . . . . . . . . . . . . . . . . . . . 13 37 191 178 Germany. . . . . . . . . . . . . . . . . . . . . . . . 13 27 144 131 Thailand . . . . . . . . . . . . . . . . . . . . . . . . 4 24 131 127 Singapore . . . . . . . . . . . . . . . . . . . . . . . 7 12 64 57 Australia . . . . . . . . . . . . . . . . . . . . . . . . — (64) 23 23 Other . . . . . . . . . . . . . . . . . . . . . . . . . . 6 12 74 68 Total International . . . . . . . . . . . . . . . . . . 89 236 2,068 1,979 Total Company-operated . . . . . . . . . . . . . . . . (385) 681 8,832 9,217 (1) Store openings are reported net of closures. (2) Of the approximately 800 total US stores identified for closure, 566 stores and 205 stores were closed in fiscal 2009 and 2008, respectively. (3) Starbucks restructured its Australia market by closing 61 stores in fiscal 2008. Of the approximately 100 International stores (incremental to the Australia closures in fiscal 2008) identified for closure, 41 stores were closed in various markets in fiscal 2009. Starbucks retail stores are typically located in high-traffic, high-visibility locations. Because the Company can vary the size and format, its stores are located in or near a variety of settings, including downtown and suburban retail centers, office buildings and university campuses. The Company also locates retail stores in select rural and off- highway locations to serve a broader array of customers outside major metropolitan markets. To provide a greater degree of access and convenience for nonpedestrian customers, the Company continues to selectively expand development of drive-thru retail stores. At the end of fiscal 2009, the Company operated approximately 2,650 drive- thru locations, representing approximately 35% of Company-operated stores in the US and Canada combined. Starbucks stores offer a choice of regular and decaffeinated coffee beverages, a broad selection of Italian-style espresso beverages, cold blended beverages, iced shaken refreshment beverages, a selection of premium teas, distinctively packaged roasted whole bean coffees, and its recently launched soluble coffee Starbucks VIATM Ready Brew (“VIA”). Starbucks stores also offer a variety of fresh food items, including healthier choice selections focusing on high-quality ingredients, nutritional value and great flavor. Food items include pastries, prepared breakfast and lunch sandwiches, oatmeal, and salads as well as sodas, juices and bottled water. Starbucks continues to expand its food warming program in the US and Canada, with approximately three-quarters of the stores in these markets providing warm food items, primarily breakfast sandwiches, as of September 27, 2009. A selection of beverage-making equipment and accessories are also sold in the stores. Each Starbucks store varies its product mix depending upon the size of the store and its location. Larger stores carry a broad selection of the Company’s whole bean coffees in various sizes and types of packaging, as well as coffee and espresso-making equipment and accessories. Smaller Starbucks stores and kiosks typically sell a full line of coffee beverages, a limited selection of whole bean coffees and a smaller selection of coffee and beverage-related accessories. 3
  • 12.
    Retail sales mixby product type for Company-operated stores: Fiscal Year Ended Sep 27, 2009 Sep 28, 2008 Sep 30, 2007 Beverages . . . . . . . . . . . . . . . . . . . . . . . . . . . . . . . ...... 76% 76% 75% Food . . . . . . . . . . . . . . . . . . . . . . . . . . . . . . . . . . . ...... 18% 17% 17% Coffee-making equipment and other merchandise . . ...... 3% 4% 5% Whole bean coffees . . . . . . . . . . . . . . . . . . . . . . . . ...... 3% 3% 3% Total . . . . . . . . . . . . . . . . . . . . . . . . . . . . . . . . . . . . . . . . . 100% 100% 100% Starbucks Card The Starbucks Card program is designed to increase customer loyalty and the frequency of store visits by cardholders. Starbucks cards can be used in all Company-operated and most licensed stores in North America, and in a growing number of international markets. The cards have no expiration date and do not have any inactivity fees. Specialty Operations Specialty operations strive to develop the Company’s brands outside the Company-operated retail store environ- ment through a number of channels. Starbucks strategy is to reach customers where they work, travel, shop and dine by establishing relationships with prominent third parties that share the Company’s values and commitment to quality. These relationships take various forms, including licensing arrangements, foodservice accounts and other initiatives related to the Company’s core businesses. In certain situations, Starbucks has an equity ownership interest in licensee operations. During fiscal 2009, specialty revenues (which include royalties and fees from licensees, as well as product sales derived from specialty operations) accounted for 16% of total net revenues. Licensing — Retail stores In its licensed retail store operations which include the Starbucks and Seattle’s Best Coffee brands, the Company leverages the expertise of its local partners and shares the Company’s operating and store development experience. Licensee partners provide improved, and at times the only, access to desirable retail space. Most licensees are prominent retailers with in-depth market knowledge and access. As part of these arrangements, Starbucks receives royalties and license fees and sells coffee, tea and related products for resale in licensed locations. Product sales to and royalty and license fee revenues from US and International licensed retail stores accounted for 50% of specialty revenues in fiscal 2009. Employees working in licensed retail locations are required to follow Starbucks detailed store operating procedures and attend training classes similar to those given to employees in Company-operated stores. Starbucks total licensed retail stores by region and specific location at fiscal year end 2009: Asia Pacific Europe/Middle East/Africa Americas Japan . . . . . . . . . . . . . . 875 Turkey . . . . . . . . . . . . . 123 US . . . . . . . . . . . . . . . . 4,364 South Korea . . . . . . . . . 288 United Arab Emirates . . 91 Canada . . . . . ........ 262 China . . . . . . . . . . . . . . 283 Spain . . . . . . . . . . . . . . 76 Mexico . . . . . ........ 261 Taiwan . . . . . . . . . . . . . 222 Greece . . . . . . . . . . . . . 69 Other . . . . . . ........ 69 Philippines . . . . . . . . . . 160 Saudi Arabia . . . . . . . . . 68 Malaysia . . . . . . . . . . . . 118 Kuwait . . . . . . . . . . . . . 62 Indonesia . . . . . . . . . . . 74 France. . . . . . . . . . . . . . 52 New Zealand . . . . . . . . . 42 Switzerland . . . . . . . . . . 47 U.K. . . . . . . . . . . . . . . . 46 Other . . . . . . . . . . . . . . 151 Total . . . . . . . . . . . . . . . 2,062 Total . . . . . . . . . . . . . . . 785 Total . . . . . . . . . . . . . . . 4,956 During fiscal 2009, net licensed store openings included 35 in the US and 305 internationally. 4
  • 13.
    Licensing — Packagedcoffee and tea Through a licensing relationship with Kraft Foods, Inc. (“Kraft”), the Company sells a selection of Starbucks and Seattle’s Best Coffee branded packaged coffees and Tazo» teas in grocery and warehouse club stores throughout the US. Kraft manages all distribution, marketing, advertising and promotion of these products. The Company sells packaged coffee and tea internationally both directly to warehouse club stores, such as Costco Wholesale Corporation, and to grocery stores through a licensing relationship with Kraft in Canada, the UK and other European countries. The Company’s coffees and teas are available in approximately 39,000 grocery and warehouse club stores, with 33,500 in the US and 5,500 in International markets. Revenues from this category comprised 23% of specialty revenues in fiscal 2009. Licensing — Branded products The Company licenses the rights to produce and market Starbucks branded products through several partnerships both domestically and internationally. Significant licensing agreements include: • The North American Coffee Partnership, a joint venture with the Pepsi-Cola Company in which Starbucks is a 50% equity investor, manufactures and markets ready-to-drink beverages, including bottled Frappuccino» beverages and Starbucks DoubleShot» espresso drinks in US and Canada; • licensing agreements for the manufacturing, marketing and distribution of Starbucks Discoveries», a ready-to-drink chilled cup coffee beverage, and Starbucks DoubleShot» espresso drinks in Japan and South Korea; • a licensing agreement with a partnership formed by Unilever and Pepsi-Cola Company for the manufac- turing, marketing and distribution of Starbucks super-premium Tazo» Tea ready-to-drink beverages in the US; and • a licensing agreement with Unilever for the manufacturing, marketing and distribution of Starbucks super- premium ice cream products in the US. Collectively, the revenues from these branded products accounted for 4% of specialty revenues in fiscal 2009. Foodservice The Company sells whole bean and ground coffees, including the Starbucks and Seattle’s Best Coffee brands, as well as a selection of premium Tazo» teas, VIA and other related products, to institutional foodservice companies that service business and industry, education, healthcare, office coffee distributors, hotels, restaurants, airlines and other retailers. The majority of the Company’s sales in this channel come through national broadline distribution networks with SYSCO Corporation, US FoodserviceTM, and other distributors. The Company’s total foodservice operations had over 21,000 accounts, primarily in the US, at fiscal year end 2009. Revenues from foodservice accounts comprised 23% of total specialty revenues in fiscal 2009. Product Supply Starbucks is committed to selling only the finest whole bean coffees and coffee beverages. To ensure compliance with its rigorous coffee standards, Starbucks controls its coffee purchasing, roasting and packaging, and the global distribution of coffee used in its operations. The Company purchases green coffee beans from coffee-producing regions around the world and custom roasts them to its exacting standards for its many blends and single origin coffees. The supply and price of coffee are subject to significant volatility. Although most coffee trades in the commodity market, high-altitude arabica coffee of the quality sought by the Company tends to trade on a negotiated basis at a substantial premium above commodity coffee prices, depending upon the supply and demand at the time of purchase. Supply and price can be affected by multiple factors in the producing countries, including weather, 5
  • 14.
    political and economicconditions. In addition, green coffee prices have been affected in the past, and may be affected in the future, by the actions of certain organizations and associations that have historically attempted to influence prices of green coffee through agreements establishing export quotas or by restricting coffee supplies. To help ensure sustainability and future supply of high-quality green coffees and to reinforce the Company’s leadership role in the coffee industry, Starbucks operates Farmer Support Centers in Costa Rica and Rwanda. The Farmer Support Centers are staffed with agronomists and sustainability experts who work with coffee farming communities to promote best practices in coffee production designed to improve both coffee quality and yields. The Company buys coffee using fixed-price and price-to-be-fixed purchase commitments, depending on market conditions, to secure an adequate supply of quality green coffee. As of September 27, 2009, the Company had $238 million of purchase commitments which, together with existing inventory, is expected to provide an adequate supply of green coffee through fiscal 2010. The Company depends upon its relationships with coffee producers, outside trading companies and exporters for its supply of green coffee. The Company believes, based on relationships established with its suppliers, the risk of non- delivery on such purchase commitments is remote. In addition to coffee, the Company also purchases significant amounts of dairy products, particularly fluid milk, to support the needs of its Company-operated retail stores. The Company’s highest volume of dairy purchases are in the US, Canada and the UK. For these markets, Starbucks purchases substantially all of its fluid milk requirements from six dairy suppliers. The Company believes, based on relationships established with these suppliers, the risk of non-delivery of sufficient fluid milk to support these retail businesses is remote. Products other than whole bean coffees and coffee beverages sold in Starbucks retail stores are obtained through a number of different channels. Beverage ingredients other than coffee and milk, including leaf teas and the Company’s selection of ready-to-drink beverages, are purchased from several specialty suppliers, usually under long-term supply contracts. Food products, such as fresh pastries, breakfast sandwiches and lunch items, are purchased from national, regional and local sources. Coffee-making equipment, such as drip and coffee press coffeemakers, espresso machines and coffee grinders, are generally purchased directly from their manufacturers. Beverage-related accessories, including items bearing the Company’s logos and trademarks, are produced and distributed through contracts with a number of different suppliers. The Company also purchases a broad range of paper and plastic products, such as cups and cutlery, from several companies to support the needs of its retail stores as well as its manufacturing and distribution operations. The Company believes, based on relationships established with these suppliers and manufacturers, the risk of non-delivery is remote. Competition The Company’s primary competitors for coffee beverage sales are quick-service restaurants and specialty coffee shops. In almost all markets in which the Company does business, there are numerous competitors in the specialty coffee beverage business, and management expects this situation to continue. The Company believes that its customers choose among specialty coffee retailers primarily on the basis of product quality, service and conve- nience, as well as price. Starbucks has been experiencing greater direct competition from large competitors in the US quick-service restaurant sector and continues to face competition from well-established companies in many International markets and in the US ready-to-drink coffee beverage market. The Company’s whole bean coffees and ground packaged coffees compete directly against specialty coffees sold through supermarkets, club stores and specialty retailers. The Company’s whole bean coffees, its coffee beverages, and its recently launched soluble coffee VIA, compete indirectly against all other coffees on the market. Starbucks specialty operations face significant competition from established wholesale and mail order suppliers, some of whom have greater financial and marketing resources than the Company. Starbucks also faces competition from both restaurants and other specialty retailers for prime retail locations and qualified personnel to operate both new and existing stores. 6
  • 15.
    Patents, Trademarks, Copyrightsand Domain Names The Company owns and has applied to register numerous trademarks and service marks in the US and in many additional countries throughout the world. Some of the Company’s trademarks, including Starbucks, the Starbucks logo, Frappuccino, Seattle’s Best Coffee and Tazo are of material importance to the Company. The duration of trademark registrations varies from country to country. However, trademarks are generally valid and may be renewed indefinitely as long as they are in use and/or their registrations are properly maintained. The Company owns numerous copyrights for items such as product packaging, promotional materials, in-store graphics and training materials. The Company also holds patents on certain products, systems and designs. In addition, the Company has registered and maintains numerous Internet domain names, including “Starbucks.com”, “Starbucks.net”, and “Seattlesbest.com.” Research and Development Starbucks research and development teams are responsible for the technical development of food and beverage products and new equipment. The Company spent approximately $6.5 million, $7.2 million and $7.0 million during fiscal 2009, 2008 and 2007, respectively, on technical research and development activities, in addition to customary product testing and product and process improvements in all areas of its business. Seasonality and Quarterly Results The Company’s business is subject to seasonal fluctuations, including fluctuations resulting from the holiday season. The Company’s cash flows from operations are considerably higher in the first fiscal quarter than the remainder of the year. This is largely driven by cash received as Starbucks Cards are purchased and loaded during the holiday season. Since revenues from the Starbucks Card are recognized upon redemption and not when purchased, seasonal fluctuations on the consolidated statements of earnings are much less pronounced. Quarterly results are affected by the timing of the opening of new stores and the closing of existing stores. For these reasons, results for any quarter are not necessarily indicative of the results that may be achieved for the full fiscal year. Employees The Company employed approximately 142,000 people worldwide as of September 27, 2009. In the US, Starbucks employed approximately 111,000 people, with 105,000 in Company-operated retail stores and the remainder in the Company’s administrative and regional offices, and store development, roasting and warehousing operations. Approximately 31,000 employees were employed outside of the US, with 30,000 in Company-operated retail stores and the remainder in the Company’s regional support facilities and roasting and warehousing operations. The number of the Company’s employees represented by unions is not significant. Starbucks believes its current relations with its employees are good. Global Responsibility Starbucks is committed to being a deeply responsible company in the communities where it does business around the world. The Company’s focus is on ethically sourcing high-quality coffee, reducing its environmental impacts and contributing positively to communities. Starbucks Global Responsibility strategy and commitments are integral to the Company’s overall business strategy. As a result, Starbucks believes it delivers benefits to the Company and its stakeholders, including employees, business partners, customers, suppliers, shareholders, community members and others. For an overview of Starbucks Global Responsibility strategy and commitments, please visit www.starbucks.com. Available Information Starbucks 10-K reports, along with all other reports and amendments filed with or furnished to the Securities and Exchange Commission (“SEC”), are publicly available free of charge on the Investor Relations section of Starbucks website at http://investor.starbucks.com or at www.sec.gov as soon as reasonably practicable after these materials 7
  • 16.
    are filed withor furnished to the SEC. The Company’s corporate governance policies, code of ethics and Board committee charters and policies are also posted on the Investor Relations section of Starbucks website at http://investor.starbucks.com. The information on the Company’s website is not part of this or any other report Starbucks files with, or furnishes to, the SEC. Item 1A. Risk Factors Starbucks is including this Cautionary Statement to make applicable and take advantage of the safe harbor provisions of the Private Securities Litigation Reform Act of 1995 (the “Act”) for forward-looking statements. This 10-K includes forward-looking statements within the meaning of the Act. Forward-looking statements can be identified by the fact that they do not relate strictly to historical or current facts. They often include words such as “believes,” “expects,” “anticipates,” “estimates,” “intends,” “plans,” “seeks” or words of similar meaning, or future or conditional verbs, such as “will,” “should,” “could,” “may,” “aims,” “intends,” or “projects.” A forward-looking statement is neither a prediction nor a guarantee of future events or circumstances, and those future events or circumstances may not occur. Investors should not place undue reliance on the forward-looking statements, which speak only as of the date of this Report. These forward-looking statements are all based on currently available operating, financial and competitive information and are subject to various risks and uncertainties. The Company’s actual future results and trends may differ materially depending on a variety of factors, including, but not limited to, the risks and uncertainties discussed below. If any of the risks and uncertainties described in the cautionary factors described below actually occurs, Starbucks business, financial condition and results of operations could be materially and adversely affected. The factors listed below are not exhaustive. Other sections of this 10-K include additional factors that could materially and adversely impact Starbucks business, financial condition and results of operations. Moreover, Starbucks operates in a very competitive and rapidly changing environment. New factors emerge from time to time and it is not possible for management to predict the impact of all these factors on Starbucks business, financial condition or results of operation or the extent to which any factor, or combination of factors, may cause actual results to differ materially from those contained in any forward-looking statements. Given these risks and uncertainties, investors should not rely on forward-looking statements as a prediction of actual results. Any or all of the forward-looking statements contained in this 10-K and any other public statement made by Starbucks or its management may turn out to be incorrect. Starbucks expressly disclaims any obligation to update or revise any forward-looking statements, whether as a result of new information, future events or otherwise. • Starbucks financial condition and results of operations are sensitive to, and may be adversely affected by, a number of factors, many of which are largely outside the Company’s control. The Company’s operating results have been in the past and will continue to be subject to a number of factors, many of which are largely outside the Company’s control. Any one or more of the factors set forth below could adversely impact Starbucks business, financial condition and/or results of operations: • lower customer traffic or average value per transaction, which negatively impacts comparable store sales, net revenues, operating income, operating margins and earnings per share, due to: • the impact of initiatives by competitors and increased competition generally; • customers trading down to lower priced products within Starbucks, and/or shifting to competitors with lower priced products; • lack of customer acceptance of new products or price increases necessary to cover costs of new products and/or higher input costs; • unfavorable general economic conditions in the markets in which Starbucks operates that adversely affect consumer spending; • declines in general consumer demand for specialty coffee products; or 8
  • 17.
    • adverse impactsresulting from negative publicity regarding the Company’s business practices or the health effects of consuming its products; • cost increases that are either wholly or partially beyond the Company’s control, such as: • commodity costs for commodities that can only be partially hedged, such as fluid milk, and to a lesser extent, high quality arabica coffee (See also the discussion under “Product Supply” in Item 1); • labor costs such as increased health care costs, general market wage levels and workers’ compensation insurance costs; • litigation against Starbucks, particularly class action litigation; • construction costs associated with new store openings; or • information technology costs and other logistical resources necessary to maintain and support the global growth of the Company’s business; • delays in store openings for reasons beyond the Company’s control, or a lack of desirable real estate locations available for lease at reasonable rates, either of which could keep the Company from meeting annual store opening targets and, in turn, negatively impact net revenues, operating income and earnings per share; • any material interruption in the Company’s supply chain beyond its control, such as material interruption of roasted coffee supply due to the casualty loss of any of the Company’s roasting plants or the failures of third- party suppliers, or interruptions in service by common carriers that ship goods within the Company’s distribution channels, or trade restrictions, such as increased tariffs or quotas, embargoes or customs restrictions; and • the impact on Starbucks business of factors such as labor discord, war, terrorism (including incidents targeting Starbucks), political instability in certain markets and natural disasters. • The Company may not be successful in implementing important strategic initiatives, which may have a material adverse impact on its business and financial results. There is no assurance that the Company will be able to implement important strategic initiatives in accordance with its expectations, which may result in a material adverse impact on the Company’s business and financial results. These strategic initiatives are designed to drive long-term shareholder value and improve Starbucks results of operations, and include: • ongoing initiatives to improve the current state of the business by refocusing on the customer experience in the stores, new products and store design elements, and new training and tools for the Company’s store partners to help them give customers a superior experience; • balancing disciplined global store growth while meeting target store-level unit economics in a given market; • executing a multi-channel advertising and marketing campaign to effectively communicate the Company’s message directly to Starbucks consumers and partners; and • focusing on relevant innovation and profitable growth platforms, such as the recent introduction of Starbucks soluble coffee, VIA. • Economic conditions in the US and certain International markets could adversely affect the Company’s business and financial results. As a retailer that is dependent upon consumer discretionary spending, the Company’s results of operations are sensitive to changes in macro-economic conditions. Starbucks customers may have less money for discretionary purchases as a result of job losses, foreclosures, bankruptcies, reduced access to credit and falling home prices. Any resulting decreases in customer traffic or average value per transaction will negatively impact the Company’s 9
  • 18.
    financial performance asreduced revenues result in sales de-leveraging which creates downward pressure on margins. There is also a risk that if negative economic conditions persist for a long period of time, consumers may make long-lasting changes to their discretionary purchasing behavior, including less frequent discretionary purchases on a more permanent basis. • Failure to meet market expectations for Starbucks financial performance will likely adversely affect the market price and volatility of Starbucks stock. The Company’s failure to meet market expectations going forward, particularly with respect to operating margins, earnings per share, comparable store sales, and net revenues, will likely result in a decline and/or increased volatility in the market price of Starbucks stock. • Starbucks is highly dependent on the financial performance of its US operating segment. The Company’s financial performance is highly dependent on its US operating segment, which comprised approximately three-quarters of consolidated total net revenues in fiscal 2009. The Company continued to experience negative traffic in its US stores in fiscal 2009, which adversely affected the operating results of the US segment and the Company as a whole. Although the US segment’s operating results improved in fiscal 2009 compared to fiscal 2008 due to the Company’s restructuring efforts, if improvements in its financial performance do not continue, the Company’s business and financial results will continue to be adversely affected. • Starbucks is increasingly dependent on the success of its International operating segment in order to achieve its growth targets. The Company’s future growth increasingly depends on the growth and sustained profitability of its International operating segment. Some or all of the Company’s International market business units (“MBUs”), which Starbucks generally defines by the countries or regions in which they operate, may not be successful in their operations or in achieving expected growth, which ultimately requires achieving consistent, stable net revenues and earnings. The performance of the International operating segment may be adversely affected by economic downturns in one or more of the Company’s large MBUs. Additionally, some factors that will be critical to the success of International MBUs are different than those affecting the Company’s US stores and licensees. Tastes naturally vary by region, and consumers in new international markets into which Starbucks and its licensees expand may not embrace Starbucks products to the same extent as consumers in the Company’s existing markets. Occupancy costs and store operating expenses are also sometimes higher internationally than in the US due to higher rents for prime store locations or costs of compliance with country-specific regulatory requirements. Because many of the Company’s International operations are in an early phase of development, operating expenses as a percentage of related revenues are often higher compared to US operations. The Company’s International operations are also subject to additional inherent risks of conducting business abroad, such as: • foreign currency exchange rate fluctuations; • changes or uncertainties in economic, legal, regulatory, social and political conditions in the Company’s markets; • interpretation and application of laws and regulations; • restrictive actions of foreign or US governmental authorities affecting trade and foreign investment, including protective measures such as export and customs duties and tariffs and restrictions on the level of foreign ownership; • import or other business licensing requirements; • the enforceability of intellectual property and contract rights; • limitations on the repatriation of funds and foreign currency exchange restrictions; 10
  • 19.
    • in developingeconomies, the growth rate in the portion of the population achieving targeted levels of disposable income may not be as fast as the Company forecasts; • difficulty in staffing, developing and managing foreign operations, including ensuring the consistency of product quality and service, due to distance, language and cultural differences; and • local laws that make it more expensive and complex to negotiate with, retain or terminate employees. Moreover, many of the foregoing risks are particularly acute in developing countries, which are important to the Company’s long-term growth prospects. • Starbucks International operating segment is highly dependent on the financial performance of its Canada, Japan and UK market. Starbucks Canada, Japan and UK markets account for a significant portion of the net revenues and profit contribution of the Company’s International operating segment. Any significant decline in the financial perfor- mance of one of these key markets may have a material adverse impact on the results of operations of the entire International operating segment, if not partially or fully offset by positive financial performance from the other two major markets. • Starbucks faces intense competition in the specialty coffee market, which could lead to reduced profitability. A description of the general competitive conditions in which Starbucks operates appears under “Competition” in Item 1. In the US, the continued focus by one or more large competitors in the quick-service restaurant sector on selling high-quality specialty coffee beverages at a low cost has attracted Starbucks customers and could, if the numbers become large enough, adversely affect the Company’s sales and results of operations. Similarly, continued competition from well-established competitors in international markets could hinder growth and adversely affect the Company’s sales and results of operations in those markets. The Company faces increased competition from larger well-known competitors which have greater resources. Increasing competition from the US packaged coffee and tea and ready-to-drink coffee beverage markets could adversely affect the profitability of the CPG segment and the Company’s results of operations. Given its premium brand, Starbucks may be impacted more severely than its competitors by customers trading down to lower priced coffee beverages and related products. • A regional or global health pandemic could severely affect Starbucks business. A health pandemic is a disease outbreak that spreads rapidly and widely by infection and affects many individuals in an area or population at the same time. If a regional or global health pandemic were to occur, depending upon its duration and severity, the Company’s business could be severely affected. Starbucks has positioned itself as a third place between home and work where people can gather together for human connection. Customers might avoid public gathering places in the event of a health pandemic, and local, regional or national governments might limit or ban public gatherings to halt or delay the spread of disease. A regional or global health pandemic might also adversely impact the Company’s business by disrupting or delaying production and delivery of materials and products in its supply chain and by causing staffing shortages in its stores. The impact of a health pandemic on Starbucks might be disproportionately greater than on other companies that depend less on the gathering of people together for the sale, use or license of their products and services. • The Company’s success depends substantially on the value of the Starbucks brand. Starbucks believes it has built an excellent reputation globally for the quality of its products, for delivery of a consistently positive consumer experience and for its corporate social responsibility programs. The Starbucks brand has been highly rated in several global brand value studies. To be successful in the future, particularly outside of US, where the Starbucks brand is less well-known, management believes it must preserve, grow and leverage the value of the Starbucks brand across its sales channels. Brand value is based in part on consumer perceptions as to a variety of subjective qualities. Even isolated business incidents that erode consumer trust, particularly if the incidents 11
  • 20.
    receive considerable publicityor result in litigation, can significantly reduce brand value. Consumer demand for the Company’s products and its brand equity could diminish significantly if Starbucks fails to preserve the quality of its products, is perceived to act in an unethical or socially irresponsible manner or fails to deliver a consistently positive consumer experience in each of its markets. • The Company’s business depends in large part on the success of its business partners and suppliers, and the Company’s brand and reputation may be harmed by actions taken by third parties that are outside of the Company’s control. The Company’s business strategy, including its plans for new stores, foodservice, branded products and other initiatives, relies significantly on a variety of licensee and partnership relationships, particularly in its International markets. Licensees are often authorized to use the Starbucks logo and provide Starbucks-branded beverages, food and other products directly to customers. The Company provides training and support to, and monitors the operations of, these business partners, but the product quality and service they deliver to Starbucks customers may be diminished by any number of factors beyond the Company’s control, including financial pressures. Management believes customers expect the same quality of products and service from the Company’s licensees as they do from Starbucks and the Company strives to ensure customers have the same experience whether they visit a Company- operated or licensed store. Any shortcoming of a Starbucks business partner, particularly an issue affecting the quality of the service experience or the safety of beverages or food, may be attributed by customers to Starbucks, thus damaging the Company’s reputation and brand value and potentially affecting the results of operations. The Company’s products and in particular, its coffee and tea products, are sourced from a wide variety of domestic and international vendors. The Company relies on international vendors to provide high quality product that comply with applicable laws. The Company’s ability to find qualified vendors who meet our standards and supply products in a timely and efficient manner is a significant challenge, especially with respect to goods sourced from outside the US. These issues could negatively impact the Company’s business and profitability. • The loss of key personnel or difficulties recruiting and retaining qualified personnel could jeopardize the Company’s ability to meet its financial targets. The Company’s success depends substantially on the contributions and abilities of key executives and other employees, and on its ability to recruit and retain high quality employees to work in and manage Starbucks stores. Starbucks must continue to recruit, retain and motivate management and other employees sufficient to maintain its current business and support its projected growth. A loss of key employees or a significant shortage of high quality store employees could jeopardize the Company’s ability to meet its financial targets. • Effectively managing the Company’s growth is challenging. Effectively managing growth can be challenging, particularly as Starbucks expands into new markets interna- tionally, where it must balance the need for flexibility and a degree of autonomy for local management against the need for consistency with the Company’s goals, philosophy and standards. Growth can make it increasingly difficult to ensure a consistent supply of high quality raw materials, to locate and hire sufficient numbers of key employees to meet the Company’s financial targets, to maintain an effective system of internal controls for a globally dispersed enterprise and to train employees worldwide to deliver a consistently high quality product and customer experience. • Adverse public or medical opinions about the health effects of consuming the Company’s products, as well as reports of incidents involving food-borne illnesses or food tampering, whether or not accurate, could harm its business. Some Starbucks products contain caffeine, dairy products, sugar and other active compounds, the health effects of which are the subject of increasing public scrutiny, including the suggestion that excessive consumption of caffeine, dairy products, sugar and other active compounds can lead to a variety of adverse health effects. There has also been greater public awareness that sedentary lifestyles, combined with excessive consumption of high-calorie foods, have led to a rapidly rising rate of obesity. Particularly in the US, there is increasing consumer awareness of health 12
  • 21.
    risks, including obesity,due in part to increasing publicity and attention from health organizations, as well as increased consumer litigation based on alleged adverse health impacts of consumption of various food products. While Starbucks has a variety of healthier choice beverage and food items, including items that are low in caffeine and calories, an unfavorable report on the health effects of caffeine or other compounds present in the Company’s products, or negative publicity or litigation arising from other health risks such as obesity, could significantly reduce the demand for the Company’s beverages and food products. Similarly, instances or reports, whether true or not, of unclean water supply, food-borne illnesses and food tampering have in the past severely injured the reputations of companies in the food processing, grocery and quick- service restaurant sectors and could in the future affect the Company as well. Any report linking Starbucks to the use of unclean water, food-borne illnesses or food tampering could damage its brand value, immediately and severely hurt sales of its beverages and food products, and possibly lead to product liability claims. Clean water is critical to the preparation of specialty coffee beverages. The Company’s ability to ensure a clean water supply to its stores is limited, particularly in some International locations. If customers become ill from food-borne illnesses, the Company could also be forced to temporarily close some stores. In addition, instances of food-borne illnesses or food tampering, even those occurring solely at the restaurants or stores of competitors, could, by resulting in negative publicity about the foodservice industry, adversely affect Starbucks sales on a regional or global basis. A decrease in customer traffic as a result of these health concerns or negative publicity, or as a result of a temporary closure of any of the Company’s stores, could materially harm the Company’s business and results of operations. • Deterioration in operating performance could lead to increased leverage, which may harm the Company’s financial condition and results of operations. Any reduction in cash flow relative to the level of the Company’s financial obligations would result in an increase in leverage. Any increase in leverage could lead to deterioration in Starbucks credit ratings, which could limit the availability of additional financing and increase its cost of obtaining financing. In addition, an increase in leverage could raise the likelihood of a financial covenant breach which in turn could limit the Company’s access to existing funding under its credit facility. The Company’s ability to satisfy its operating lease obligations and make payments of principal and interest on its indebtedness depends on its future performance. Should the Company experience deterioration in operating performance, it will have less cash flow available to meet these obligations. In addition, if such deterioration were to lead to the closure of underperforming stores, the Company would need to fund the costs of terminating store leases. If Starbucks is unable to generate sufficient cash flow from operations in the future to satisfy these financial obligations, it may be required to, among other things: • seek additional financing in the debt or equity markets; • refinance or restructure all or a portion of its indebtedness; • sell selected assets; or • reduce or delay planned capital or operating expenditures. Such measures might not be sufficient to enable Starbucks to satisfy its financial obligations. In addition, any such financing, refinancing or sale of assets might not be available on economically favorable terms. • Starbucks relies heavily on information technology in its operations, and any material failure, inadequacy, interruption or security failure of that technology could harm the Company’s ability to effectively operate its business. Starbucks relies heavily on information technology systems across its operations, including for management of its supply chain, point-of-sale processing in its stores, and various other processes and transactions. The Company’s ability to effectively manage its business and coordinate the production, distribution and sale of its products depends significantly on the reliability and capacity of these systems. The failure of these systems to operate effectively, problems with transitioning to upgraded or replacement systems, or a breach in security of these systems could 13
  • 22.
    cause delays inproduct sales and reduced efficiency of the Company’s operations, and significant capital investments could be required to remediate the problem. • Failure of the Company to comply with applicable laws and regulations could harm its business and financial results. Starbucks policies and procedures are designed to comply with all applicable laws and regulations, including those imposed by the SEC, NASDAQ, and foreign countries, as well as applicable labor laws. Additional legal and regulatory requirements, together with the fact that foreign laws occasionally conflict with domestic laws, increase the complexity of the regulatory environment in which the Company operates and the related cost of compliance. Failure to comply with the various laws and regulations may result in damage to Starbucks reputation, civil and criminal liability, fines and penalties, increased cost of regulatory compliance and restatements of the Company’s financial statements. Item 1B. Unresolved Staff Comments None. Item 2. Properties Properties used by Starbucks in connection with its roasting and distribution operations: Approximate Size Owned or Location in Square Feet Leased Purpose Kent, WA . . . . . . . . . . . . . . . . . . . . . . . 332,000 Owned Roasting and distribution Kent, WA . . . . . . . . . . . . . . . . . . . . . . . 215,000 Leased Warehouse Renton, WA . . . . . . . . . . . . . . . . . . . . . 125,000 Leased Warehouse York County, PA . . . . . . . . . . . . . . . . . . 450,000 Owned Roasting and distribution York County, PA . . . . . . . . . . . . . . . . . . 298,000 Owned Warehouse York County, PA . . . . . . . . . . . . . . . . . . 118,000 Leased Warehouse Carson Valley, NV . . . . . . . . . . . . . . . . . 360,000 Owned Roasting and distribution Sandy Run, SC . . . . . . . . . . . . . . . . . . . 117,000 Owned Roasting and distribution Portland, OR . . . . . . . . . . . . . . . . . . . . . 68,000 Leased Warehouse Basildon, United Kingdom . . . . . . . . . . . 142,000 Leased Warehouse and distribution Amsterdam, Netherlands . . . . . . . . . . . . 97,000 Leased Roasting and distribution The Company leases approximately 1.0 million square feet of office space in Seattle, Washington for corporate administrative purposes. Also in Seattle, Washington, the Company owns a 205,000 square foot office building (previously occupied by the Company, but now leased to other parties) and an adjacent 285,000 square foot office building, which is currently being marketed for lease. As of September 27, 2009, Starbucks had more than 8,800 Company-operated retail stores, almost all of which are leased. The Company also leases space in approximately 130 additional locations for regional, district and other administrative offices, training facilities and storage, not including certain seasonal retail storage locations. Item 3. Legal Proceedings See discussion of Legal Proceedings in Note 17 to the consolidated financial statements included in Item 8 of this Report. Item 4. Submission of Matters to a Vote of Security Holders No matters were submitted to a vote of security holders during the fourth fiscal quarter of 2009. 14
  • 23.
    Executive officers ofthe registrant Executive officers of the Company: Name Age Position Howard Schultz . . . . . . . . . . . . . . . . . . . 56 chairman, president and chief executive officer Cliff Burrows . . . . . . . . . . . . . . . . . . . . 50 president, Starbucks Coffee US Martin Coles . . . . . . . . . . . . . . . . . . . . . 54 president, Starbucks Coffee International John Culver. . . . . . . . . . . . . . . . . . . . . . 49 president, Global Consumer Products and Foodservice Michelle Gass . . . . . . . . . . . . . . . . . . . . 41 president, Seattle’s Best Coffee Arthur Rubinfeld . . . . . . . . . . . . . . . . . . 55 president, Global Development Annie Young-Scrivner . . . . . . . . . . . . . . 40 chief marketing officer Troy Alstead . . . . . . . . . . . . . . . . . . . . . 46 executive vice president, chief financial officer and chief administrative officer Paula E. Boggs . . . . . . . . . . . . . . . . . . . 50 executive vice president, general counsel and secretary Peter D. Gibbons . . . . . . . . . . . . . . . . . . 48 executive vice president, Global Supply Chain Operations Kalen Holmes . . . . . . . . . . . . . . . . . . . . 43 executive vice president, Partner Resources Olden Lee . . . . . . . . . . . . . . . . . . . . . . . 68 interim executive vice president, Partner Resources Howard Schultz is the founder of Starbucks and serves as the Company’s chairman, president and chief executive officer. Mr. Schultz has served as chairman of the board since the Company’s inception in 1985 and he resumed his role as president and chief executive officer in January 2008. From June 2000 to February 2005, Mr. Schultz held the title of chief global strategist. From November 1985 to June 2000, he served as chief executive officer. From November 1985 to June 1994, Mr. Schultz also served as president. Cliff Burrows joined Starbucks in April 2001 and has served as president, Starbucks Coffee US since March 2008. Mr. Burrows served as president, Europe, Middle East and Africa (EMEA) from April 2006 to March 2008. He served as vice president and managing director, UK prior to April 2006. Prior to joining Starbucks, Mr. Burrows served in various management positions with Habitat Designs Limited, a furniture and housewares retailer. Martin P. Coles joined Starbucks in April 2004 as president, Starbucks Coffee International, and, in July 2008, reassumed this role, after having served as chief operating officer from September 2007 to July 2008. Prior to joining Starbucks, Mr. Coles served as an executive vice president of Reebok International, Ltd. a sports and fitness products company, from December 2001 to February 2004. Prior to joining Reebok International, Ltd., Mr. Coles held several executive level management sales and operations positions with NIKE Inc., Letsbuyit.com and Gateway, Inc. John Culver joined Starbucks in August 2002 and has served as president, Global Consumer Products and Foodservice since September 2009. Mr. Culver served as executive vice president; president, Global Consumer Products, Foodservice and Seattle’s Best Coffee from February 2009 to September 2009. He previously served as senior vice president; president, Starbucks Coffee Asia Pacific from January 2007 to February 2009, and vice president; general manager, Foodservice from August 2002 to January 2007. Michelle Gass joined Starbucks in 1996 and has served as the Company’s president, Seattle’s Best Coffee since September 2009. Ms. Gass served as senior vice president, Marketing and Category from July 2008 to November 2008, and then as executive vice president, Marketing and Category from December 2008 to September 2009. Ms. Gass previously served as senior vice president, Global Strategy, Office of the ceo from January 2008 to July 2008, senior vice president, Global Product and Brand from August 2007 to January 2008, senior vice president, and U.S. Category Management from May 2004 to August 2007. Ms. Gass served in a number of other positions with Starbucks prior to 2004. 15
  • 24.
    Arthur Rubinfeld rejoinedStarbucks in February 2008 as president, Global Development. Mr. Rubinfeld also serves as president of AIRVISION LLC, an advisory firm specializing in brand positioning that he founded in June 2002. From March 2006 to February 2008, Mr. Rubinfeld served as executive vice president, Corporate Strategy and chief development officer at Potbelly Sandwich Works. Prior to 2002, Mr. Rubinfeld held several positions in Store Development at Starbucks. Annie Young-Scrivner joined Starbucks in September 2009 as chief marketing officer. Prior to joining Starbucks, Ms. Young-Scrivner served as Chief Marketing Officer and Vice President of Sales for Quaker Foods and Snacks, a division of PepsiCo, Inc. From October 2006 to November 2008, she served as Region President of PepsiCo Foods for Greater China. From 2005 to 2006, Ms. Young-Scrivner served as Vice President of Sales for PepsiCo Beverages in Greater China. She also served in a number of other leadership roles at PepsiCo prior to 2005. Troy Alstead joined Starbucks in 1992 and has served as executive vice president, chief financial officer and chief administrative officer since November 2008. Mr. Alstead previously served as chief operating officer, Starbucks Greater China from April 2008 to October 2008, senior vice president, Global Finance and Business Operations from August 2007 to April 2008, and senior vice president, Corporate Finance from September 2004 to August 2007. Mr. Alstead served in a number of other senior positions with Starbucks prior to 2004. Paula E. Boggs joined Starbucks in September 2002 as executive vice president, general counsel and secretary. Prior to joining Starbucks, Ms. Boggs served as vice president, legal, for products, operations and information technology at Dell Computer Corporation from 1997 to 2002. From 1995 to 1997, Ms. Boggs was a partner with the law firm of Preston Gates & Ellis (now K&L Gates). Ms. Boggs served in several roles at the Pentagon, White House and US Department of Justice between 1984 and 1995. Peter D. Gibbons joined Starbucks in February 2007 and has served as executive vice president, Global Supply Chain Operations since July 2008. From February 2007 to July 2008, Mr. Gibbons served as senior vice president, Global Manufacturing Operations. From March 1999 to February 2007, Mr. Gibbons was executive vice president, Supply Chain, of The Glidden Company, a subsidiary of ICI Americas, Inc. Kalen Holmes joined Starbucks in November 2009 as executive vice president, Partner Resources. Prior to joining Starbucks, Ms. Holmes served as HR General Manager for the Entertainment and Devices division at Microsoft Corporation, a worldwide provider of software, services and solutions, from December 2007 to November 2009. From December 2005 to December 2007, Ms. Holmes was HR General Manager for Microsoft’s Server and Tools Division. From September 2003 to December 2005, she served as HR General Manager for Microsoft’s Corporate Staff business unit. Prior to 2003, Ms. Holmes served as an HR leader at companies such as Bristol-Myers Squibb Company, PepsiCo, Inc., Enron Corporation, pcOrder.com, Inc., and Trilogy Inc., managing multiple geographies and diverse business units. Olden Lee has served as interim executive vice president, Partner Resources since April 2009. Mr. Lee has been a Starbucks director since June 2003. Mr. Lee undertook the role of interim head of Partner Resources while the Company searched for an executive vice president, Partner Resources. Mr. Lee will continue with the Company on an interim basis to assist Ms. Holmes and ensure a smooth transition. Prior to serving in his current role, Mr. Lee worked with PepsiCo, Inc. for 28 years in a variety of positions, including serving as senior vice president of human resources of its Taco Bell division and senior vice president and chief personnel officer of its KFC division. There are no family relationships among any directors or executive officers of the Company. 16
  • 25.
    PART II Item 5. Market for the Registrant’s Common Equity, Related Shareholder Matters and Issuer Purchases of Equity Securities SHAREHOLDER INFORMATION MARKET INFORMATION AND DIVIDEND POLICY The Company’s common stock is traded on NASDAQ, under the symbol “SBUX.” Quarterly high and low closing sale prices per share of the Company’s common stock as reported by NASDAQ for each quarter during the last two fiscal years: High Low September 27, 2009: Fourth Quarter . . . . . . . . . . . . . . . . . . . . . . . . . . . . . . . . . . . . . . . . . . . . . . . . $20.76 $12.97 Third Quarter . . . . . . . . . . . . . . . . . . . . . . . . . . . ...................... 15.30 11.11 Second Quarter . . . . . . . . . . . . . . . . . . . . . . . . . . ...................... 12.39 8.27 First Quarter . . . . . . . . . . . . . . . . . . . . . . . . . . . . ...................... 14.87 7.17 September 28, 2008: Fourth Quarter . . . . . . . . . . . . . . . . . . . . . . . . . . . . . . . . . . . . . . . . . . . . . . . . $16.92 $13.58 Third Quarter . . . . . . . . . . . . . . . . . . . . . . . . . . . ...................... 18.60 15.66 Second Quarter . . . . . . . . . . . . . . . . . . . . . . . . . . ...................... 20.47 16.80 First Quarter . . . . . . . . . . . . . . . . . . . . . . . . . . . . ...................... 26.84 20.03 As of November 13, 2009, the Company had approximately 21,600 shareholders of record. This does not include persons whose stock is in nominee or “street name” accounts through brokers. Starbucks has never paid any dividends on its common stock. Any future decision to pay cash dividends will be at the discretion of the Company’s Board of Directors and will be dependent on the Company’s operating perfor- mance, financial condition, capital expenditure requirements, and other such factors that the Board of Directors considers relevant. ISSUER PURCHASES OF EQUITY SECURITIES The following table provides information regarding repurchases by the Company of its common stock during the 13-week period ended September 27, 2009: Total Number Maximum of Shares Number of Purchased as Shares that May Total Average Part of Publicly Yet Be Number of Price Announced Purchased Shares Paid per Plans or Under the Plans Purchased(2) Share Programs(3) or Programs(3) Period(1) June 29, 2009 — July 26, 2009 . . . . . . . . . . . . . . — — — 6,272,128 July 27, 2009 — August 23, 2009 . . . . . . . . . . . . — — — 6,272,128 August 24, 2009 — September 27, 2009 . . . . . . . 1,780 $18.69 — 6,272,128 Total . . . . . . . . . . . . . . . . . . . . . . . . . . . . . . . . . . 1,780 — (1) Monthly information is presented by reference to the Company’s fiscal months during the fourth quarter of fiscal 2009. (2) These amounts represent shares surrendered to the Company to pay the exercise price and/or to satisfy tax withholding obligations in connection with stock swap exercises of employee stock options. (3) The Company’s share repurchase program is conducted under authorizations made from time to time by the Company’s Board of Directors. The Board of Directors authorized the repurchase of 25 million shares of common stock (publicly announced on May 3, 2007) and later authorized the repurchase of up to five million additional shares (publicly announced on January 30, 2008). Neither of these authorizations has an expiration date. 17
  • 26.
    Performance Comparison Graph Thefollowing graph depicts the Company’s total return to shareholders from October 3, 2004 through Septem- ber 27, 2009, relative to the performance of the Standard & Poor’s 500 Index, the NASDAQ Composite Index, and the Standard & Poor’s 500 Consumer Discretionary Sector, a peer group that includes Starbucks. All indices shown in the graph have been reset to a base of 100 as of October 3, 2004, and assume an investment of $100 on that date and the reinvestment of dividends paid since that date. Starbucks has never paid a dividend on its common stock. The stock price performance shown in the graph is not necessarily indicative of future price performance. $250 Starbucks Corporation S&P 500 NASDAQ Composite $200 S&P Consumer Discretionary $150 $100 $50 $0 10/3/2004 10/2/2005 10/1/2006 9/30/2007 9/28/2008 9/27/2009 10/3/04 10/2/05 10/1/06 9/30/07 9/28/08 9/27/09 Starbucks Corporation $100.00 $106.10 $144.22 $110.97 $ 63.36 $ 83.99 S&P 500 $100.00 $112.25 $124.37 $144.81 $112.99 $105.18 NASDAQ Composite $100.00 $113.78 $121.50 $143.37 $109.15 $112.55 S&P Consumer Discretionary $100.00 $105.05 $114.35 $121.59 $ 94.34 $ 94.29 18
  • 27.
    Item 6. Selected Financial Data In millions, except earnings per share and store information The following selected financial data are derived from the consolidated financial statements of the Company. The data below should be read in conjunction with “Management’s Discussion and Analysis of Financial Condition and Results of Operations,” “Risk Factors,” and the Company’s consolidated financial statements and notes. Sep 27, Sep 28, Sep 30, Oct 1, Oct 2, 2009 2008 2007 2006 2005 (1) As of and for the Fiscal Year Ended (52 Wks) (52 Wks) (52 Wks) (52 Wks) (52 Wks) RESULTS OF OPERATIONS Net revenues: Company-operated retail . . . . . . . . . . . . . . . . . $8,180.1 $ 8,771.9 $7,998.3 $6,583.1 $5,391.9 Specialty: Licensing. . . . . . . . . . . . . . . . . . . . . . . . . . . 1,222.3 1,171.6 1,026.3 860.6 673.0 Foodservice and other . . . . . . . . . . . . . . . . . 372.2 439.5 386.9 343.2 304.4 Total specialty . . . . . . . . . . . . . . . . . . . . . . . . . 1,594.5 1,611.1 1,413.2 1,203.8 977.4 Total net revenues . . . . . . . . . . . . . . . . . . . . . . . . $9.774.6 $10,383.0 $9,411.5 $7,786.9 $6,369.3 Operating income(2) . . . . . . . . . . . . . . . . . . . . . . . $ 562.0 $ 503.9 $1,053.9 $ 894.0 $ 780.5 Earnings before cumulative effect of change in accounting principle . . . . . . . . . . . . . . . . . . . . 390.8 315.5 672.6 581.5 494.4 Cumulative effect of accounting change for asset retirement obligations, net of taxes . . . . . . . . . . — — — 17.2 — Net earnings . . . . . . . . . . . . . . . . . . . . . . . . . . . . $ 390.8 $ 315.5 $ 672.6 $ 564.3 $ 494.4 Earnings per common share before cumulative effect of change in accounting principle — diluted (“EPS”) . . . . . . . . . . . . . . . . . . . . . . . . $ 0.52 $ 0.43 $ 0.87 $ 0.73 $ 0.61 Cumulative effect of accounting change for asset retirement obligations, net of taxes — per common share . . . . . . . . . . . . . . . . . . . . . . . . . — — — 0.02 — EPS — diluted . . . . . . . . . . . . . . . . . . . . . . . . . . $ 0.52 $ 0.43 $ 0.87 $ 0.71 $ 0.61 Net cash provided by operating activities . . . . . . . $1,389.0 $ 1,258.7 $1,331.2 $1,131.6 $ 922.9 Capital expenditures (additions to property, plant and equipment) . . . . . . . . . . . . . . . . . . . . . . . . $ 445.6 $ 984.5 $1,080.3 $ 771.2 $ 643.3 BALANCE SHEET Total assets . . . . . . . . . . . . . . . . . . . . . . . . . . . . . $5,576.8 $ 5,672.6 $5,343.9 $4,428.9 $3,513.7 Short-term borrowings . . . . . . . . . . . . . . . . . . . . . — 713.0 710.3 700.0 277.0 Long-term debt (including current portion) . . . . . . 549.5 550.3 550.9 2.7 3.6 Shareholders’ equity . . . . . . . . . . . . . . . . . . . . . . $3,045.7 $ 2,490.9 $2,284.1 $2,228.5 $2,090.3 STORE INFORMATION Percentage change in comparable store sales(3) United States . . . . . . . . . . . . . . . . . . . . . . . . . . (6)% (5)% 4% 7% 9% International . . . . . . . . . . . . . . . . . . . . . . . . . . (2)% 2% 7% 8% 6% Consolidated . . . . . . . . . . . . . . . . . . . . . . . . . . (6)% (3)% 5% 7% 8% Net stores opened (closed) during the year: United States Company — operated stores . . . . . . . . . . . . . (474) 445 1,065 810 580 Licensed stores . . . . . . . . . . . . . . . . . . . . . . 35 438 723 733 596 International Company — operated stores . . . . . . . . . . . . . 89 236 286 240 177 Licensed stores . . . . . . . . . . . . . . . . . . . . . . 305 550 497 416 319 Total . . . . . . . . . . . . . . . . . . . . . . . . . . . . . . . . . . (45) 1,669 2,571 2,199 1,672 19
  • 28.
    Sep 27, Sep 28, Sep 30, Oct 1, Oct 2, 2009 2008 2007 2006 2005 (1) As of and for the Fiscal Year Ended (52 Wks) (52 Wks) (52 Wks) (52 Wks) (52 Wks) Stores open at year end: United States Company-operated stores . . . . . . . . . . . . . . . 6,764 7,238 6,793 5,728 4,918 Licensed stores . . . . . . . . . . . . . . . . . . . . . . 4,364 4,329 3,891 3,168 2,435 International Company-operated stores . . . . . . . . . . . . . . . 2,068 1,979 1,743 1,457 1,217 Licensed stores . . . . . . . . . . . . . . . . . . . . . . 3,439 3,134 2,584 2,087 1,671 Total . . . . . . . . . . . . . . . . . . . . . . . . . . . . . . . . . . 16,635 16,680 15,011 12,440 10,241 (1) The Company’s fiscal year ends on the Sunday closest to September 30. (2) Fiscal 2009 and 2008 results include pretax restructuring charges of $332.4 million and $266.9 million, respectively. (3) Includes only Starbucks Company-operated retail stores open 13 months or longer. 20
  • 29.
    Item 7. Management’s Discussion and Analysis of Financial Condition and Results of Operations General Starbucks Corporation’s fiscal year ends on the Sunday closest to September 30. The fiscal years ended on September 27, 2009, September 28, 2008 and September 30, 2007 all included 52 weeks. Starbucks 2010 fiscal year will include 53 weeks, with the 53rd week falling in its fourth fiscal quarter. All references to store counts, including data for new store openings, are reported net of related store closures, unless otherwise noted. Overview Fiscal 2009 was a challenging year for Starbucks. The Company was confronted with extraordinary economic and operating challenges in addition to facing an increasingly competitive landscape. Although the global economy has shown some signs of improvement recently, management recognizes the difficult economic situation that many consumers are still facing and does not expect that to significantly change over the course of fiscal 2010. This challenging economic environment has strained consumer discretionary spending in the US and internationally, which in turn has impacted Company revenues, comparable store sales, operating income and operating margins. Starbucks responded to this difficult environment with a more disciplined focus on operations and the introduction of initiatives to permanently improve the Company’s cost structure. The result is an underlying business model that is less reliant on high revenue growth to drive profitability, and that still preserves the fundamental strengths and values of the Starbucks brand. The primary initiatives in this strategy include rationalizing the global Company- operated store portfolio, right-sizing the non-retail support organization, and reducing the Company’s cost structure, while renewing the focus on service excellence in the stores and delivering relevant innovation. Starbucks actions to rationalize its global store portfolio have included the planned closure of nearly 1,000 Company-operated stores globally. At the end of fiscal 2009, nearly all of the approximately 800 US Company- operated stores, 61 stores in Australia and 41 Company-operated stores in other International markets had been closed. The remaining International store closures are expected to be completed by the end of fiscal 2010. Initiatives targeting reductions in the Company’s cost structure in fiscal 2009 proceeded as planned, with full-year costs of $580 million removed from the Company’s cost structure. These targeted cost reductions and associated operational efficiency efforts, along with a more profitable Company-operated store base, have moved Starbucks toward a more sustainable business model, while preserving the fundamental strengths and values of the brand. The operational efficiency efforts are primarily focused on store level execution and include improved staffing models and better management of waste in coffee, dairy and food. Starbucks actions to improve the customer experience have resulted in a more focused effort toward in-store offerings, and simplifying the demands on store partners (employees), while concurrently raising already-high standards for beverage and food offerings, customer service and the overall in-store experience. The effects of these efforts have already been seen in the Company’s improved customer satisfaction scores. Starbucks has a renewed focus on relevant product innovation and the disciplined expansion and leveraging of its existing products and sales channels. For example, Starbucks VIATM Ready Brew coffee was launched in fiscal 2009 and is designed to capture a significant share of both the $21 billion global instant coffee category and the single- serve market. The Company intends to drive sales within the retail store base and CPG channels, both in the US and internationally. The Company continues to maintain a solid financial foundation, with no short term debt outstanding at the end of fiscal 2009 and with cash and liquid investments totaling more than $650 million. This solid financial position and continued strong cash flow generation have provided Starbucks with the financial flexibility to implement its restructuring efforts as well as make ongoing investments in its core business. Fiscal 2010 — The View Ahead For fiscal 2010, the Company expects revenues to grow in the low-to-mid single digits compared to fiscal 2009, driven by modestly positive comparable store sales, a 53rd fiscal week, and approximately 100 planned net new 21
  • 30.
    stores in theUS and approximately 200 net new stores in International markets. Both the US and International net new additions are expected to be primarily licensed stores. Given these revenue expectations, combined with the Company’s reduced cost structure, in-store operating efficiencies, and lower restructuring charges, Starbucks currently expects significant improvement in its consol- idated operating margin in fiscal 2010. Operating cash flow for fiscal 2010 is currently expected to reach approximately $1.4 billion and capital expenditures are expected to range from $500 million to $550 million. Operating Segment Overview Starbucks has three reportable operating segments: US, International and CPG. The US foodservice business, which was previously reported in the US segment, is now reported in the CPG segment, as a result of internal management realignments within the US and CPG businesses. Segment information for all prior periods presented has been revised to reflect this change. The US and International segments both include Company-operated retail stores and licensed retail stores. Licensed stores frequently have a higher operating margin than Company-operated stores. Under the licensed model, Starbucks receives a reduced share of the total store revenues, but this is more than offset by the reduction in its share of costs as these are primarily borne by the licensee. The International segment has a higher relative share of licensed stores versus Company-operated compared to the US segment; however, the US segment has been operating significantly longer than the International segment and has developed deeper awareness of, and attachment to, the Starbucks brand and stores among its customer base. As a result, the more mature US segment has significantly more stores, and higher total revenues than the International segment. Average sales per store are also higher in the US due to various factors including length of time in market and local income levels. Further, certain market costs, particularly occupancy costs, are lower in the US segment compared to the average for the International segment, which comprises a more diverse group of operations. As a result of the relative strength of the brand in the US segment, the number of stores, the higher unit volumes, and the lower market costs, the US segment, despite its higher relative percentage of Company-operated stores, has a higher operating margin, excluding restructuring costs, than the less-developed International segment. The Company’s International store base continues to expand and Starbucks has been focusing on achieving sustainable growth from established international markets while at the same time investing in emerging markets, such as China, Brazil and Russia. The Company’s newer international markets require a more extensive support organization, relative to the current levels of revenue and operating income. The CPG segment includes packaged coffee and tea, and other branded products operations worldwide, and the US foodservice business. For the packaged coffee and tea and branded products, Starbucks operates primarily through licensing arrangements and joint ventures with large consumer products business partners, most significantly with Kraft for distribution of packaged coffees and teas, and The North American Coffee Partnership with the Pepsi-Cola Company for manufacturing and distribution of ready-to-drink beverages. This operating model allows the CPG segment to leverage the business partners’ existing infrastructures and to extend the Starbucks brand in an efficient way. Most of the customer revenues from the packaged coffee and ready-to-drink products are recognized as revenues by the licensed or joint venture business partner, not by the CPG segment. Royalties and payments from our licensing agreements are recorded under licensing revenue, and the proportionate share of the results of the Company’s joint ventures are included, on a net basis, in Income from equity investees on the consolidated statements of earnings. The US foodservice business sells coffee and other related products to institutional foodservice companies with the majority of its sales through national broadline distribution networks. The CPG segment reflects relatively lower revenues, a modest cost structure, and a resulting higher operating margin, compared to the Company’s other two reporting segments, which consist primarily of retail stores. Expenses pertaining to corporate administrative functions that support the operating segments but are not specifically attributable to or managed by any segment are not included in the reported financial results of the operating segments. These unallocated corporate expenses include certain general and administrative expenses, related depreciation and amortization expenses, corporate restructuring charges and amounts included in Net interest income and other and Interest expense on the consolidated statements of earnings. 22
  • 31.
    Acquisitions See Note 19to the consolidated financial statements in this 10-K. RESULTS OF OPERATIONS — FISCAL 2009 COMPARED TO FISCAL 2008 Financial Highlights • Consolidated operating income was $562 million for fiscal 2009 compared to $504 million in fiscal 2008, and operating margin improved to 5.7% compared to 4.9% in fiscal 2008. Cost reduction initiatives and related operational efficiency efforts contributed significantly to the margin improvement, offset in part by higher restructuring charges incurred in fiscal 2009 compared to fiscal 2008 as Starbucks continued its work to rationalize its global store portfolio and support organization. • EPS for fiscal 2009 was $0.52, compared to EPS of $0.43 reported in fiscal 2008. Restructuring charges impacted EPS by approximately $0.28 per share in fiscal 2009 and restructuring and other transformation costs impacted EPS by approximately $0.28 in fiscal 2008. • Cash flow from operations was $1.4 billion in fiscal 2009 compared to $1.3 billion in fiscal 2008, while capital expenditures declined to $446 million in fiscal 2009 from $985 million in fiscal 2008. Available operating cash flow during fiscal 2009 was primarily used to reduce short-term borrowings to a zero balance in fiscal 2009, down from $713 million at the beginning of the fiscal year. • The Company realized approximately $580 million in reductions to its cost structure in fiscal 2009, with the initiatives focused on store closures, headcount reductions, in-store efficiencies and supply chain improvements. Consolidated results of operations (in millions): Sep 27, Sep 28, Sep 27, Sep 28, Fiscal Year Ended 2009 2008 % Change 2009 2008 % of Total Net Revenues Net revenues: Company-operated retail . . . . . . . . . . . . . . . . . . . . . $8,180.1 $ 8,771.9 (6.7)% 83.7% 84.5% Specialty: Licensing . . . . . . . . . . . . . . . . . . . . . . . . . . . . . . 1,222.3 1,171.6 4.3 12.5 11.3 Foodservice and other . . . . . . . . . . . . . . . . . . . . . 372.2 439.5 (15.3) 3.8 4.2 Total specialty . . . . . . . . . . . . . . . . . . . . . . . . . . . . 1,594.5 1,611.1 (1.0) 16.3 15.5 Total net revenues . . . . . . . . . . . . . . . . . . . . . . . . . . $9,774.6 $10,383.0 (5.9)% 100.0% 100.0% Company-operated retail revenues decreased from fiscal 2008, primarily attributable to a 6% decline in comparable store sales, comprised of a 4% decline in transactions and a 2% decline in the average value per transaction. Foreign currency translation also contributed to the decline with the effects of a stronger US dollar relative to the British pound and Canadian dollar. The weakness in consolidated comparable store sales was driven by the US segment, with a comparable store sales decline of 6% for the year. The International segment experienced a 2% decline in comparable store sales. The Company derived 16% of total net revenues from channels outside the Company-operated retail stores, collectively known as specialty operations. The decrease in Foodservice and other revenue was primarily due to the softness in the hospitality industry. 23
  • 32.
    Sep 27, Sep 28, % Sep 27, Sep 28, Fiscal Year Ended 2009 2008 Change 2009 2008 % of Total Net Revenues Cost of sales including occupancy costs . . . . . . . . . . . . . . $4,324.9 $4,645.3 (6.9)% 44.2% 44.7% Store operating expenses . . . . . . . . . . . . . . . . . . . . . . . . . 3,425.1 3,745.1 (8.5) 35.0 36.1 Other operating expenses . . . . . . . . . . . . . . . . . . . . . .... 264.4 330.1 (19.9) 2.7 3.2 Depreciation and amortization expenses . . . . . . . . . . .... 534.7 549.3 (2.7) 5.5 5.3 General and administrative expenses . . . . . . . . . . . . .... 453.0 456.0 (0.7) 4.6 4.4 Restructuring charges. . . . . . . . . . . . . . . . . . . . . . . . .... 332.4 266.9 24.5 3.4 2.6 Total operating expenses . . . . . . . . . . . . . . . . . . . . . . . . . 9,334.5 9,992.7 (6.6) 95.5 96.2 Income from equity investees . . . . . . . . . . . . . . . . . . . . . . 121.9 113.6 7.3 1.2 1.1 Operating income . . . . . . . . . . . . . . . . . . . . . . . . . . . . $ 562.0 $ 503.9 11.5% 5.7% 4.9% Supplemental ratios as a % of related revenues: Store operating expenses . . . . . . . . . . . . . . . . . . . . . . . . . 41.9% 42.7% Other operating expenses . . . . . . . . . . . . . . . . . . . . . . . . . 16.6% 20.5% Cost of sales including occupancy costs decreased as a percentage of revenues primarily due to the implementation of in-store operational efficiencies designed to reduce product waste, and due to lower dairy costs in the US, partially offset by higher coffee costs. Store operating expenses as a percentage of Company-operated retail revenues decreased primarily due to reduced headcount and spending in the regional support organization as a result of Starbucks restructuring efforts, and the effect of initiatives to improve store labor efficiencies. Restructuring charges include lease exit and related costs associated with the actions to rationalize the Company’s global store portfolio and reduce the global cost structure. See Note 2 to the consolidated financial statements for further discussion. Operating margin expansion was primarily due to the improved labor efficiency and reduced product waste in Company-operated stores, partially offset by increased restructuring charges. Sep 27, Sep 28, % Sep 27, Sep 28, Fiscal Year Ended 2009 2008 Change 2009 2008 % of Total Net Revenues Operating income . . . . . . . . . . . . . . . . . . . . . . . . . . . . . . . . . $562.0 $503.9 11.5% 5.7% 4.9% Interest income and other, net . . . . . . . . . . . . . . . . . . . . . . . . 36.3 9.0 nm 0.4 0.1 Interest expense . . . . . . . . . . . . . . . . . . . . . . . . . . . . . . . . . . (39.1) (53.4) (26.8) (0.4) (0.5) Earnings before income taxes . . . . . . . . . . . . . . . . . . . . . . 559.2 459.5 21.7 5.7 4.4 Income taxes. . . . . . . . . . . . . . . . . . . . . . . . . . . . . . . . . . . . . 168.4 144.0 16.9 1.7 1.4 Net earnings. . . . . . . . . . . . . . . . . . . . . . . . . . . . . . . . . . . $390.8 $315.5 23.9% 4.0% 3.0% Effective tax rate. . . . . . . . . . . . . . . . . . . . . . . . . . . . . . . . . . 30.1% 31.3% Net interest income and other increased due primarily to the impact of foreign currency fluctuations on certain balance sheet amounts. Also contributing to the increase were lower unrealized market value losses on the Company’s trading securities portfolio compared to fiscal 2008. As described in more detail in Note 3 to the consolidated financial statements, the trading securities approximate a portion of the Company’s liability under its Management Deferred Compensation Plan (“MDCP”). The MDCP liability also increases and decreases with changes in investment performance, with this offsetting impact recorded in General and administrative expenses on the consolidated statements of earnings. Interest expense decreased due to a lower average balance of short term 24
  • 33.
    borrowings and loweraverage short term borrowing rates in fiscal 2009 compared to the prior year. At the end of fiscal 2009, the Company had no short term debt. The relatively low 2009 effective tax rate was primarily due to a tax benefit recognized for retroactive tax credits and an income tax credit related to the settlement of an employment tax audit in fiscal 2009. As a result of the audit settlement, approximately $17 million of expense was recorded in Store operating expenses, with an offsetting income tax credit and no impact to net earnings. The effective tax rate for fiscal 2010 is expected to be in the range of 34% to 35%. Operating Segments Segment information is prepared on the same basis that the Company’s management reviews financial information for operational decision making purposes. Starbucks has three reportable operating segments: US, International and CPG. Unallocated Corporate includes expenses pertaining to corporate administrative functions that support the operating segments but are not specifically attributable to or managed by any segment and are not included in the reported financial results of the operating segments. Operating income represents earnings before Net interest income and other, Interest expense and Income taxes. The US foodservice business, which was previously reported in the US segment, is now reported in the CPG segment, as a result of internal management realignments within the US and CPG businesses. Segment information for all prior periods presented has been revised to reflect this change. The following tables summarize the Company’s results of operations by segment for fiscal 2009 and 2008 (in millions). United States The US operating segment sells coffee and other beverages, complementary food, whole bean coffees, and coffee brewing equipment and merchandise primarily through Company-operated retail stores. Specialty operations within the US include licensed retail stores and other initiatives related to the Company’s core business. Sep 27, Sep 28, % Sep 27, Sep 28, Fiscal Year Ended 2009 2008 Change 2009 2008 As a % of US Total Net Revenues Net revenues: Company-operated retail . . . . . . . . . . . . . . . . . . . . . . . . . $6,572.1 $6,997.7 (6.1)% 92.5% 92.9% Specialty: Licensing . . . . . . . . . . . . . . . . . . . . . . . . . . . . . . . . . 528.9 504.2 4.9 7.4 6.7 Other . . . . . . . . . . . . . . . . . . . . . . . . . . . . . . . . . . . . 3.6 30.1 (88.0) 0.1 0.4 Total specialty . . . . . . . . . . . . . . . . . . . . . . . . . . . 532.5 534.3 (0.3) 7.5 7.1 Total net revenues . . . . . . . . . . . . . . . . . . . . . . . . . . . . . $7,104.6 $7,532.0 (5.7)% 100.0% 100.0% 25
  • 34.
    Company-operated retail revenuesdecreased year over year primarily due to a 6% decrease in comparable store sales, comprised of a 4% decrease in transactions, and a 2% decrease in average value per transaction. Sep 27, Sep 28, % Sep 27, Sep 28, Fiscal Year Ended 2009 2008 Change 2009 2008 As a % of US Total Net Revenues Cost of sales including occupancy costs . . . . . . . . . . . . . . $2,965.7 $3,206.3 (7.5)% 41.7% 42.6% Store operating expenses . . . . . . . . . . . . . . . . . . . . . . . . . 2,815.1 3,081.0 (8.6) 39.6 40.9 Other operating expenses . . . . . . . . . . . . . . . . . . . . . .... 81.4 111.7 (27.1) 1.1 1.5 Depreciation and amortization expenses . . . . . . . . . . .... 378.1 395.4 (4.4) 5.3 5.2 General and administrative expenses . . . . . . . . . . . . .... 86.7 71.2 21.8 1.2 0.9 Restructuring charges. . . . . . . . . . . . . . . . . . . . . . . . .... 246.3 210.9 16.8 3.5 2.8 Total operating expenses . . . . . . . . . . . . . . . . . . . . . . . 6,573.3 7,076.5 (7.1) 92.5 94.0 Income (loss) from equity investees . . . . . . . . . . . . . . . . . 0.5 (1.3) nm — — Operating income . . . . . . . . . . . . . . . . . . . . . . . . . . . . $ 531.8 $ 454.2 17.1% 7.5% 6.0% Supplemental ratios as a % of related revenues: Store operating expenses . . . . . . . . . . . . . . . . . . . . . . . . . 42.8% 44.0% Other operating expenses . . . . . . . . . . . . . . . . . . . . . . . . . 15.3% 20.9% Operating margin expanded primarily due to lower store operating expenses, lower cost of sales including occupancy costs, and lower other operating expenses as a percentage of total revenues. This improvement was primarily due to operational changes designed to improve labor efficiency and reduce product waste in Company- operated stores, and to lower non-store support costs. Partially offsetting the favorability were higher restructuring charges during the year. The Company incurred higher lease exit and related costs due to the higher number of actual store closures compared to the prior year period. International The International operating segment sells coffee and other beverages, complementary food, whole bean coffees, and coffee brewing equipment and merchandise through Company-operated retail stores in Canada, the UK and several other markets. Specialty operations primarily include retail store licensing operations in nearly 40 other countries and foodservice accounts, primarily in Canada and the UK. The Company’s International store base continues to expand and Starbucks expects to achieve a growing contribution from established areas of the business while at the same time investing in emerging markets and channels. Many of the Company’s International operations are in early stages of development that require a more extensive support organization, relative to the current levels of revenue and operating income, than in the US. This continuing investment is part of the Company’s long-term, balanced plan for profitable growth. Sep 27, Sep 28, % Sep 27, Sep 28, Fiscal Year Ended 2009 2008 Change 2009 2008 As a % of International Total Net Revenues Net revenues: Company-operated retail . . . . . . . . . . . . . . . . . . . . . . . . . $1,608.0 $1,774.2 (9.4)% 83.7% 84.3% Specialty: Licensing. . . . . . . . . . . . . . . . . . . . . . . . . . . . . . . . . . . 266.2 274.8 (3.1) 13.9 13.1 Foodservice and other . . . . . . . . . . . . . . . . . . . . . . . . . 46.2 54.4 (15.1) 2.4 2.6 Total specialty . . . . . . . . . . . . . . . . . . . . . . . . . . . . . 312.4 329.2 (5.1) 16.3 15.7 Total net revenues . . . . . . . . . . . . . . . . . . . . . . . . . . . . . $1,920.4 $2,103.4 (8.7)% 100.0% 100.0% 26
  • 35.
    Company-operated retail revenuesdecreased primarily due to unfavorable foreign currency exchange rates, particularly for the British pound and Canadian dollar. Partially offsetting the decrease were the net new store openings of 89 Company-operated stores. Specialty revenues decreased primarily due to continued softness in the hospitality industry and unfavorable foreign currency exchange rates. Sep 27, Sep 28, % Sep 27, Sep 28, Fiscal Year Ended 2009 2008 Change 2009 2008 As a % of International Total Net Revenues Cost of sales including occupancy costs . . . . . . . . . . . . . . $ 963.7 $1,054.0 (8.6)% 50.2% 50.1% Store operating expenses . . . . . . . . . . . . . . . . . . . . . .... 610.0 664.1 (8.1) 31.8 31.6 Other operating expenses . . . . . . . . . . . . . . . . . . . . . .... 72.9 88.5 (17.6) 3.8 4.2 Depreciation and amortization expenses . . . . . . . . . . .... 102.5 108.8 (5.8) 5.3 5.2 General and administrative expenses . . . . . . . . . . . . .... 105.0 113.0 (7.1) 5.5 5.4 Restructuring charges. . . . . . . . . . . . . . . . . . . . . . . . .... 27.0 19.2 40.6 1.4 0.9 Total operating expenses . . . . . . . . . . . . . . . . . . . . . . . 1,881.1 2,047.6 (8.1) 98.0 97.3 Income from equity investees . . . . . . . . . . . . . . . . . . . . . . 53.6 54.2 (1.1) 2.8 2.6 Operating income . . . . . . . . . . . . . . . . . . . . . . . . . . . . $ 92.9 $ 110.0 (15.5)% 4.8% 5.2% Supplemental ratios as a % of related revenues: Store operating expenses . . . . . . . . . . . . . . . . . . . . . . . . . 37.9% 37.4% Other operating expenses . . . . . . . . . . . . . . . . . . . . . . . . . 23.3% 26.9% Operating margin decreased primarily due to higher restructuring charges and higher store operating expenses as a percentage of total revenues. Restructuring charges of $27.0 million recognized during the year had a 50 basis point impact on operating margin compared to the prior year, due to the previously announced store closures. Higher store operating expenses as of percentage of Company-operated retail revenues were driven by an increase in store impairment charges and a decline in sales leverage impacting salaries and benefits. Partially offsetting the decrease in operating margin were lower other operating expenses due to headcount reductions in the non-store support functions. Global Consumer Products Group CPG’s licensing revenue is from selling a selection of whole bean and ground coffees and premium Tazo» teas through licensing arrangements in US and international markets, and also producing and selling a variety of ready-to-drink beverages through its joint ventures and marketing and distribution agreements. The foodservice revenue is from the US foodservice business, which sells coffee and other related products to institutional foodservice companies with the majority of its sales through national broadline distribution networks. Sep 27, Sep 28, % Sep 27, Sep 28, Fiscal Year Ended 2009 2008 Change 2009 2008 As a % of CPG Total Net Revenues Net revenues: Licensing . . . . . . . . . . . . . . . . . . . . . . . . . . . . . . . . . . . . . $427.2 $392.6 8.8% 57.0% 52.5% Foodservice. . . . . . . . . . . . . . . . . . . . . . . . . . . . . . . . . . . . 322.4 355.0 (9.2) 43.0 47.5 Total specialty . . . . . . . . . . . . . . . . . . . . . . . . . . . . . . . $749.6 $747.6 0.3% 100.0% 100.0% 27
  • 36.
    Total net revenuesincreased primarily due to higher revenues from packaged coffees, partially offset by lower foodservice revenues caused by continued softness in the hospitality industry. Sep 27, Sep 28, % Sep 27, Sep 28, Fiscal Year Ended 2009 2008 Change 2009 2008 As a % of CPG Total Revenues Cost of sales . . . . . . . . . . . . . . . . . . . . . . . . . . . . . . . . . . . . . $395.5 $385.0 2.7% 52.8% 51.5% Other operating expenses. . . . . . . . . . . . . . . . . . . . . . . . . . . . 110.1 129.9 (15.2) 14.7 17.4 Depreciation and amortization expenses . . . . . . . . . . . . . . . . . 5.7 6.3 (9.5) 0.8 0.8 General and administrative expenses . . . . . . . . . . . . . . . . . . . 8.8 7.9 11.4 1.2 1.1 Restructuring charges . . . . . . . . . . . . . . . . . . . . . . . . . . . . . . 1.0 — nm 0.1 — Total operating expenses . . . . . . . . . . . . . . . . . . . . . . . . . . 521.1 529.1 (1.5) 69.5 70.8 Income from equity investees . . . . . . . . . . . . . . . . . . . . . . . . 67.8 60.7 11.7 9.0 8.1 Operating income . . . . . . . . . . . . . . . . . . . . . . . . . . . . . . $296.3 $279.2 6.1% 39.5% 37.3% Growth of operating margin was primarily due to lower other operating expenses in the foodservice business due to lower compensation costs and lower marketing expenses. Unallocated Corporate Unallocated corporate expenses pertain to corporate administrative functions that support, but are not specifically attributable to the Company’s operating segments. Sep 27, Sep 28, % Sep 27, Sep 28, Fiscal Year Ended 2009 2008 Change 2009 2008 As a % of Total Net Revenues Depreciation and amortization expenses . . . . . . . . . . . . . . . $ 48.4 $ 38.8 24.7% 0.5% 0.4% General and administrative expenses . . . . . . . . . . . . . . . . . . 252.5 263.9 (4.3) 2.6 2.5 Restructuring charges . . . . . . . . . . . . . . . . . . . . . . . . . . . . . 58.1 36.8 57.9 0.6 0.4 Operating loss . . . . . . . . . . . . . . . . . . . . . . . . . . . . . . . . $(359.0) $(339.5) (5.7)% (3.7)% (3.3)% Total unallocated corporate expenses increased primarily as a result of restructuring charges incurred for corporate office facilities that were no longer occupied by the Company due to the reduction in positions within the non-store support organization. RESULTS OF OPERATIONS — FISCAL 2008 COMPARED TO FISCAL 2007 Consolidated results of operations (in millions): Sep 28, Sep 30, % Sep 28, Sep 30, Fiscal Year Ended 2008 2007 Change 2008 2007 % of Total Net Revenues Net revenues: Company-operated retail. . . . . . . . . . . . . . . . . . . . . . . $ 8,771.9 $7,998.3 9.7% 84.5% 85.0% Specialty: Licensing . . . . . . . . . . . . . . . . . . . . . . . . . . . . . . . . 1,171.6 1,026.3 14.2 11.3 10.9 Foodservice and other . . . . . . . . . . . . . . . . . . . . . . . 439.5 386.9 13.6 4.2 4.1 Total specialty . . . . . . . . . . . . . . . . . . . . . . . . . . . . . . 1,611.1 1,413.2 14.0 15.5 15.0 Total net revenues . . . . . . . . . . . . . . . . . . . . . . . . . . . . $10,383.0 $9,411.5 10.3% 100.0% 100.0% 28
  • 37.
    Net revenues forthe fiscal year ended 2008 increased due to growth in both Company-operated retail revenues and specialty operations. During fiscal 2008, Starbucks derived 84% of total net revenues from its Company-operated retail stores. Company- operated retail revenues increased, primarily attributable to the opening of 681 new Company-operated retail stores in fiscal 2008, offset by negative 3% comparable store sales for the same period. Revenue growth was slower than in previous years due to a combination of declining comparable store sales and a decrease in the number of net new stores opened during fiscal 2008. The weakness in consolidated comparable store sales was driven by the US segment, which posted a comparable store sales decline of 5% for the year. Partially offsetting this was 2% comparable store sales growth in the International segment. Within fiscal 2008, consolidated quarterly revenue growth decelerated each quarter and comparable store sales declined each quarter, reflecting the ongoing challenging economic conditions in the US. The Company derived the remaining 16% of total net revenues from specialty operations. Licensing revenues increased primarily due to higher product sales and royalty revenues from the opening of 988 new licensed retail stores in fiscal 2008. The increase in Foodservice and other revenues was primarily driven by growth in new and existing accounts in the foodservice business in the US. Sep 28, Sep 30, % Sep 28, Sep 30, Fiscal Year Ended 2008 2007 Change 2008 2007 % of Total Net Revenues Cost of sales including occupancy costs . . . . . . . . . . . . $4,645.3 $3,999.1 16.2% 44.7% 42.5% Store operating expenses . . . . . . . . . . . . . . . . . . . . . . . . 3,745.1 3,215.9 16.5 36.1 34.2 Other operating expenses . . . . . . . . . . . . . . . . . . . . . . . . 330.1 294.2 12.2 3.2 3.1 Depreciation and amortization expenses . . . . . . . . . . . . . 549.3 467.2 17.6 5.3 5.0 General and administrative expenses. . . . . . . . . . . . . . . . 456.0 489.2 (6.8) 4.4 5.2 Restructuring charges . . . . . . . . . . . . . . . . . . . . . . . . . . . 266.9 — nm 2.6 — Total operating expenses . . . . . . . . . . . . . . . . . . . . . . . . 9,992.7 8,465.6 18.0 96.2 89.9 Income from equity investees . . . . . . . . . . . . . . . . . . . . . 113.6 108.0 5.2 1.1 1.1 Operating income. . . . . . . . . . . . . . . . . . . . . . . . . . . . . $ 503.9 $1,053.9 (52.2)% 4.9% 11.2% Supplemental ratios as a % of related revenues: Store operating expenses . . . . . . . . . . . . . . . . . . . . . . . . 42.7% 40.2% Other operating expenses . . . . . . . . . . . . . . . . . . . . . . . . 20.5% 20.8% Since many of the Company’s operating expenses are fixed in nature, the softness in US revenues during fiscal 2008 impacted nearly all consolidated and US segment operating expense line items when viewed as a percentage of sales, and pressured operating margins. Cost of sales including occupancy costs increased primarily due to higher distribution costs and higher rent expenses as a percentage of revenues. Store operating expenses as a percentage of Company-operated retail revenues increased primarily due to higher payroll expenditures as a percentage of revenues coupled with impairment provisions in the US business, primarily driven by the slowdown in projected store openings. Depreciation and amortization expenses increased primarily due to the opening of 681 new Company-operated retail stores in fiscal 2008. General and administrative expenses decreased primarily due to lower payroll-related expenses. Restructuring charges include asset impairment, lease exit and severance costs. These costs are associated with the closure of underperforming stores in the US and Australia, and the rationalization of the Company’s leadership structure and non-store organization. 29
  • 38.
    Operating margin compressionwas primarily due to lower revenues; in addition, restructuring charges accounted for approximately 40% of the decrease. Sep 28, Sep 30, % Sep 28, Sep 30, Fiscal Year Ended 2008 2007 Change 2008 2007 % of Total Net Revenues Operating income . . . . . . . . . . . . . . . . . . . . . . . . . . . . . . . . $503.9 $1,053.9 (52.2)% 4.9% 11.2% Interest income and other, net . . . . . . . . . . . . . . . . . . . . . . . 9.0 40.4 (77.7) 0.1 0.4 Interest expense . . . . . . . . . . . . . . . . . . . . . . . . . . . . . . . . . (53.4) (38.0) 40.5 (0.5) (0.4) Earnings before income taxes . . . . . . . . . . . . . . . . . . . . . . . 459.5 1,056.3 (56.5) 4.4 11.2 Income taxes . . . . . . . . . . . . . . . . . . . . . . . . . . . . . . . . . . . 144.0 383.7 (62.5) 1.4 4.1 Net earnings . . . . . . . . . . . . . . . . . . . . . . . . . . . . . . . . . . . $315.5 $ 672.6 (53.1)% 3.0% 7.1% Net interest income and other decreased due primarily to unrealized market value losses on the Company’s trading securities portfolio. The trading securities approximate a portion of the Company’s liability under its MDCP plan. The MDCP liability also increases and decreases with changes in investment performance, with this offsetting impact recorded in General and administrative expenses on the consolidated statements of earnings. Interest expense increased due to the Company’s issuance of $550 million of 10-year 6.25% Senior Notes in August of fiscal 2007. Income taxes for fiscal 2008 resulted in an effective tax rate of 31.3% compared to 36.3% for fiscal 2007. The lower rate was due to the higher proportion of income earned in foreign jurisdictions which have lower tax rates, as well as an increase in the domestic manufacturing deduction for manufacturing activities in the US. United States Sep 28, Sep 30, % Sep 28, Sep 30, Fiscal Year Ended 2008 2007 Change 2008 2007 As a % of US Total Net Revenues Net revenues: Company-operated retail . . . . . . . . . . . . . . . . . . . . . . . $6,997.7 $6,560.9 6.7% 92.9% 93.4% Specialty: Licensing . . . . . . . . . . . . . . . . . . . . . . . . . . . . . . . . . 504.2 439.1 14.8 6.7 6.3 Other . . . . . . . . . . . . . . . . . . . . . . . . . . . . . . . . . . . . 30.1 22.9 31.4 0.4 0.3 Total specialty . . . . . . . . . . . . . . . . . . . . . . . . . . . 534.3 462.0 15.6 7.1 6.6 Total net revenues . . . . . . . . . . . . . . . . . . . . . . . . . . . . . $7,532.0 $7,022.9 7.2% 100.0% 100.0% 30
  • 39.
    Company-operated retail revenuesincreased primarily due to the opening of 445 new Company-operated retail stores in fiscal 2008, partially offset by a 5% decrease in comparable store sales for fiscal 2008. The US Company- operated retail business continued to experience deteriorating trends in transactions during the year, driven by the US economic slowdown. Licensing revenues increased primarily due to higher product sales and royalty revenues as a result of opening 438 new licensed retail stores in fiscal 2008. Sep 28, Sep 30, % Sep 28, Sep 30, Fiscal Year Ended 2008 2007 Change 2008 2007 As a % of US Total Net Revenues Cost of sales including occupancy costs . . . . . . . . . . . . . . $3,206.3 $2,804.0 14.3% 42.6% 39.9% Store operating expenses . . . . . . . . . . . . . . . . . . . . . . . . . 3,081.0 2,684.2 14.8 40.9 38.2 Other operating expenses . . . . . . . . . . . . . . . . . . . . . .... 111.7 104.5 6.9 1.5 1.5 Depreciation and amortization expenses . . . . . . . . . . .... 395.4 341.7 15.7 5.2 4.9 General and administrative expenses . . . . . . . . . . . . .... 71.2 84.1 (15.3) 0.9 1.2 Restructuring charges. . . . . . . . . . . . . . . . . . . . . . . . .... 210.9 — nm 2.8 — Total operating expenses . . . . . . . . . . . . . . . . . . 7,076.5 6,018.5 17.6 94.0 85.7 Income (loss) from equity investees . . . . . . . . . . . . . . . . . (1.3) 0.8 nm — — Operating income . . . . . . . . . . . . . . . . . . . . . . $ 454.2 $1,005.2 (54.8)% 6.0% 14.3% Supplemental ratios as a % of related revenues: Store operating expenses . . . . . . . . . . . . . . . . . . . . . . . . . 44.0% 40.9% Other operating expenses . . . . . . . . . . . . . . . . . . . . . . . . . 20.9% 22.6% Operating margin contracted significantly primarily due to restructuring charges incurred and to softer revenues due to weak traffic, as well as higher cost of sales including occupancy costs and higher store operating expenses as a percentage of revenues. Restructuring charges of $210.9 million had a 280 basis point impact on the operating margin. The increase in cost of sales including occupancy costs was primarily due to higher distribution costs and higher rent expenses as a percentage of revenues. Higher store operating expenses was due to the softer sales, higher payroll-related expenditures, and charges from canceling future store sites and asset impairments. International Sep 28, Sep 30, % Sep 28, Sep 30, Fiscal Year Ended 2008 2007 Change 2008 2007 As a % of International Total Net Revenues Net revenues: Company-operated retail . . . . . . . . . . . . . . . . . . . . . . . $1,774.2 $1,437.4 23.4% 84.3% 84.7% Specialty: Licensing . . . . . . . . . . . . . . . . . . . . . . . . . . . . . . . . . 274.8 220.9 24.4 13.1 13.0 Foodservice and other . . . . . . . . . . . . . . . . . . . . . . . 54.4 37.9 43.5 2.6 2.2 Total specialty . . . . . . . . . . . . . . . . . . . . . . . . . . . 329.2 258.8 27.2 15.7 15.3 Total net revenues . . . . . . . . . . . . . . . . . . . . . . . . . . . . . $2,103.4 $1,696.2 24.0% 100.0% 100.0% Company-operated retail revenues increased due to the opening of 236 new Company-operated retail stores in fiscal 2008, favorable foreign currency exchange rates, primarily on the Canadian dollar, and comparable store sales growth of 2% for fiscal 2008. In the fourth quarter of fiscal 2008, Company-operated retail revenues grew at a slower rate year-over-year of 12% and comparable store sales were flat compared to the same quarter in fiscal 2007, both driven by slowdowns in the UK and Canada, due to the weakening global economy. 31
  • 40.
    Specialty revenues increasedprimarily due to higher product sales and royalty revenues from opening 550 new licensed retail stores in fiscal 2008. Sep 28, Sep 30, % Sep 28, Sep 30, Fiscal Year Ended 2008 2007 Change 2008 2007 As a % of International Total Net Revenues Cost of sales including occupancy costs . . . . . . . . . . . . . . $1,054.0 $ 824.6 27.8% 50.1% 48.6% Store operating expenses . . . . . . . . . . . . . . . . . . . . . .... 664.1 531.7 24.9 31.6 31.3 Other operating expenses . . . . . . . . . . . . . . . . . . . . . .... 88.5 69.9 26.6 4.2 4.1 Depreciation and amortization expenses . . . . . . . . . . .... 108.8 84.2 29.2 5.2 5.0 General and administrative expenses . . . . . . . . . . . . .... 113.0 93.8 20.5 5.4 5.5 Restructuring charges. . . . . . . . . . . . . . . . . . . . . . . . .... 19.2 — nm 0.9 — Total operating expenses . . . . . . . . . . . . . . . . . . . . 2,047.6 1,604.2 27.6 97.3 94.6 Income from equity investees . . . . . . . . . . . . . . . . . . . . . . 54.2 45.7 18.6 2.6 2.7 Operating income . . . . . . . . . . . . . . . . . . . . . . . . $ 110.0 $ 137.7 (20.1)% 5.2% 8.1% Supplemental ratios as a % of related revenues: Store operating expenses . . . . . . . . . . . . . . . . . . . . . . . . . 37.4% 37.0% Other operating expenses . . . . . . . . . . . . . . . . . . . . . . . . . 26.9% 27.0% Operating margin decreased primarily due to higher cost of sales including occupancy costs driven by continued expansion of lunch and warming programs in Canada, higher distribution costs, and higher building maintenance expense due to store renovation activities. In addition, restructuring charges of $19.2 million recognized in fiscal 2008 had a 90 basis point impact on the operating margin, nearly all due to the closure of 61 Company-operated stores in Australia. Global Consumer Products Group Sep 28, Sep 30, % Sep 28, Sep 30, Fiscal Year Ended 2008 2007 Change 2008 2007 As a % of CPG Total Net Revenues Net revenues: Licensing . . . . . . . . . . . . . . . . . . . . . . . . . . . . . . . . . . . . . $392.6 $366.3 7.2% 52.5% 52.9% Foodservice . . . . . . . . . . . . . . . . . . . . . . . . . . . . . . . . . . 355.0 326.1 8.9% 47.5 47.1 Total specialty . . . . . . . . . . . . . . . . . . . . . . . . . . . . . $747.6 $692.4 8.0% 100.0% 100.0% 32
  • 41.
    Foodservice revenues increasedprimarily due to growth in new and existing foodservice accounts, and licensing revenue increased due to higher royalties and product sales in the international ready-to-drink business and increased sales of US packaged tea and International club packaged coffee. Sep 28, Sep 30, % Sep 28, Sep 30, Fiscal Year Ended 2008 2007 Change 2008 2007 As a % of CPG Total Net Revenues Cost of sales . . . . . . . . . . . . . . . . . . . . . . . . . . . . . . . . . . . . . $385.0 $370.5 3.9% 51.5% 53.5% Other operating expenses. . . . . . . . . . . . . . . . . . . . . . . . . . . . 129.9 119.8 8.4 17.4 17.3 Depreciation and amortization expenses . . . . . . . . . . . . . . . . . 6.3 6.6 (4.5) 0.8 1.0 General and administrative expenses . . . . . . . . . . . . . . . . . . . 7.9 8.1 (2.5) 1.1 1.2 Total operating expenses . . . . . . . . . . . . . . . . . . . . . . 529.1 505.0 4.8 70.8 72.9 Income from equity investees . . . . . . . . . . . . . . . . . . . . . . . . 60.7 61.5 (1.3) 8.1 8.9 Operating income . . . . . . . . . . . . . . . . . . . . . . . . . . . $279.2 $248.9 12.2% 37.3% 35.9% Growth of operating margin was primarily due to lower cost of sales as a percentage of revenues, partially offset by lower income from equity investees. Lower cost of sales was primarily due to a sales mix shift to more profitable products. Unallocated Corporate Sep 28, Sep 30, % Sep 28, Sep 30, Fiscal Year Ended 2008 2007 Change 2008 2007 As a % of Total Net Revenues Depreciation and amortization expenses . . . . . . . . . . . . . . . $ 38.8 $ 34.7 11.8% 0.4% 0.4% General and administrative expenses . . . . . . . . . . . . . . . . . . 263.9 303.2 (13.0) 2.5 3.2 Restructuring charges . . . . . . . . . . . . . . . . . . . . . . . . . . . . . 36.8 — nm 0.4 — Operating loss. . . . . . . . . . . . . . . . . . . . . . . . . . . . . . . . . $(339.5) $(337.9) 0.5% (3.3)% (3.6)% Total unallocated corporate expenses remained relatively flat due to lower payroll-related expenditures, which were offset by restructuring charges incurred for corporate office facilities that were no longer occupied by the Company due to the reduction in positions within Starbucks leadership structure and non-store organization. FINANCIAL CONDITION, LIQUIDITY AND CAPITAL RESOURCES The Company’s existing cash and liquid investments were $666.1 million and $322.3 million as of September 27, 2009 and September 28, 2008, respectively. The Company manages its cash and liquid investments in order to internally fund operating needs and make scheduled interest and principal payments on its borrowings. Included in the cash and liquid investment balances are the following: • A portfolio of unrestricted trading securities, designed to hedge the Company’s liability under the MDCP. The value of this portfolio was $44.8 million and $49.5 million as of September 27, 2009 and September 28, 2008, respectively. The decrease was primarily driven by declines in market values of the underlying equity funds. See Note 3 for further details. • Unrestricted cash and liquid securities held within the Company’s wholly owned captive insurance company to fund claim payouts. The value of these unrestricted cash and liquid securities was approximately $11.8 million and $24.0 million as of September 27, 2009 and September 28, 2008, respectively. 33
  • 42.
    As of September27, 2009, the Company had $92.7 million invested in available-for-sale securities. Included in available-for-sale securities were $55.7 million of auction rate securities (“ARS”), compared with $59.8 million of ARS held as of September 28, 2008, with the decrease due to calls of individual securities. As described in more detail in Note 3, while the ongoing auction failures will limit the liquidity of these investments for some period of time, the Company does not believe the auction failures will materially impact its ability to fund its working capital needs, capital expenditures or other business requirements. Credit rating agencies currently rate the Company’s borrowings as follows: Description Standard & Poor’s Moody’s Short-term debt . . . . . . . . . . . . . . . . . . . . . . . . . . . . . . . . . . . . . . . . . . A-2 P-3 Senior unsecured long-term debt. . . . . . . . . . . . . . . . . . . . . . . . . . . . . . BBB Baa3 Outlook . . . . . . . . . . . . . . . . . . . . . . . . . . . . . . . . . . . . . . . . . . . . . . . . Stable Stable On August 28, 2009, Standard and Poor’s Ratings Services revised its outlook on the Company’s credit ratings to stable from negative based on improved credit metrics and stabilizing performance. The rating agency also affirmed the BBB corporate credit rating on the Company and raised the short-term rating to A-2 from A-3 to conform with the stable rating outlook. As a result of the Moody’s P-3 short-term rating issued in May 2009, commercial paper has become less liquid and more expensive than borrowing under the Company’s credit facility. Consequently, the Company utilized its credit facility for almost all short-term borrowing needs subsequent to May 2009. In the latter half of the year the Company reduced its total short-term borrowings to a zero balance due to strong operating cash flows and lower capital spending on new Company-operated stores. Management is unlikely to make significant use of its commercial paper program until its Moody’s short-term ratings improve. Despite limited access to the commercial paper markets, management believes that cash flow from operations and its existing cash and liquid investments, supplemented as needed by the $1 billion in short-term borrowing capacity under the Company’s revolving credit facility, will be sufficient to finance capital requirements for its core businesses for the foreseeable future, as well as to fund the cost of lease termination and related costs from the remaining international store closures. Significant new joint ventures, acquisitions and/or other new business opportunities may require additional outside funding. The Company’s credit facility contains provisions requiring Starbucks to maintain compliance with certain covenants, including a minimum fixed charge coverage ratio. On June 8, 2009, the credit facility was amended to more accurately reflect the parties’ intent with respect to Amendment No. 4 to the credit facility. Amendment No. 5 to the credit facility did not impact the Company’s borrowing terms, facility size, or covenant ratio, and was completed at minimal cost to the Company. As of September 27, 2009 and September 28, 2008, the Company was in compliance with each of these covenants. The $550 million of 10-year 6.25% Senior Notes, issued in fiscal 2007, also require Starbucks to maintain compliance with certain covenants that limit future liens and sale and leaseback transactions on certain material properties. As of September 27, 2009 and September 28, 2008, the Company was in compliance with each of these covenants. The Company generated strong operating cash flow during the year ended September 27, 2009 and used its free cash flow to reduce its short-term borrowings from $713.0 million at the end of fiscal 2008 to a zero balance at the end of fiscal 2009 and to increase the balance of its cash and liquid investments. The Company expects to use its cash and liquid investments, including any borrowings under its credit facility and commercial paper program, to invest in its core businesses, including new beverage and product innovations, as well as other new business opportunities related to its core businesses. The Company may use its available cash resources to make proportionate capital contributions to its equity method and cost method investees. Any decisions to increase its ownership interest in its equity method investees or licensed operations will be driven by valuation and fit with the Company’s ownership strategy and are likely to be infrequent. Depending on market conditions and within the constraint of maintaining an appropriate capital structure, Starbucks may repurchase shares of its common stock under its authorized share repurchase program. Starbucks 34
  • 43.
    did not repurchaseany shares in fiscal 2009 under the Company’s share repurchase program; however, the Company will continue to evaluate share repurchases and cash dividends in the future as a use for excess cash generated by the business. Other than normal operating expenses, cash requirements for fiscal 2010 are expected to consist primarily of capital expenditures for remodeling and refurbishment of, and equipment upgrades for, existing Company-operated retail stores; systems and technology investments in the stores and in the support infrastructure; and new Company- operated retail stores. Total capital expenditures for fiscal 2010 are expected to range from $500 million to $550 million. Cash provided by operating activities was $1.4 billion for fiscal 2009 compared to $1.3 billion for fiscal 2008. Cash used by investing activities for fiscal 2009 totaled $421.1 million compared to $1.1 billion in fiscal 2008. The decrease was due to lower capital expenditures in fiscal 2009 compared to fiscal 2008 due to opening significantly fewer new Company-operated stores. Cash used by financing activities for the year ended September 27, 2009 totaled $642.2 million, with net repayments of commercial paper and short-term borrowings under the credit facility totaling $713.1 million. As of September 27, 2009, a total of $14.1 million in letters of credit were outstanding under the credit facility, leaving $985.9 million of capacity available under the $1 billion combined commercial paper program and revolving credit facility. The following table summarizes the Company’s contractual obligations and borrowings as of September 27, 2009, and the timing and effect that such commitments are expected to have on the Company’s liquidity and capital requirements in future periods (in millions): Payments Due by Period Less than 1 1-3 3-5 More than Contractual Obligations(1) Total Year Years Years 5 Years Debt obligations(2) . . . . . . . . . . . . . . . . . . . . . . . $ 825.4 $ 34.7 $ 68.8 $ 68.8 $ 653.1 Operating lease obligations(3) . . . . . . . . . . . . . . . 4,389.2 706.7 1,281.3 1,039.1 1,362.1 Purchase obligations(4) . . . . . . . . . . .......... 308.3 264.1 34.2 9.5 0.5 Other obligations(5) . . . . . . . . . . . . . .......... 109.7 3.3 22.8 6.8 76.8 Total . . . . . . . . . . . . . . . . . . . . . . . . . . . . . . . . . $5,632.6 $1,008.8 $1,407.1 $1,124.2 $2,092.5 (1) Income tax liabilities for uncertain tax positions were excluded as the Company is not able to make a reasonably reliable estimate of the amount and period of related future payments. As of September 27, 2009, the Company had $49.1 million of gross unrecognized tax benefits for uncertain tax positions. (2) Debt amounts include principal maturities and expected interest payments on the long-term debt. (3) Amounts include the direct lease obligations, excluding any taxes, insurance and other related expenses. (4) Purchase obligations include agreements to purchase goods or services that are enforceable and legally binding on Starbucks and that specify all significant terms. Purchase obligations relate primarily to green coffee. (5) Other obligations include other long-term liabilities primarily consisting of asset retirement obligations, capital lease obligations and hedging instruments. Starbucks expects to fund these commitments primarily with operating cash flows generated in the normal course of business, as well as ongoing borrowings under the combined commercial paper program and revolving credit facility. Off-Balance Sheet Arrangement The Company’s off-balance sheet arrangements relate to certain guarantees and are detailed in Note 17 to the consolidated financial statements in this 10-K. 35
  • 44.
    COMMODITY PRICES, AVAILABILITYAND GENERAL RISK CONDITIONS Commodity price risk represents the Company’s primary market risk, generated by its purchases of green coffee and dairy products, among other things. The Company purchases, roasts and sells high-quality whole bean arabica coffee and related products and risk arises from the price volatility of green coffee. In addition to coffee, the Company also purchases significant amounts of dairy products to support the needs of its Company-operated retail stores. The price and availability of these commodities directly impacts the Company’s results of operations and can be expected to impact its future results of operations. For additional details see Product Supply in Item 1, as well as Risk Factors in Item 1A of this 10-K. FINANCIAL RISK MANAGEMENT Market risk is defined as the risk of losses due to changes in commodity prices, foreign currency exchange rates, equity security prices, and interest rates. The Company manages its exposure to various market-based risks according to an umbrella risk management policy. Under this policy, market-based risks are quantified and evaluated for potential mitigation strategies, such as entering into hedging transactions. The umbrella risk management policy governs the hedging instruments the business may use and limits the risk to net earnings. The Company also monitors and limits the amount of associated counterparty credit risk. Additionally, this policy restricts, among other things, the amount of market-based risk the Company will tolerate before implementing approved hedging strategies and prohibits speculative trading activity. In general, hedging instruments do not have maturities in excess of five years. The sensitivity analyses disclosed below provide only a limited, point-in-time view of the market risk of the financial instruments discussed. The actual impact of the respective underlying rates and price changes on the financial instruments may differ significantly from those shown in the sensitivity analyses. Commodity Price Risk The Company purchases commodity inputs, including coffee, dairy products and diesel that are used in its operations and are subject to price fluctuations that impact its financial results. In addition to fixed-price contracts and price-to-be-fixed contracts for coffee purchases, the Company has entered into commodity hedges to manage commodity price risk using financial derivative instruments. The Company performed a sensitivity analysis based on a 10% change in the underlying commodity prices of its commodity hedges, as of the end of fiscal 2009, and determined that such a change would not have a significant effect on the fair value of these instruments. Foreign Currency Exchange Risk The majority of the Company’s revenue, expense and capital purchasing activities are transacted in US dollars. However, because a portion of the Company’s operations consists of activities outside of the US, the Company has transactions in other currencies, primarily the Canadian dollar, British pound, euro, and Japanese yen. As a result, Starbucks may engage in transactions involving various derivative instruments to hedge revenues, inventory purchases, assets, and liabilities denominated in foreign currencies. As of September 27, 2009, the Company had forward foreign exchange contracts that hedge portions of anticipated international revenue streams and inventory purchases. In addition, Starbucks had forward foreign exchange contracts that qualify as accounting hedges of its net investment in Starbucks Japan, as well as the Company’s net investments in its Canada subsidiary, to minimize foreign currency exposure. The Company also had forward foreign exchange contracts that are not designated as hedging instruments for accounting purposes (free standing derivatives), but which largely offset the financial impact of translating certain foreign currency denominated payables and receivables. Increases or decreases in the fair value of these hedges are generally offset by corresponding decreases or increases in the US dollar value of the Company’s foreign currency denominated payables and receivables (i.e. “hedged items”) that would occur within the hedging period. The following table summarizes the potential impact to the Company’s future net earnings and other comprehensive income (“OCI”) from changes in the fair value of these derivative financial instruments due in turn to a change in the 36
  • 45.
    value of theUS dollar as compared to the level of foreign exchange rates. The information provided below relates only to the hedging instruments and does not represent the corresponding changes in the underlying hedged items (in millions): September 27, 2009 Increase/(Decrease) to Net Earnings Increase/(Decrease) to OCI 10% Increase in 10% Decrease in 10% Increase in 10% Decrease in Underlying Rate Underlying Rate Underlying Rate Underlying Rate Foreign currency hedges. . . . . . . . . . . . . $58 (58) 13 (13) Equity Security Price Risk The Company has minimal exposure to price fluctuations on equity mutual funds and equity exchange-traded funds within its trading portfolio. The trading securities approximate a portion of the Company’s liability under the MDCP. A corresponding liability is included in Accrued compensation and related costs on the consolidated balance sheets. These investments are recorded at fair value with unrealized gains and losses recognized in Net interest income and other in the consolidated statements of earnings. The offsetting changes in the MDCP liability are recorded in General and administrative expenses. The Company performed a sensitivity analysis based on a 10% change in the underlying equity prices of its investments as of the end of fiscal 2009, and determined that such a change would not have a significant effect on the fair value of these instruments. Interest Rate Risk The Company utilizes short-term and long-term financing and may use interest rate hedges to manage the effect of interest rate changes on its existing debt as well as the anticipated issuance of new debt. At the end of fiscal years 2009 and 2008, the Company did not have any interest rate hedge agreements outstanding. The following table summarizes the impact of a change in interest rates on the fair value of the Company’s debt (in millions): September 27, 2009 Change in Fair Value 100 Basis Point Increase in 100 Basis Point Decrease in Fair Value Underlying Rate Underlying Rate Debt . . . . . . . . . . . . . . . . . . . . . . . . $591.8 (39.8) 39.8 The Company’s available-for-sale securities comprise a diversified portfolio consisting mainly of fixed income instruments. The primary objectives of these investments are to preserve capital and liquidity. As of September 27, 2009, the Company’s long-term available-for-sale securities included ARS. Please see Note 3 for further infor- mation. Available-for-sale securities are recorded on the consolidated balance sheets at fair value with unrealized gains and losses reported as a component of Accumulated other comprehensive income. The Company does not hedge the interest rate exposure on its available-for-sale securities. The Company performed a sensitivity analysis based on a 100 basis point change in the underlying interest rate of its available-for-sale securities as of the end of fiscal 2009, and determined that such a change would not have a significant effect on the fair value of these instruments. APPLICATION OF CRITICAL ACCOUNTING POLICIES Critical accounting policies are those that management believes are both most important to the portrayal of the Company’s financial condition and results, and require management’s most difficult, subjective or complex judgments, often as a result of the need to make estimates about the effect of matters that are inherently uncertain. Judgments and uncertainties affecting the application of those policies may result in materially different amounts being reported under different conditions or using different assumptions. 37
  • 46.
    Starbucks considers itspolicies on asset impairment, stock-based compensation, operating leases, self insurance reserves and income taxes to be the most critical in understanding the judgments that are involved in preparing its consolidated financial statements. Asset Impairment When facts and circumstances indicate that the carrying values of long-lived assets may be impaired, an evaluation of recoverability is performed by comparing the carrying values of the assets to projected future cash flows, in addition to other quantitative and qualitative analyses. For goodwill and other indefinite-lived intangible assets, impairment tests are performed annually and more frequently if facts and circumstances indicate carrying values exceed estimated fair values and if indefinite useful lives are no longer appropriate for the Company’s trademarks. Upon determination that the carrying values of such assets are in excess of their estimated fair values, the Company recognizes an impairment loss as a charge against current operations. Judgments made by the Company related to the expected useful lives of long-lived assets and the ability of the Company to realize undiscounted cash flows in excess of the carrying amounts of such assets are affected by factors such as the ongoing maintenance and improvements of the assets, changes in economic conditions and changes in operating performance. As the Company assesses the ongoing expected cash flows and carrying amounts of its long-lived assets, these factors could cause the Company to realize material impairment charges. Stock-based Compensation Starbucks accounts for stock-based compensation in accordance with fair value recognition provisions, under which the Company uses the Black-Scholes-Merton option pricing model which requires the input of subjective assumptions. These assumptions include estimating the length of time employees will retain their stock options before exercising them (“expected term”), the estimated volatility of the Company’s common stock price over the expected term and the number of options that will ultimately not complete their vesting requirements. Changes in the subjective assumptions could materially affect the estimate of fair value of stock-based compensation; however based on an analysis using changes in certain assumptions that could be reasonably possible in the near term, management believes the effect on the expense recognized for fiscal 2009 would not have been material. Operating Leases Starbucks leases retail stores, roasting and distribution facilities and office space under operating leases. The Company provides for an estimate of asset retirement obligation (“ARO”) expense at the lease inception date for operating leases with requirements to remove leasehold improvements at the end of the lease term. Estimating AROs involves subjective assumptions regarding both the amount and timing of actual future retirement costs. Future actual costs could differ significantly from amounts initially estimated. In addition, the large number of operating leases and the significant number of international markets in which the Company has operating leases adds administrative complexity to the calculation of ARO expense, as well as to the other technical accounting requirements of operating leases such as contingent rent. Estimating the cost of certain lease exit costs involves subjective assumptions, including the time it would take to sublease the leased location and the related potential sublease income. The estimated accruals for these costs could be significantly affected if future experience differs from that used in the initial estimate. Self Insurance Reserves The Company uses a combination of insurance and self-insurance mechanisms, including a wholly owned captive insurance entity and participation in a reinsurance pool, to provide for the potential liabilities for certain risks, including workers’ compensation, healthcare benefits, general liability, property insurance, and director and officers’ liability insurance. Liabilities associated with the risks that are retained by the Company are not discounted and are estimated, in part, by considering historical claims experience, demographic factors, severity factors and other actuarial assumptions. The estimated accruals for these liabilities could be significantly affected if future occurrences and claims differ from these assumptions and historical trends. 38
  • 47.
    Income Taxes Starbucks recognizesdeferred tax assets and liabilities based on the differences between the financial statement carrying amounts and the tax basis of assets and liabilities and accrues for uncertain tax positions. Deferred tax assets and liabilities are measured using current enacted tax rates in effect for the years in which those temporary differences are expected to reverse. Judgment is required in determining the provision for income taxes and related accruals, deferred tax assets and liabilities. These include establishing a valuation allowance related to the ability to realize certain deferred tax assets. Accounting for uncertain tax positions requires significant judgments, including estimating the amount, timing and likelihood of ultimate settlement. Although the Company believes that its estimates are reasonable, actual results could differ from these estimates. RECENT ACCOUNTING PRONOUNCEMENTS See Note 1 to the consolidated financial statements in this 10-K. Item 7A. Quantitative and Qualitative Disclosures About Market Risk The information required by this item is incorporated by reference to the section entitled “Management’s Discussion and Analysis of Financial Condition and Results of Operations — Commodity Prices, Availability and General Risk Conditions” and “Management’s Discussion and Analysis of Financial Condition and Results of Operations — Financial Risk Management” in Item 7 of this Report. 39
  • 48.
    Item 8. Financial Statements and Supplementary Data STARBUCKS CORPORATION CONSOLIDATED STATEMENTS OF EARNINGS (In Millions, except earnings per share) Sep 27, Sep 28, Sep 30, Fiscal Year Ended 2009 2008 2007 Net revenues: Company-operated retail . . . . . . . . . . . . . . . . . . . . . . . . . . . . . . . . . . . $8,180.1 $ 8,771.9 $7,998.3 Specialty: Licensing . . . . . . . . . . . . . . . . . . . . . . . . . . . . . . . . . . . . . . . . . . . . . 1,222.3 1,171.6 1,026.3 Foodservice and other. . . . . . . . . . . . . . . . . . . . . . . . . . . . . . . . . . . . 372.2 439.5 386.9 Total specialty . . . . . . . . . . . . . . . . . . . . . . . . . . . . . . . . . . . . . . . . . . . 1,594.5 1,611.1 1,413.2 Total net revenues . . . . . . . . . . . . . . . . . . . . . ..................... 9,774.6 10,383.0 9,411.5 Cost of sales including occupancy costs . . . . . ..................... 4,324.9 4,645.3 3,999.1 Store operating expenses . . . . . . . . . . . . . . . . ..................... 3,425.1 3,745.1 3,215.9 Other operating expenses . . . . . . . . . . . . . . . . ..................... 264.4 330.1 294.2 Depreciation and amortization expenses . . . . . ..................... 534.7 549.3 467.2 General and administrative expenses . . . . . . . ..................... 453.0 456.0 489.2 Restructuring charges. . . . . . . . . . . . . . . . . . . ..................... 332.4 266.9 — Total operating expenses . . . . . . . . . . . . . . . . . . . . . . . . . . . . . . . . . . 9,334.5 9,992.7 8,465.6 Income from equity investees . . . . . . . . . . . . . . . . . . . . . . . . . . . . . . . . . . 121.9 113.6 108.0 Operating income . . . . . . . . . . . . . . . . . . . . . . . . . . . . . . . . . . . . . . . . . . 562.0 503.9 1,053.9 Interest income and other, net . . . . . . . . . . . . . . . . . . . . . . . . . . . . . . . . . 36.3 9.0 40.4 Interest expense . . . . . . . . . . . . . . . . . . . . . . . . . . . . . . . . . . . . . . . . . . . . (39.1) (53.4) (38.0) Earnings before income taxes . . . . . . . . . . . . . . . . . . . . . . . . . . . . . . 559.2 459.5 1,056.3 Income taxes . . . . . . . . . . . . . . . . . . . . . . . . . . . . . . . . . . . . . . . . . . 168.4 144.0 383.7 Net earnings. . . . . . . . . . . . . . . . . . . . . . . . . . . . . . . . . . . . . . . . . . . $ 390.8 $ 315.5 $ 672.6 Per common share: Net earnings — basic . . . . . . . . . . . . . . . ..................... $ 0.53 $ 0.43 $ 0.90 Net earnings — diluted . . . . . . . . . . . . . . ..................... $ 0.52 $ 0.43 $ 0.87 Weighted average shares outstanding: Basic . . . . . . . . . . . . . . . . . . . . . . . . . . . ..................... 738.7 731.5 749.8 Diluted . . . . . . . . . . . . . . . . . . . . . . . . . ..................... 745.9 741.7 770.1 See Notes to Consolidated Financial Statements. 40
  • 49.
    STARBUCKS CORPORATION CONSOLIDATED BALANCE SHEETS (In millions, except per share data) Sep 27, Sep 28, 2009 2008 ASSETS Current assets: Cash and cash equivalents . . . . . . . . . . . . . . . . . . . . . . . . . . . . . . . . . . . . . . . . . . . $ 599.8 $ 269.8 Short-term investments — available-for-sale securities . . . . . . . . . . . . . . . . . . . . . . . 21.5 3.0 Short-term investments — trading securities . . . . . . . . . . . . . . . . . . . . . . . . . . . . . . 44.8 49.5 Accounts receivable, net . . . . . . . . . . . . . . . . . . . . . . . . . . . . . . . . . . . . . . . . . . . . . 271.0 329.5 Inventories . . . . . . . . . . . . . . . . . . . . . . . . . . . . . . . . . . . . . . . . . . . . . . . . . . . . . . . 664.9 692.8 Prepaid expenses and other current assets . . . . . . . . . . . . . . . . . . . . . . . . . . . . . . . . 147.2 169.2 Deferred income taxes, net . . . . . . . . . . . . . . . . . . . . . . . . . . . . . . . . . . . . . . . . . . . 286.6 234.2 Total current assets . . . . . . . . . . . . . . . . . . . . . . . . . . . . . . . . . . . . . . . . . . . . . . . 2,035.8 1,748.0 Long-term investments — available-for-sale securities . . . . . . . . . . . . . . . . . . . . . . . . . 71.2 71.4 Equity and cost investments . . . . . . . . . . . . . . . . . . . . . . . . . . . . . . . . . . . . . . . . . . . . 352.3 302.6 Property, plant and equipment, net . . . . . . . . . . . . . . . . . . . . . . . . . . . . . . . . . . . . . . . 2,536.4 2,956.4 Other assets . . . . . . . . . . . . . . . . . . . . . . . . . . . . . . . . . . . . . . . . . . . . . . . . . . . . . . . . 253.8 261.1 Other intangible assets . . . . . . . . . . . . . . . . . . . . . . . . . . . . . . . . . . . . . . . . . . . . . . . . 68.2 66.6 Goodwill . . . . . . . . . . . . . . . . . . . . . . . . . . . . . . . . . . . . . . . . . . . . . . . . . . . . . . . . . . 259.1 266.5 TOTAL ASSETS . . . . . . . . . . . . . . . . . . . . . . . . . . . . . . . . . . . . . . . . . . . . . . . . . . $5,576.8 $5,672.6 LIABILITIES AND SHAREHOLDERS’ EQUITY Current liabilities: Commercial paper and short-term borrowings . . . . . . . . . . . . . . . . . . . . . . . . . . . . . $ — $ 713.0 Accounts payable . . . . . . . . . . . . . . . . . . . . . . . . . . . . . . . . . . . . . . . . . . . . . . . . . . 267.1 324.9 Accrued compensation and related costs . . . . . . . . . . . . . . . . . . . . . . . . . . . . . . . . . 307.5 253.6 Accrued occupancy costs . . . . . . . . . . . . . . . . . . . . . . . . . . . . . . . . . . . . . . . . . . . . 188.1 136.1 Accrued taxes . . . . . . . . . . . . . . . . . . . . . . . . . . . . . . . . . . . . . . . . . . . . . . . . . . . . 127.8 76.1 Insurance reserves . . . . . . . . . . . . . . . . . . . . . . . . . . . . . . . . . . . . . . . . . . . . . . . . . 154.3 152.5 Other accrued expenses . . . . . . . . . . . . . . . . . . . . . . . . . . . . . . . . . . . . . . . . . . . . . 147.3 164.4 Deferred revenue . . . . . . . . . . . . . . . . . . . . . . . . . . . . . . . . . . . . . . . . . . . . . . . . . . 388.7 368.4 Current portion of long-term debt . . . . . . . . . . . . . . . . . . . . . . . . . . . . . . . . . . . . . . 0.2 0.7 Total current liabilities . . . . . . . . . . . . . . . . . . . . . . . . . . . . . . . . . . . . . . . . . . . . 1,581.0 2,189.7 Long-term debt . . . . . . . . . . . . . . . . . . . . . . . . . . . . . . . . . . . . . . . . . . . . . . . . . . . . . 549.3 549.6 Other long-term liabilities . . . . . . . . . . . . . . . . . . . . . . . . . . . . . . . . . . . . . . . . . . . . . 400.8 442.4 Total liabilities . . . . . . . . . . . . . . . . . . . . . . . . . . . . . . . . . . . . . . . . . . . . . . . . . . 2,531.1 3,181.7 Shareholders’ equity: Common stock ($0.001 par value) — authorized, 1,200.0 shares; issued and outstanding, 742.9 and 735.5 shares, respectively (includes 3.4 common stock units in both periods) . . . . . . . . . . . . . . . . . . . . . . . . . . . . . . . . . . . . . . . . . . . . . 0.7 0.7 Additional paid-in capital . . . . . . . . . . . . . . . . . . . . . . . . . . . . . . . . . . . . . . . . . . . . 147.0 — Other additional paid-in-capital . . . . . . . . . . . . . . . . . . . . . . . . . . . . . . . . . . . . . . . . 39.4 39.4 Retained earnings . . . . . . . . . . . . . . . . . . . . . . . . . . . . . . . . . . . . . . . . . . . . . . . . . . 2,793.2 2,402.4 Accumulated other comprehensive income . . . . . . . . . . . . . . . . . . . . . . . . . . . . . . . 65.4 48.4 Total shareholders’ equity . . . . . . . . . . . . . . . . . . . . . . . . . . . . . . . . . . . . . . . . . . 3,045.7 2,490.9 TOTAL LIABILITIES AND SHAREHOLDERS’ EQUITY . . . . . . . . . . . . . . . . . . . $5,576.8 $5,672.6 See Notes to Consolidated Financial Statements. 41
  • 50.
    STARBUCKS CORPORATION CONSOLIDATED STATEMENTS OF CASH FLOWS (In millions) Sep 27, Sep 28, Sep 30, Fiscal Year Ended 2009 2008 2007 OPERATING ACTIVITIES: Net earnings . . . . . . . . . . . . . . . . . . . . . . . . . . . . . . . . . . . . . . . . . . . . . . . . . ... $ 390.8 $ 315.5 $ 672.6 Adjustments to reconcile net earnings to net cash provided by operating activities: Depreciation and amortization . . . . . . . . . . . . . . . . . . . . . . . . . . . . . . . . . . . . . . 563.3 604.5 491.2 Provision for impairments and asset disposals . . . . . . . . . . . . . . . . . . . . . . . . . . . 224.4 325.0 26.0 Deferred income taxes . . . . . . . . . . . . . . . . . . . . . . . . . . . . . . . . . . . . . . . . . . . (69.6) (117.1) (37.3) Equity in income of investees . . . . . . . . . . . . . . . . . . . . . . . . . . . . . . . . . . . . . . (78.4) (61.3) (65.7) Distributions of income from equity investees . . . . . . . . . . . . . . . . . . . . . . . . . . . 53.0 52.6 65.9 Stock-based compensation . . . . . . . . . . . . . . . . . . . . . . . . . . . . . . . . . . . . . . . . 83.2 75.0 103.9 Tax benefit from exercise of stock options . . . . . . . . . . . . . . . . . . . . . . . . . . . . . 2.0 3.8 7.7 Excess tax benefit from exercise of stock options . . . . . . . . . . . . . . . . . . . . . . . . (15.9) (14.7) (93.1) Other . . . . . . . . . . . . . . . . . . . . . . . . . . . . . . . . . . . . . . . . . . . . . . . . . . . . . . . 5.4 (0.1) 0.7 Cash provided/(used) by changes in operating assets and liabilities: Inventories . . . . . . . . . . . . . . . . . . . . . . . . . . . . . . . . . . . . . . . . . . . . . . . . . . 28.5 (0.6) (48.6) Accounts payable . . . . . . . . . . . . . . . . . . . . . . . . . . . . . . . . . . . . . . . . . . . . . (53.0) (63.9) 36.1 Accrued taxes . . . . . . . . . . . . . . . . . . . . . . . . . . . . . . . . . . . . . . . . . . . . . . . 57.2 7.3 86.4 Deferred revenue . . . . . . . . . . . . . . . . . . . . . . . . . . . . . . . . . . . . . . . . . . . . . 16.3 72.4 63.2 Other operating assets . . . . . . . . . . . . . . . . . . . . . . . . . . . . . . . . . . . . . . . . . . 120.5 (11.2) (92.7) Other operating liabilities . . . . . . . . . . . . . . . . . . . . . . . . . . . . . . . . . . . . . . . 61.3 71.5 114.9 Net cash provided by operating activities . . . . . . . . . . . . . . . . . . . . . . . . . . . . . . . . 1,389.0 1,258.7 1,331.2 INVESTING ACTIVITIES: Purchase of available-for-sale securities . . . . . . . . . . . . . . . . . . . . . . . . . . . . . . . (129.2) (71.8) (237.4) Maturities and calls of available-for-sale securities . . . . . . . . . . . . . . . . . . . . . . . . 111.0 20.0 178.2 Sales of available-for-sale securities . . . . . . . . . . . . . . . . . . . . . . . . . . . . . . . . . . 5.0 75.9 47.5 Acquisitions, net of cash acquired . . . . . . . . . . . . . . . . . . . . . . . . . . . . . . . . . . . — (74.2) (53.3) Net purchases of equity, other investments and other assets . . . . . . . . . . . . . . . . . . (4.8) (52.0) (56.6) Additions to property, plant and equipment . . . . . . . . . . . . . . . . . . . . . . . . . . . . . (445.6) (984.5) (1,080.3) Proceeds from sale of property, plant and equipment . . . . . . . . . . . . . . . . . . . . . . 42.5 — — Net cash used by investing activities . . . . . . . . . . . . . . . . . . . . . . . . . . . . . . . . . . . (421.1) (1,086.6) (1,201.9) FINANCING ACTIVITIES: Proceeds from issuance of commercial paper . . . . . . . . . . . . . . . . . . . . . . . . . . . 20,965.4 65,770.8 17,311.1 Repayments of commercial paper . . . . . . . . . . . . . . . . . . . . . . . . . . . . . . . . . . . (21,378.5) (66,068.0) (16,600.9) Proceeds from short-term borrowings . . . . . . . . . . . . . . . . . . . . . . . . . . . . . . . . . 1,338.0 528.2 770.0 Repayments of short-term borrowings . . . . . . . . . . . . . . . . . . . . . . . . . . . . . . . . (1,638.0) (228.8) (1,470.0) Proceeds from issuance of common stock . . . . . . . . . . . . . . . . . . . . . . . . . . . . . . 57.3 112.3 176.9 Excess tax benefit from exercise of stock options . . . . . . . . . . . . . . . . . . . . . . . . 15.9 14.7 93.1 Proceeds from issuance of long-term debt . . . . . . . . . . . . . . . . . . . . . . . . . . . . . . — — 549.0 Principal payments on long-term debt. . . . . . . . . . . . . . . . . . . . . . . . . . . . . . . . . (0.7) (0.6) (0.8) Repurchase of common stock . . . . . . . . . . . . . . . . . . . . . . . . . . . . . . . . . . . . . . — (311.4) (996.8) Other . . . . . . . . . . . . . . . . . . . . . . . . . . . . . . . . . . . . . . . . . . . . . . . . . . . . . . . (1.6) (1.7) (3.5) Net cash used by financing activities . . . . . . . . . . . . . . . . . . . . . . . . . . . . . . . . . . . (642.2) (184.5) (171.9) Effect of exchange rate changes on cash and cash equivalents . . . . . . . . . . . . . . . . . 4.3 0.9 11.3 Net increase/(decrease) in cash and cash equivalents . . . . . . . . . . . . . . . . . . . . . . . . 330.0 (11.5) (31.3) CASH AND CASH EQUIVALENTS: Beginning of period . . . . . . . . . . . . . . . . . . . . . . . . . . . . . . . . . . . . . . . . . . . . . . . 269.8 281.3 312.6 End of period . . . . . . . . . . . . . . . . . . . . . . . . . . . . . . . . . . . . . . . . . . . . . . . . . . . $ 599.8 $ 269.8 $ 281.3 SUPPLEMENTAL DISCLOSURE OF CASH FLOW INFORMATION: Net change in short-term borrowings and commercial paper for the period . . . . . . . . . $ (713.1) $ 2.2 $ 10.2 Cash paid during the period for: Interest, net of capitalized interest . . . . . . . . . . . . . . . . . . . . . . . . . . . . . . . . . . . $ 39.8 $ 52.7 $ 35.3 Income taxes . . . . . . . . . . . . . . . . . . . . . . . . . . . . . . . . . . . . . . . . . . . . . . . . . . $ 162.0 $ 259.5 $ 342.2 See Notes to Consolidated Financial Statements. 42
  • 51.
    STARBUCKS CORPORATION CONSOLIDATED STATEMENTS OF SHAREHOLDERS’ EQUITY (In millions) Other Accumulated Additional Additional Other Common Stock Paid-in Paid-in Retained Comprehensive Shares Amount Capital Capital Earnings Income/(Loss) Total Balance, October 1, 2006 . . . . . . . . . . . . . . . . 756.6 $0.7 $ — $39.4 $2,151.1 $ 37.3 $ 2,228.5 Net earnings. . . . . . . . . . . . . . . . . . . . . . . . — — — — 672.6 — 672.6 Unrealized holding loss, net . . . . . . . . . . . . . — — — — — (20.4) (20.4) Translation adjustment, net of tax . . . . . . . . . — — — — — 37.7 37.7 Comprehensive income . . . . . . . . . . . . . . . . 689.9 Stock-based compensation expense . . . . .... — — 106.4 — — — 106.4 Exercise of stock options, including tax benefit of $95.3. . . . . . . . . . . . . . . . .... 12.8 — 225.2 — — — 225.2 Sale of common stock, including tax provision of $0.1 . . . . . . . . . . . . . . . .... 1.9 — 46.8 — — — 46.8 Repurchase of common stock . . . . . . . . . . . . (33.0) — (378.4) — (634.3) — (1,012.7) Balance, September 30, 2007 . . . . . . . . . . . . . . 738.3 $0.7 $ — $39.4 $2,189.4 $ 54.6 $ 2,284.1 Cumulative impact of adoption of accounting requirements for uncertain tax positions . . . — — (1.6) — (1.7) — (3.3) Net earnings. . . . . . . . . . . . . . . . . . . . . . . . — — — — 315.5 — 315.5 Unrealized holding gain, net. . . . . . . . . . . . . — — — — — 0.8 0.8 Translation adjustment, net of tax . . . . . . . . . — — — — — (7.0) (7.0) Comprehensive income . . . . . . . . . . . . . . . . 309.3 Stock-based compensation expense . . . . . . . . — — 76.8 — — — 76.8 Exercise of stock options, including tax benefit of $8.4 . . . . . . . . . . . . . . . . . . . . 6.6 — 77.4 — — — 77.4 Sale of common stock, including tax benefit of $0.1 . . . . . . . . . . . . . . . . . . . . . . . . . . 2.8 — 41.9 — — — 41.9 Repurchase of common stock . . . . . . . . . . . . (12.2) — (194.5) — (100.8) — (295.3) Balance, September 28, 2008 . . . . . . . . . . . . . . 735.5 $0.7 $ — $39.4 $2,402.4 $ 48.4 $ 2,490.9 Net earnings. . . . . . . . . . . . . . . . . . . . . . . . — — — — 390.8 — 390.8 Unrealized holding gains, net . . . . . . . . . . . . — — — — — 1.8 1.8 Translation adjustment, net of tax . . . . . . . . . — — — — — 15.2 15.2 Comprehensive income . . . . . . . . . . . . . . . . 407.8 Stock-based compensation expense . . . . . . . . — — 84.3 — — — 84.3 Exercise of stock options, including tax benefit of $5.3 . . . . . . . . . . . . . . . . . . . . 4.9 — 35.9 — — — 35.9 Sale of common stock, including tax benefit of $0.1 . . . . . . . . . . . . . . . . . . . . . . . . . . 2.5 — 26.8 — — — 26.8 Balance, September 27, 2009 . . . . . . . . . . . . . . 742.9 $0.7 $ 147.0 $39.4 $2,793.2 $ 65.4 $ 3,045.7 See Notes to Consolidated Financial Statements. 43
  • 52.
    STARBUCKS CORPORATION NOTES TO CONSOLIDATED FINANCIAL STATEMENTS Fiscal Years ended September 27, 2009, September 28, 2008 and September 30, 2007 Note 1: Summary of Significant Accounting Policies Description of Business Starbucks Corporation (together with its subsidiaries, “Starbucks” or the “Company”) purchases and roasts high- quality whole bean coffees and sells them, along with fresh, rich-brewed coffees, Italian-style espresso beverages, cold blended beverages, a variety of complementary food items, a selection of premium teas, and beverage-related accessories and equipment, primarily through its Company-operated retail stores. Starbucks also sells coffee and tea products and licenses its trademark through other channels such as licensed stores, and through certain of its licensees and equity investees, Starbucks produces and sells a variety of ready-to-drink beverages. All channels outside the Company-operated retail stores are collectively known as specialty operations. Additional details on the nature of the Company’s business are in Item 1 of this 10-K. Starbucks has three reportable operating segments: United States (“US”), International and Global Consumer Products Group (“CPG”). See Note 18 for additional details. Principles of Consolidation The consolidated financial statements reflect the financial position and operating results of Starbucks, including wholly owned subsidiaries and investees controlled by the Company. Investments in entities that the Company does not control, but has the ability to exercise significant influence over operating and financial policies, are accounted for under the equity method. Investments in entities in which Starbucks does not have the ability to exercise significant influence are accounted for under the cost method. Intercompany transactions and balances have been eliminated. Fiscal Year End Starbucks fiscal year ends on the Sunday closest to September 30. The fiscal years ended on September 27, 2009, September 28, 2008 and September 30, 2007 all included 52 weeks. Starbucks 2010 fiscal year will include 53 weeks, with the 53rd week falling in its fourth fiscal quarter. Subsequent Events The Company evaluated subsequent events and transactions for potential recognition or disclosure in the financial statements through November 20, 2009, the day the financial statements were issued. Estimates and Assumptions Preparing financial statements in conformity with accounting principles generally accepted in the United States of America (“GAAP”) requires management to make estimates and assumptions that affect the reported amounts of assets, liabilities, revenues and expenses. Examples include, but are not limited to, estimates for asset and goodwill impairments, stock-based compensation forfeiture rates, and future asset retirement obligations; assumptions underlying self-insurance reserves; and the potential outcome of future tax consequences of events that have been recognized in the financial statements. Actual results and outcomes may differ from these estimates and assumptions. Cash and Cash Equivalents The Company considers all highly liquid instruments with a maturity of three months or less at the time of purchase to be cash equivalents. The Company maintains cash and cash equivalent balances with financial institutions that 44
  • 53.
    exceed federally insuredlimits. The Company has not experienced any losses related to these balances, and management believes its credit risk to be minimal. Cash Management The Company’s cash management system provides for the funding of all major bank disbursement accounts on a daily basis as checks are presented for payment. Under this system, outstanding checks are in excess of the cash balances at certain banks, which creates book overdrafts. Book overdrafts are presented as a current liability in Accounts payable on the consolidated balance sheets. Short-term and Long-term Investments The Company’s short-term and long-term investments consist primarily of investment grade debt securities, equity mutual funds, and equity exchange-traded funds, all of which are classified as available-for-sale or trading. As of September 27, 2009, a substantial portion of the Company’s available-for-sale investments consisted of auction rate securities, as described in more detail in Note 3. Trading securities are recorded at fair value with unrealized holding gains and losses included in net earnings. Available-for-sale securities are recorded at fair value, and unrealized holding gains and losses are recorded, net of tax, as a component of accumulated other comprehensive income. Available-for-sale securities with remaining maturities of less than one year and those identified by management at time of purchase for funding operations in less than one year are classified as short term, and all other available-for-sale securities are classified as long term. Unrealized losses are charged against net earnings when a decline in fair value is determined to be other than temporary. Management reviews several factors to determine whether a loss is other than temporary, such as the length and extent of the fair value decline, the financial condition and near term prospects of the issuer, and for equity investments, the Company’s intent and ability to hold the security for a period of time sufficient to allow for any anticipated recovery in fair value. For debt securities, management also evaluates whether the Company has the intent to sell or will likely be required to sell before its anticipated recovery. Realized gains and losses are accounted for on the specific identification method. Purchases and sales are recorded on a trade date basis. Fair Value of Financial Instruments The carrying value of cash and cash equivalents approximates fair value because of the short-term maturity of those instruments. The fair value of the Company’s investments in marketable debt and equity securities, equity mutual funds and equity exchange-traded funds, is based upon the quoted market price on the last business day of the fiscal year. Where an observable quoted market price for a security does not exist, the Company estimates fair value using a variety of valuation methodologies. Such methodologies include comparing the security with securities of publicly traded companies in similar lines of business, applying revenue multiples to estimated future operating results and estimating discounted cash flows. See Note 3 and 7 for additional information and Note 5 for the methods used to measure fair value. The fair value of the Company’s debt is estimated based on the quoted market prices for the same or similar issues or on the current rates offered to the Company for debt of the same remaining maturities. The carrying value of short-term debt approximates fair value. The estimated fair value of Starbucks $550 million of 6.25% Senior Notes was approximately $591 million and $536 million as of September 27, 2009 and September 28, 2008, respectively. Derivative Instruments The Company manages its exposure to various risks within the consolidated financial statements according to an umbrella risk management policy. Under this policy, Starbucks may engage in transactions involving various derivative instruments, with maturities generally not longer than five years, to hedge interest rates, commodity prices, and foreign currency denominated revenues, purchases, assets and liabilities. The Company records all derivatives on the balance sheets at fair value. For a cash flow hedge, the effective portion of the derivative’s gain or loss is initially reported as a component of other comprehensive income (“OCI”) and 45
  • 54.
    subsequently reclassified intonet earnings when the hedged exposure affects net earnings. For a net investment hedge, the effective portion of the derivative’s gain or loss is reported as a component of OCI. Cash flow hedges related to anticipated transactions are designated and documented at the inception of each hedge by matching the terms of the contract to the underlying transaction. The Company classifies the cash flows from hedging transactions in the same categories as the cash flows from the respective hedged items. Once established, cash flow hedges are generally not removed until maturity unless an anticipated transaction is no longer likely to occur. For discontinued or dedesignated cash flow hedges, the related accumulated derivative gains or losses are recognized in Net interest income and other on the consolidated statements of earnings. Forward contract effectiveness for cash flow hedges is calculated by comparing the fair value of the contract to the change in value of the anticipated transaction using forward rates on a monthly basis. For net investment hedges, the spot-to-spot method is used to calculate effectiveness. Under this method, the change in fair value of the forward contract attributable to the changes in spot exchange rates (the effective portion) is reported as a component of OCI. The remaining change in fair value of the forward contract (the ineffective portion) is reclassified into net earnings. Any ineffectiveness is recognized immediately in Net interest income and other on the consolidated statements of earnings. The Company also enters into certain foreign currency forward contracts and commodity swap and futures contracts that are not designated as hedging instruments for accounting purposes. These contracts are recorded at fair value, with the changes in fair value recognized in Net interest income and other on the consolidated statements of earnings. See Note 5 for additional information on the Company’s fair value measurements related to derivative instruments. Allowance for Doubtful Accounts Allowance for doubtful accounts is calculated based on historical experience, customer credit risk and application of the specific identification method. As of September 27, 2009 and September 28, 2008, the allowance for doubtful accounts was $5.0 million and $4.5 million, respectively. Inventories Inventories are stated at the lower of cost (primarily moving average cost) or market. The Company records inventory reserves for obsolete and slow-moving items and for estimated shrinkage between physical inventory counts. Inventory reserves are based on inventory turnover trends, historical experience and application of the specific identification method. As of September 27, 2009 and September 28, 2008, inventory reserves were $21.1 million and $25.5 million, respectively. Property, Plant and Equipment Property, plant and equipment are carried at cost less accumulated depreciation. Depreciation of property, plant and equipment, which includes assets under capital leases, is provided on the straight-line method over estimated useful lives, generally ranging from two to seven years for equipment and 30 to 40 years for buildings. Leasehold improvements are amortized over the shorter of their estimated useful lives or the related lease life, generally 10 years. For leases with renewal periods at the Company’s option, Starbucks generally uses the original lease term, excluding renewal option periods, to determine estimated useful lives. If failure to exercise a renewal option imposes an economic penalty to Starbucks, management may determine at the inception of the lease that renewal is reasonably assured and include the renewal option period in the determination of appropriate estimated useful lives. The portion of depreciation expense related to production and distribution facilities is included in Cost of sales including occupancy costs on the consolidated statements of earnings. The costs of repairs and maintenance are expensed when incurred, while expenditures for refurbishments and improvements that significantly add to the productive capacity or extend the useful life of an asset are capitalized. When assets are retired or sold, the asset cost and related accumulated depreciation are eliminated with any remaining gain or loss reflected in net earnings. 46
  • 55.
    Goodwill The Company testsits goodwill for impairment on an annual basis, or more frequently if circumstances indicate reporting unit carrying values exceed their fair values. Fair value is estimated by projecting discounted cash flows from the reporting unit in addition to other quantitative and qualitative analyses. If the carrying amount of goodwill exceeds the implied estimated fair value, an impairment charge to current operations is recorded to reduce the carrying value to the implied estimated fair value. Starbucks conducted its annual test for its consolidated entities in the third fiscal quarter, resulting in $7 million of goodwill impairment in fiscal 2009 related to the US operating segment’s Hawaii reporting unit, which is comprised of retail store operations. The current and future projected operating results for the Hawaii operations, which were acquired in fiscal 2006, were lower than originally anticipated due to the overall economic slowdown and its impact on the travel industry in particular, resulting in a partial impairment of the related goodwill. There was no impairment of goodwill in fiscal 2008 and 2007. Other Intangible Assets Other intangible assets consist primarily of trademarks with indefinite lives which are tested for impairment annually or more frequently if indefinite useful lives are no longer appropriate. Definite-lived intangible assets, which mainly consist of contract-based patents and copyrights, are amortized over their estimated useful lives, and are tested for impairment when facts and circumstances indicate that the carrying values may not be recoverable. For further information on other intangible assets, see Note 9. Based on the impairment tests performed there was no impairment of other intangible assets in fiscal 2009, 2008 and 2007. Long-lived Assets When facts and circumstances indicate that the carrying values of long-lived assets may be impaired, an evaluation of recoverability is performed by comparing the carrying values of the assets to projected undiscounted future cash flows in addition to other quantitative and qualitative analyses. Upon indication that the carrying values of such assets may not be recoverable, the Company compares the fair value of long-lived assets to their carrying value and recognizes an impairment loss by a charge to net earnings for the excess of carrying value over fair value. The fair value of the assets is estimated using the discounted future cash flows of the assets. Property, plant and equipment assets are grouped at the lowest level for which there are identifiable cash flows when assessing impairment. Cash flows for retail assets are identified at the individual store level. Long-lived assets to be disposed of are reported at the lower of their carrying amount, or fair value less estimated costs to sell. The Company recognized net impairment and disposition losses of $224.4 million, $325.0 million and $26.0 million in fiscal 2009, 2008 and 2007, respectively, primarily due to underperforming Company-operated retail stores. The net losses in fiscal 2009 and 2008 include $129.2 million and $201.6 million, respectively, of asset impairments related to the US and International store closures and charges incurred for office facilities no longer occupied by the Company due to the reduction in positions within Starbucks leadership structure and non-store organization. See Note 2 for further details. Depending on the underlying asset that is impaired, these losses may be recorded in any one of the operating expense lines on the consolidated statements of earnings: for retail operations, the net impairment and disposition losses are recorded in Restructuring charges and Store operating expenses; for specialty operations, these losses are recorded in Restructuring charges and Other operating expenses; and for all other operations, these losses are recorded in Cost of sales including occupancy costs, General and administrative expenses, or Restructuring charges. Insurance Reserves The Company uses a combination of insurance and self-insurance mechanisms, including a wholly owned captive insurance entity and participation in a reinsurance pool, to provide for the potential liabilities for certain risks, including workers’ compensation, healthcare benefits, general liability, property insurance, and director and officers’ liability insurance. Liabilities associated with the risks that are retained by the Company are not discounted 47
  • 56.
    and are estimated,in part, by considering historical claims experience, demographic factors, severity factors and other actuarial assumptions. Revenue Recognition Consolidated revenues are presented net of intercompany eliminations for wholly owned subsidiaries and investees controlled by the Company and for licensees accounted for under the equity method, based on the Company’s percentage ownership. Additionally, consolidated revenues are recognized net of any discounts, returns, allowances and sales incentives, including coupon redemptions and rebates. Stored Value Cards Revenues from the Company’s stored value cards, such as the Starbucks Card, and gift certificates are recognized when tendered for payment, or upon redemption. Outstanding customer balances are included in Deferred revenue on the consolidated balance sheets. There are no expiration dates on the Company’s stored value cards or gift certificates, and Starbucks does not charge any service fees that cause a decrement to customer balances. While the Company will continue to honor all stored value cards and gift certificates presented for payment, management may determine the likelihood of redemption to be remote for certain card and certificate balances due to, among other things, long periods of inactivity. In these circumstances, if management also determines there is no requirement for remitting balances to government agencies under unclaimed property laws, card and certificate balances may then be recognized in the consolidated statements of earnings in Net interest income and other. For the fiscal years ended September 27, 2009, September 28, 2008 and September 30, 2007 income recognized on unredeemed stored value card balances and gift certificates was $26.0 million, $13.6 million and $12.9 million, respectively. Retail Revenues Company-operated retail store revenues are recognized when payment is tendered at the point of sale. Starbucks maintains a sales return allowance to reduce retail revenues for estimated future product returns, including brewing equipment, based on historical patterns. Retail store revenues are reported net of sales, use or other transaction taxes that are collected from customers and remitted to taxing authorities. Specialty Revenues Specialty revenues consist primarily of product sales to customers other than through Company-operated retail stores, as well as royalties and other fees generated from licensing operations. Sales of coffee, tea and related products are generally recognized upon shipment to customers, depending on contract terms. Shipping charges billed to customers are also recognized as revenue, and the related shipping costs are included in Cost of sales including occupancy costs on the consolidated statements of earnings. Specific to retail store licensing arrangements, initial nonrefundable development fees are recognized upon substantial performance of services for new market business development activities, such as initial business, real estate and store development planning, as well as providing operational materials and functional training courses for opening new licensed retail markets. Additional store licensing fees are recognized when new licensed stores are opened. Royalty revenues based upon a percentage of reported sales and other continuing fees, such as marketing and service fees, are recognized on a monthly basis when earned. For certain licensing arrangements, where the Company intends to acquire an ownership interest, the initial nonrefundable development fees are deferred to Other long-term liabilities on the consolidated balance sheets until acquisition, at which point the fees are reflected as a reduction of the Company’s investment. Other arrangements involving multiple elements and deliverables as well as upfront fees are individually evaluated for revenue recognition. Cash payments received in advance of product or service delivery are recorded in Deferred revenue until earned. 48
  • 57.
    Advertising The Company expensesmost advertising costs as they are incurred, except for certain production costs that are expensed the first time the advertising campaign takes place and direct-response advertising, which is capitalized and amortized over its expected period of future benefits. Advertising expenses, recorded in Store operating expenses, Other operating expenses and General and admin- istrative expenses on the consolidated statements of earnings, totaled $126.3 million, $129.0 million and $103.5 million in fiscal 2009, 2008 and 2007, respectively. As of September 27, 2009 and September 28, 2008, $7.2 million and $8.8 million, respectively, of capitalized advertising costs were recorded in Prepaid expenses and other current assets, and Other assets on the consolidated balance sheets. Research and Development Starbucks expenses research and development costs as they are incurred. The Company spent approximately $6.5 million, $7.2 million and $7.0 million during fiscal 2009, 2008 and 2007, respectively, on technical research and development activities, in addition to customary product testing and product and process improvements in all areas of its business. Store Preopening Expenses Costs incurred in connection with the start-up and promotion of new store openings are expensed as incurred. Operating Leases Starbucks leases retail stores, roasting and distribution facilities and office space under operating leases. Most lease agreements contain tenant improvement allowances, rent holidays, lease premiums, rent escalation clauses and/or contingent rent provisions. For purposes of recognizing incentives, premiums and minimum rental expenses on a straight-line basis over the terms of the leases, the Company uses the date of initial possession to begin amortization, which is generally when the Company enters the space and begins to make improvements in preparation of intended use. For tenant improvement allowances and rent holidays, the Company records a deferred rent liability in Accrued occupancy costs and Other long-term liabilities on the consolidated balance sheets and amortizes the deferred rent over the terms of the leases as reductions to rent expense on the consolidated statements of earnings. For premiums paid upfront to enter a lease agreement, the Company records a deferred rent asset in Prepaid expenses and other current assets and Other assets on the consolidated balance sheets and then amortizes the deferred rent over the terms of the leases as additional rent expense on the consolidated statements of earnings. For scheduled rent escalation clauses during the lease terms or for rental payments commencing at a date other than the date of initial occupancy, the Company records minimum rental expenses on a straight-line basis over the terms of the leases on the consolidated statements of earnings. Certain leases provide for contingent rents, which are determined as a percentage of gross sales in excess of specified levels. The Company records a contingent rent liability in Accrued occupancy costs on the consolidated balance sheets and the corresponding rent expense when specified levels have been achieved or when management determines that achieving the specified levels during the fiscal year is probable. When ceasing operations in Company-operated stores under operating leases, in cases where the lease contract specifies a termination fee due to the landlord, the Company records such expense at the time written notice is given to the landlord. In cases where terms, including termination fees, are yet to be negotiated with the landlord, the Company will record the expense upon signing of an agreement with the landlord. Finally, in cases where the landlord does not allow the Company to prematurely exit its lease, but allows for subleasing, the Company estimates the fair value of any sublease income that can be generated from the location and expenses the present value of the excess of remaining lease payments to the landlord over the projected sublease income at the cease-use date. 49
  • 58.
    Asset Retirement Obligations Starbucksrecognizes a liability for the fair value of required asset retirement obligations (“ARO”) when such obligations are incurred. The Company’s AROs are primarily associated with leasehold improvements which, at the end of a lease, the Company is contractually obligated to remove in order to comply with the lease agreement. At the inception of a lease with such conditions, the Company records an ARO liability and a corresponding capital asset in an amount equal to the estimated fair value of the obligation. The liability is estimated based on a number of assumptions requiring management’s judgment, including store closing costs, cost inflation rates and discount rates, and is accreted to its projected future value over time. The capitalized asset is depreciated using the convention for depreciation of leasehold improvement assets. Upon satisfaction of the ARO conditions, any difference between the recorded ARO liability and the actual retirement costs incurred is recognized as an operating gain or loss in the consolidated statements of earnings. As of September 27, 2009 and September 28, 2008, the Company’s net ARO asset included in Net property, plant and equipment was $15.1 million and $18.5 million, respectively, while the Company’s net ARO liability included in Other long-term liabilities was $43.4 million and $44.6 million, as of the same respective dates. Stock-based Compensation The Company maintains several equity incentive plans under which it may grant non-qualified stock options, incentive stock options, restricted stock, restricted stock units (“RSUs”) or stock appreciation rights to employees, non-employee directors and consultants. The Company also has employee stock purchase plans (“ESPP”). RSUs issued by the Company are equivalent to nonvested shares under the applicable accounting guidance. See Note 14 for additional details. Foreign Currency Translation The Company’s international operations generally use their local currency as their functional currency. Assets and liabilities are translated at exchange rates in effect at the balance sheet date. Income and expense accounts are translated at the average monthly exchange rates during the year. Resulting translation adjustments are recorded as a component of Accumulated other comprehensive income on the consolidated balance sheets. Income Taxes The Company computes income taxes using the asset and liability method, under which deferred income taxes are provided for the temporary differences between the financial statement carrying amounts and the tax basis of the Company’s assets and liabilities. The Company will establish a valuation allowance for deferred tax assets if it is more likely than not that these items will either expire before the Company is able to realize their benefits, or that future deductibility is uncertain. Periodically, the valuation allowance is reviewed and adjusted based on management’s assessments of realizable deferred tax assets. Starbucks adopted the new accounting requirements for uncertain tax positions on the first day of the Company’s first fiscal quarter of 2008. The cumulative impact of adopting the new accounting requirements is shown in the consolidated statements of shareholders’ equity. The Company recognizes the tax benefit from an uncertain tax position only if it is more likely than not that the tax position will be sustained on examination by the taxing authorities, based on the technical merits of the position. The tax benefits recognized in the financial statements from such a position are measured based on the largest benefit that has a greater than 50% likelihood of being realized upon ultimate settlement. The Company recognizes interest and penalties related to income tax matters in income tax expense. See Note 15 for additional details. Earnings per Share Basic earnings per share is computed on the basis of the weighted average number of shares and common stock units that were outstanding during the period. Diluted earnings per share includes the dilutive effect of common stock equivalents consisting of certain shares subject to stock options and RSUs, using the treasury stock method. Performance-based RSUs are considered diluted when the related performance criterion has been met. 50
  • 59.
    Common Stock ShareRepurchases The Company may repurchase shares of its common stock under a program authorized by its Board of Directors including pursuant to a contract, instruction or written plan meeting the requirements of Rule 10b5-1(c)(1) of the Securities Exchange Act of 1934. In accordance with the Washington Business Corporation Act, share repurchases are not displayed separately as treasury stock on the consolidated balance sheets or consolidated statements of shareholders’ equity. Instead, the par value of repurchased shares is deducted from Common stock and the remaining excess repurchase price over par value is deducted from Additional paid-in capital and from Retained earnings, once additional paid-in capital is depleted. See Note 13 for additional information. Recent Accounting Pronouncements Starbucks adopted the new guidance issued by the Financial Accounting Standards Board (“FASB”) for fair value measurement for its financial assets and liabilities effective September 29, 2008 (see Note 5 for additional disclosures). The guidance defines fair value, establishes a framework for measuring fair value in GAAP and expands disclosures about fair value measurements. This guidance is effective for nonfinancial assets and liabilities for Starbucks first fiscal quarter of 2010. The Company believes that the adoption of this new guidance for its nonfinancial assets and liabilities will not have a material impact on its financial statements. In December 2007, the FASB issued authoritative guidance on business combinations, establishing principles and requirements for how an acquirer recognizes and measures in its financial statements the identifiable assets acquired, the liabilities assumed, any resulting goodwill, and any noncontrolling interest in an acquiree. The guidance also provides for disclosures to enable users of the financial statements to evaluate the nature and financial effects of the business combination. This new guidance will be effective for Starbucks first fiscal quarter of 2010 and must be applied prospectively to business combinations completed in fiscal 2010 and beyond. In December 2007, the FASB issued authoritative guidance on accounting and reporting for noncontrolling interests in subsidiaries. The guidance clarifies that a noncontrolling interest in a subsidiary should be accounted for as a component of equity separate from the parent’s equity. Starbucks will apply the new guidance relating to noncontrolling interests beginning in the first fiscal quarter of 2010 on a prospective basis, except for the presentation and disclosure requirements, which will be applied retrospectively. The adoption of this guidance will not have a material impact on the Company’s financial statements. In June 2009, the FASB issued authoritative guidance on the consolidation of variable interest entities (“VIE”), which will be effective for Starbucks first fiscal quarter of 2011. The new guidance requires a qualitative approach to identifying a controlling financial interest in a variable interest entity, and requires ongoing assessment of whether an entity is a VIE and whether an interest in a VIE makes the holder the primary beneficiary of the VIE. The Company is currently evaluating the impact that adoption may have on its consolidated financial statements. Note 2: Restructuring Charges In fiscal 2009, Starbucks continued to execute its restructuring efforts to position the Company for long-term profitable growth. These efforts have been focused on both the global Company-operated store base and the non- retail support organization. Starbucks actions to rationalize its store portfolio have included plans (announced in July 2008 and January 2009) to close approximately 800 Company-operated stores in the US, restructure its Australia market, and close approximately 100 additional Company-operated stores internationally. Since those announcements, nearly all of the approximately 800 US stores, 61 stores in Australia and 41 in other International markets have been closed. US Store Closures — In fiscal 2009, the Company closed 383 of the approximately 600 stores announced in July 2008, bringing the total number of US closures under this restructuring action to 588 stores. The Company also closed 183 of the approximately 200 stores announced for closure in January 2009. International Store Closures — During fiscal 2009, the Company closed 41 of the approximately 100 stores announced for closure in January 2009. The Company expects to complete the remaining closures in fiscal 2010, and will recognize the associated lease exit costs concurrently with the actual closures. 51
  • 60.
    Workforce Reduction andOther Related Costs — Workforce reductions related to store closures and non-store support positions resulted in the recognition of $19.0 million in employee termination costs in fiscal 2009. In addition, in fiscal 2009, Starbucks recognized $47.8 million of valuation adjustments on corporate office facilities that were no longer intended to be occupied by the Company. Restructuring charges by type and a reconciliation of the associated accrued liability (in millions): Lease Exit Employee and Other Asset Termination Related Costs Impairments Costs Total Total expected costs. . . . . . . . . . . . . . . . . . . . . $ 263.1 $330.8 $ 37.0 $ 630.9 Expenses recognized in fiscal 2009(1) . . . . . . . . 184.2 129.2 19.0 332.4 Expenses recognized in fiscal 2008(1) . . . . . . . . 47.8 201.6 17.5 266.9 Costs incurred in fiscal 2009(1) . . . . . . . . . . . . . 169.5 129.2 19.0 317.7 Costs incurred in fiscal 2008(1) . . . . . . . . . . . . . 62.6 201.6 17.5 281.7 Costs incurred cumulative to date . . . . . . . . . . . 232.1 330.8 36.5 599.4 Accrued liability as of September 30, 2007 . . . $ — $ — $ — Costs incurred in fiscal 2008, excluding non- cash charges and credits(2) . . . . . . . . . . . . . . 72.4 17.5 89.9 Cash payments . . . . . . . . . . . . . . . . . . . . . . . . (24.4) (12.1) (36.5) Accrued liability as of September 28, 2008 . . . 48.0 5.4 53.4 Costs incurred in fiscal 2009, excluding non- cash charges and credits(2) . . . . . . . . . . . . . . 192.6 19.0 211.6 Cash payments . . . . . . . . . . . . . . . . . . . . . . . . (137.8) (23.2) (161.0) Accrued liability as of September 27, 2009 . . . $ 102.8 $ 1.2 $ 104.0 Restructuring charges by reportable segment (in millions): Unallocated US International Corporate(3) Total Total expected costs . . . . . . . . . . . . . . . . . . . . . . . . . $458.8 $75.9 $96.2 $630.9 Expenses recognized in fiscal 2009(1) . . . . . . . . . . . . 246.3 27.0 59.1 332.4 Expenses recognized in fiscal 2008(1) . . . . . . . . . . . . 210.9 19.2 36.8 266.9 Costs incurred in fiscal 2009(1) . . . . . . . . . . . . . . . . . 231.4 27.1 59.2 317.7 Costs incurred in fiscal 2008(1) . . . . . . . . . . . . . . . . . 225.7 19.2 36.8 281.7 Costs incurred cumulative to date . . . . . . . . . . . . . . . 457.1 46.3 96.0 599.4 (1) The difference between expenses recognized and costs incurred within a period is due to lease termination agreements that were finalized in one period for store closures to occur in a subsequent period. Such termination fees are amortized on a straight-line basis from the date of the termination agreement to the date of closure. (2) Non-cash charges and credits for Lease exit and other related costs primarily represent deferred rent balances recognized as expense credits at the cease-use date. (3) Includes $1.0 million of employee termination costs for the CPG segment for fiscal 2009. 52
  • 61.
    Note 3: Investments Short-termand long-term investments (in millions): Gross Gross Unrealized Unrealized Amortized Holding Holding Fair Cost Gains Losses Value September 27, 2009 Short-term investments — available-for-sale securities: Corporate debt securities . . . . . . . . . . . . . . . . . . . . . $ 2.5 $ 2.5 Government treasury securities . . . . . . . . . . . . . . . . 19.0 19.0 Total . . . . . . . . . . . . . . . . . . . . . . . . . . . . . . . . . . 21.5 21.5 Short-term investments — trading securities . . . . . . . . . 58.5 44.8 Total short-term investments . . . . . . . . . . . . . . . . . . . . $80.0 $66.3 Long-term investments — available-for-sale securities: State and local government obligations. . . . . . . . . . . $57.8 $— $(2.1) $55.7 Corporate debt securities . . . . . . . . . . . . . . . . . . . . . 14.7 0.8 — 15.5 Total long-term investments. . . . . . . . . . . . . . . . . . . . . $72.5 $0.8 $(2.1) $71.2 September 28, 2008 Short-term investments — available-for-sale securities: Corporate debt securities . . . . . . . . . . . . . . . . . . . . . $ 3.0 $ 3.0 Total . . . . . . . . . . . . . . . . . . . . . . . . . . . . . . . . . . 3.0 3.0 Short-term investments — trading securities . . . . . . . . . 58.2 49.5 Total short-term investments . . . . . . . . . . . . . . . . . . . . $61.2 $52.5 Long-term investments — available-for-sale securities: State and local government obligations. . . . . . . . . . . $65.8 $— $(6.0) $59.8 Corporate debt securities . . . . . . . . . . . . . . . . . . . 12.1 — (0.5) 11.6 Total long-term investments. . . . . . . . . . . . . . . . . . . . . $77.9 $— $(6.5) $71.4 Available-for-sale securities Proceeds from sales of available-for-sale securities were $5.0 million, $75.9 million and $47.5 million and in fiscal years 2009, 2008 and 2007, respectively. For fiscal years 2009, 2008 and 2007, there were immaterial realized gains and losses on sales and maturities. As of September 27, 2009, the Company’s long-term available-for-sale securities of $71.2 million included $55.7 million invested in auction rate securities (“ARS”). As of September 28, 2008, the Company’s long-term available-for-sale securities of $71.4 million included $59.8 million invested in ARS. ARS have long-dated maturities but provide liquidity through a Dutch auction process that resets the applicable interest rate at pre- determined calendar intervals. Due to the auction failures that began in February 2008, these securities became illiquid and were classified as long-term investments. The investment principal associated with the failed auctions will not be accessible until: • successful auctions resume; • an active secondary market for these securities develops; • the issuers replace these securities with another form of financing; or • final payments are made according to the contractual maturities of the debt issues which range from 21 to 36 years. 53
  • 62.
    The Company doesnot intend to sell the ARS, nor is it likely it will be required to sell the ARS before their anticipated recovery. The Company expects such recoveries to occur prior to the contractual maturities. In fiscal 2009, one ARS was called at par value of $7.4 million and one ARS was partially called at par value of $0.6 million. The Company had $2.1 million and $6.0 million of accumulated unrealized losses on ARS as of the end of fiscal 2009 and 2008, respectively, determined to be temporary, which is included in Accumulated other comprehensive income as a reduction in shareholders’ equity. As of September 27, 2009, approximately $4.9 million in ARS were rated A/B2 by Standard & Poor’s and Moody’s, respectively. All of the remaining securities were rated investment grade or higher by two or more of the following rating agencies: Moody’s, Standard & Poor’s and Fitch Ratings. The Company’s ARS are collateralized by portfolios of student loans, substantially all of which are guaranteed by the United States Department of Education. The following table presents the length of time available-for-sale securities were in continuous unrealized loss positions but were not determined to be other-than-temporarily impaired (in millions): Consecutive Monthly Unrealized Losses Greater Than Less Than or Equal to 12 Months 12 months Gross Gross Unrealized Unrealized Holding Fair Holding Fair Losses Value Losses Value September 27, 2009 State and local government obligations . . . . . . . . . . . . . . . $ — $ — $(2.1) $55.7 Total . . . . . . . . . . . . . . . . . . . . . . . . . . . . . . . . . . . . . . . . $ — $ — $(2.1) $55.7 September 28, 2008 State and local government obligations . . . . . . . . . . . . . . . $(6.0) $59.8 $ — $ — Corporate debt securities . . . . . . . . . . . . . . . . . . . . . . . . . (0.5) 11.6 — — Total . . . . . . . . . . . . . . . . . . . . . . . . . . . . . . . . . . . . . . . . $(6.5) $71.4 $ — $ — Gross unrealized holding losses on the state and local obligations pertain to the Company’s eleven ARS. As Starbucks does not intend to sell these securities, nor is it likely it will be required to sell these securities before their anticipated recovery, which may be at maturity, the Company does not consider these securities to be other-than-temporarily impaired. There were no realized losses recorded for other than temporary impairments during fiscal years 2009, 2008 or 2007. Trading securities Trading securities are comprised of marketable equity mutual funds and equity exchange-traded funds that approximate a portion of the Company’s liability under the Management Deferred Compensation Plan (“MDCP”), a defined contribution plan. The corresponding deferred compensation liability of $68.3 million and $68.0 million in fiscal 2009 and 2008, respectively, is included in Accrued compensation and related costs on the consolidated balance sheets. The changes in net unrealized holding gains/losses in the trading portfolio included in earnings for the years ended September 27, 2009 and September 28, 2008 were a net loss of $4.9 million and $14.5 million, respectively. 54
  • 63.
    Note 4: DerivativeFinancial Instruments Cash Flow Hedges The Company and certain subsidiaries enter into cash flow derivative instruments to hedge portions of anticipated revenue streams and inventory purchases in currencies other than the entity’s functional currency. Outstanding forward contracts, which comprise the majority of the Company’s derivative instruments, hedge monthly forecasted revenue transactions denominated in Japanese yen and Canadian dollars, as well as forecasted inventory purchases denominated in US dollars for foreign operations. From time to time, the Company also uses futures contracts to hedge the variable price component for a small portion of its price-to-be-fixed green coffee purchase contracts. The Company had net derivative losses of $3.9 million and $9.2 million, net of taxes, in Accumulated OCI as of September 27, 2009 and September 28, 2008, respectively, related to cash flow hedges. Of the net derivative losses accumulated as of September 28, 2009, $0.9 million pertain to hedging instruments that will be dedesignated within 12 months and will also continue to experience fair value changes before affecting earnings. Ineffectiveness from hedges that were discontinued in fiscal years 2009 and 2008 was insignificant. Outstanding contracts will expire within 36 months. Net Investment Hedges Net investment derivative instruments are used to hedge the Company’s equity method investment in Starbucks Coffee Japan, Ltd. (“Starbucks Japan”) as well as the Company’s net investments in its Canada, UK and China subsidiaries, to minimize foreign currency exposure. The Company had net derivative losses of $19.8 million and $13.0 million, net of taxes, in Accumulated OCI as of September 27, 2009 and September 28, 2008, respectively, related to net investment derivative hedges. Outstanding contracts will expire within 18 months. Other Derivatives The Company enters into certain foreign currency forward contracts that are not designated as hedging instruments to mitigate the translation risk of certain balance sheet items. These contracts are recorded at fair value, with the changes in fair value recognized in Net interest income and other on the consolidated statements of earnings. For the fiscal years 2009 and 2008, these forward contracts resulted in a net gain of $20.0 million and a net loss $0.1 million, respectively. These gains and losses were largely offset by the financial impact of translating foreign currency denominated payables and receivables, which are also recognized in Net interest income and other. In the third quarter of fiscal 2009, the Company entered into certain swap and futures contracts that are not designated as hedging instruments to mitigate the price uncertainty of a portion of its future purchases of dairy products and diesel fuel. These contracts are recorded at fair value, with the changes in fair value recognized in Net interest income and other on the consolidated statement of earnings. For the fiscal year 2009, these swaps and futures contracts resulted in a net loss of $0.6 million. 55
  • 64.
    Fair values ofderivative instruments on the consolidated balance sheet as of September 27, 2009 (in millions): Assets Liabilities Contract Type Balance Sheet Location Fair Value Balance Sheet Location Fair Value Derivatives designated as hedging instrument for accounting purposes: Cash Flow Hedges: Foreign Exchange . . . . . Prepaid expenses and other current assets $ 6.3 Other accrued expenses . . $ 6.6 Foreign Exchange . . . . . Other assets Other long-term 5.5 liabilities . . . . . . . . . . . . . 5.6 11.8 12.2 Net Investment Hedges: Foreign Exchange . . . . . Prepaid expenses and other current assets 0.4 Other accrued expenses . . 4.7 Foreign Exchange . . . . . Other assets Other long-term — liabilities . . . . . . . . . . . . . 6.4 0.4 11.1 Total derivatives designated as hedging instrument for accounting purposes . . . . . . . . . . . . . . . . . . . . . . . . . $12.2 $23.3 Derivatives not designated as hedging instruments for accounting purposes: Foreign Exchange . . . . . Prepaid expenses and other current assets $ 0.9 Other accrued expenses . . $ 9.6 Commodity . . . . . . . . . Prepaid expenses and other current assets 0.1 Other accrued expenses . . 0.3 Total derivatives not designated as hedging instruments for accounting purposes . . . . . . . . . . . . . . . . . . . . . . 1.0 9.9 Total Derivatives . . . . . $13.2 $33.2 The following table presents the effect of derivative instruments on the consolidated statements of earnings in fiscal 2009 (in millions): Location of Gain/(Loss) Reclassified from Accumulated OCI into Earnings - Gain/(Loss) Reclassed from Contract Type Gain/(Loss) Recognized in OCI Effective Portion Accumulated OCI to Earnings Derivatives designated as hedging instruments for accounting purposes: Cash Flow Hedges: Foreign Exchange(1) . . $ 9.3 Total net revenue . . . . . $(4.5) Cost of sales including occupancy costs . . . . . . 6.0 Commodity . . . . . . . . (1.5) Cost of sales including occupancy costs . . . . . . (1.0) Interest rate(2) . . . . . . — Interest expense . . . . . . (0.7) 7.8 (0.2) Net Investment Hedges: Foreign Exchange(3) . . (10.8) — Total . . . . . . . . . . . . . $ (3.0) $(0.2) 56
  • 65.
    Location of Gain/(Loss) Gain/(Loss) Recognized in Earnings Recognized in Earnings Derivatives not designated as hedging instruments for accounting purposes: Foreign Exchange Interest income and other, net $22.8 Commodity Interest Income and other, net $ (0.6) (1) In fiscal 2009, $0.3 million of gain was recognized in Net interest income and other related to the ineffective portion. (2) The Company entered into, dedesignated and settled forward interest rate contracts to hedge movements in interest rates prior to issuing its $550 million 6.25% Senior Notes in fiscal 2007. The resulting net losses from these contracts will continue to be reclassified to Interest expense on the consolidated statements of earnings over the life of the Senior Notes due in 2017. (3) In fiscal 2009, $3.7 million of gain was recognized in Net interest income and other related to the ineffective portion. The Company had the following outstanding derivative contracts as of September 27, 2009, based on notional amounts: • $708 million in foreign exchange contracts • $25 million in dairy contracts • $7 million in diesel contracts Note 5: Fair Value Measurements The Company adopted the new fair value accounting guidance related to financial assets and liabilities effective September 29, 2008, and will adopt the new fair value accounting guidance for nonfinancial assets and liabilities in the first fiscal quarter of 2010. The new fair value accounting guidance allows for this two-step adoption approach. The Company continues to evaluate the potential impact of the adoption of fair value measurements related to its property, plant and equipment, goodwill and other intangible assets. The guidance defines fair value, establishes a framework for measuring fair value under GAAP and expands disclosures about fair value measurements. It also establishes a fair value hierarchy that prioritizes the inputs used to measure fair value: • Level 1: Observable inputs that reflect unadjusted quoted prices for identical assets or liabilities traded in active markets. • Level 2: Inputs other than quoted prices included within Level 1 that are observable for the asset or liability, either directly or indirectly. • Level 3: Inputs that are generally unobservable. These inputs may be used with internally developed methodologies that result in management’s best estimate of fair value. 57
  • 66.
    Financial Assets andLiabilities Measured at Fair Value on a Recurring Basis (in millions): Sep 27, 2009 Level 1 Level 2 Level 3 Assets: Trading securities . . . . . . . . . . . . . . . . . . . . . . . . . . . . . . . $ 44.8 $44.8 $ — $ — Available-for-sale securities . . . . . . . . . . . . . . . . . . . . . . . 92.7 19.0 18.0 55.7 Derivatives . . . . . . . . . . . . . . . . . . . . . . . . . . . . . . . . . . . . 13.2 — 13.2 — Total . . . . . . . . . . . . . . . . . . . . . . . . . . . . . . . . . . . . . . . . $150.7 $63.8 $31.2 $55.7 Liabilities: Derivatives . . . . . . . . . . . . . . . . . . . . . . . . . . . . . . . . . . . . $ 33.2 $ — $33.2 $ — Trading securities include equity mutual funds and exchange-traded funds. For these securities, the Company uses quoted prices in active markets for identical assets to determine their fair value, thus they are considered to be Level 1 instruments. Available-for-sale securities include government treasury securities, corporate bonds and ARS. For government treasury securities, the Company uses quoted prices in active markets for identical assets to determine their fair value, thus they are considered to be Level 1 instruments. The Company uses observable direct and indirect inputs for corporate bonds, which are considered Level 2 instruments. Level 3 instruments are comprised solely of ARS, all of which are considered to be illiquid due to the auction failures that began in February 2008. The Company values ARS using an internally developed valuation model, whose inputs include interest rate curves, credit and liquidity spreads, and effective maturity. Derivative assets and liabilities include foreign currency forward contracts, commodity swaps and futures contracts. Where applicable, the Company uses quoted prices in an active market for identical derivative assets and liabilities that are traded on exchanges. These derivative assets and liabilities are coffee and dairy futures contracts, and are included in Level 1. Derivative assets and liabilities included in Level 2 are over-the-counter currency forward contracts and commodity swaps whose fair values are estimated using industry-standard valuation models. Such models project future cash flows and discount the future amounts to a present value using market-based observable inputs, including interest rate curves and forward and spot prices for currencies and commodities. Changes in Level 3 Instruments Measured at Fair Value on a Recurring Basis (in millions): ARS Beginning balance, September 28, 2008 . . . . . . . . . . . . . . . . . . . . . . . . . . . . . . . . . . . . . . . . $59.8 Total reduction in unrealized losses included in other comprehensive income . . . . . . . . . . . . . 3.9 Purchases, sales, issuances, and settlements . . . . . . . . . . . . . . . . . . . . . . . . . . . . . . . . . . . . . (8.0) Transfers in (out) of Level 3 . . . . . . . . . . . . . . . . . . . . . . . . . . . . . . . . . . . . . . . . . . . . . . . . — Ending balance, September 27, 2009 . . . . . . . . . . . . . . . . . . . . . . . . . . . . . . . . . . . . . . . . . . $55.7 Financial Assets and Liabilities Measured at Fair Value on a Nonrecurring Basis The Company measures certain financial assets, including its cost and equity method investments, at fair value on a nonrecurring basis. These assets are recognized at fair value when they are deemed to be other-than-temporarily impaired. 58
  • 67.
    Note 6: Inventories Inventoriesconsisted of the following (in millions): Sep 27, 2009 Sep 28, 2008 Coffee: Unroasted . . . . . . . . . . . . . . . . . . . . . . . . . . . . . . . . . . . . . . . . . . . . . . $381.6 $377.7 Roasted. . . . . . . . . . . . . . . . . . . . . . . . . . . . . . . . . . . . . . . . . . . . . . . . 76.7 89.6 Other merchandise held for sale . . . . . . . . . . . . . . . . . . . . . . . . . . . . . . . 116.0 120.6 Packaging and other supplies. . . . . . . . . . . . . . . . . . . . . . . . . . . . . . . . . . 90.6 104.9 Total . . . . . . . . . . . . . . . . . . . . . . . . . . . . . . . . . . . . . . . . . . . . . . . . . . . $664.9 $692.8 Other merchandise held for sale includes, among other items, serveware, tea and brewing equipment. As of September 27, 2009, the Company had committed to purchasing green coffee totaling $155 million under fixed-price contracts and an estimated $84 million under price-to-be-fixed contracts. The Company believes, based on relationships established with its suppliers in the past, the risk of non-delivery on such purchase commitments is remote. Note 7: Equity and Cost Investments Equity and cost investments (in millions): Sep 27, 2009 Sep 28, 2008 Equity method investments . . . . . . . . . . . . . . . . . . . . . . . . . . . . . . . . . . . $313.2 $267.9 Cost method investments . . . . . . . . . . . . . . . . . . . . . . . . . . . . . . . . . . . . . 39.1 34.7 Total . . . . . . . . . . . . . . . . . . . . . . . . . . . . . . . . . . . . . . . . . . . . . . . . . . . $352.3 $302.6 Equity Method Investments Equity investees and ownership interests by reportable operating segment: Sep 27, 2009 Sep 28, 2008 United States StarCon, LLC . . . . . . . . . . . . . . . . . . . . . . . . . . . . . . . . . . . . . . . . . . . —% 50.0% International Starbucks Coffee Korea Co., Ltd. . . . . . . . . . . . . . . . . . . . . . . . . . . . . 50.0 50.0 Starbucks Coffee Austria GmbH . . . . . . . . . . . . . . . . . . . . . . . . . . . . . 50.0 50.0 Starbucks Coffee Switzerland AG . . . . . . . . . . . . . . . . . . . . . . . . . . . . 50.0 50.0 Starbucks Coffee España, S.L . . . . . . . . . . . . . . . . . . . . . . . . . . . . . . . 50.0 50.0 President Starbucks Coffee Taiwan Ltd. . . . . . . . . . . . . . . . . . . . . . . . 50.0 50.0 Shanghai President Coffee Co. . . . . . . . . . . . . . . . . . . . . . . . . . . . . . . 50.0 50.0 Starbucks Coffee France SAS . . . . . . . . . . . . . . . . . . . . . . . . . . . . . . . 50.0 50.0 Berjaya Starbucks Coffee Company Sdn. Bhd. (Malaysia) . . . . . . . . . . 50.0 50.0 Starbucks Brasil Comercio de Cafes Ltda. . . . . . . . . . . . . . . . . . . . . . . 49.0 49.0 Starbucks Coffee Japan, Ltd. . . . . . . . . . . . . . . . . . . . . . . . . . . . . . . . . 40.1 40.1 Starbucks Coffee Portugal Lda. . . . . . . . . . . . . . . . . . . . . . . . . . . . . . . 50.0 50.0 CPG The North American Coffee Partnership . . . . . . . . . . . . . . . . . . . . . . . . 50.0 50.0 Starbucks Ice Cream Partnership . . . . . . . . . . . . . . . . . . . . . . . . . . . . . 50.0 50.0 59
  • 68.
    StarCon, LLC wasa joint venture formed in March 2007 with Concord Music Group, Inc. (“Concord”). The Company sold its 50% ownership interest to Concord in early fiscal 2009. The International entities operate licensed Starbucks retail stores. See Note 19 for a discussion of a transaction affecting the Company’s ownership related to its markets in France, Spain and Portugal. The Company also has licensed the rights to produce and distribute Starbucks branded products to two partnerships in which the Company holds 50% equity interests. The North American Coffee Partnership with the Pepsi-Cola Company develops and distributes bottled Frappuccino» beverages and Starbucks DoubleShot» espresso drinks. Starbucks Ice Cream Partnership developed and distributed super premium ice creams, and was in the process of being dissolved at the end of fiscal 2009. It was replaced by a licensing agreement with Unilever for the manufacturing, marketing and distribution of Starbucks super-premium ice cream products in the US. Prior to fiscal 2005, Starbucks acquired equity interest in its licensed operations of Malaysia, Austria, Shanghai, Spain, Switzerland and Taiwan. The carrying amount of these investments was $24.3 million more than the underlying equity in net assets due to acquired goodwill, which is evaluated for impairment annually. No impairments were recorded during fiscal years 2009, 2008 or 2007. The Company’s share of income and losses from its equity method investments is included in Income from equity investees on the consolidated statements of earnings. Also included in this line item is the Company’s proportionate share of gross margin resulting from coffee and other product sales to, and royalty and license fee revenues generated from, equity investees. Revenues generated from these related parties, net of eliminations, were $125.3 million, $128.1 million and $107.9 million in fiscal years 2009, 2008 and 2007, respectively. Related costs of sales, net of eliminations, were $64.9 million, $66.2 million and $57.1 million in fiscal years 2009, 2008 and 2007, respectively. As of September 27, 2009 and September 28, 2008, there were $37.6 million and $40.6 million of accounts receivable, respectively, on the consolidated balance sheets from equity investees primarily related to product sales and store license fees. As of September 27, 2009, the aggregate market value of the Company’s investment in Starbucks Japan was approximately $241 million, based on its available quoted market price. Summarized combined financial information of the Company’s equity method investees, which represent 100% of the investees’ financial information (in millions): Financial Position as of Sep 27, 2009 Sep 28, 2008 Current assets . . . . . . . . . . ................................... $315.8 $247.2 Noncurrent assets . . . . . . . ................................... 657.6 604.9 Current liabilities . . . . . . . ................................... 292.0 273.5 Noncurrent liabilities. . . . . ................................... 76.5 59.8 Results of Operations for Fiscal Year Ended Sep 27, 2009 Sep 28, 2008 Sep 30, 2007 Net revenues . . . . . . . . . . . . . . . . . . . . . . . . . . . . . . . . . . . $2,100.1 $1,961.0 $1,452.9 Operating income . . . . . . . . . . . . . . . . . . . . . . . . . . . . . . . 192.5 171.3 186.2 Net earnings . . . . . . . . . . . . . . . . . . . . . . . . . . . . . . . . . . . 155.8 136.9 159.5 Cost Method Investments The Company has equity interests in entities that develop and operate Starbucks licensed retail stores in several global markets. The value of these investments was $36.6 million and $31.9 million as of September 27, 2009 and September 28, 2008, respectively. Additionally, Starbucks has investments in privately held equity securities unrelated to Starbucks licensed retail stores. The value of these investments was $2.5 million at September 27, 2009 and $2.8 million at September 28, 2008. As of September 27, 2009 and September 28, 2008, management determined that the estimated fair values of each cost method investment exceeded the related carrying values. In the third quarter of fiscal 2009 Starbucks recognized a loss of $0.3 million on one of the investments that is unrelated to Starbucks licensed retail stores. There were no realized losses recorded for other-than-temporary impairment of the Company’s cost method investments during fiscal years 2008 or 2007. 60
  • 69.
    Starbucks has theability to acquire additional interests in some of these cost method investees at certain intervals. Depending on the Company’s total percentage of ownership interest and its ability to exercise significant influence over financial and operating policies, additional investments may require the retroactive application of the equity method of accounting. Note 8: Property, Plant and Equipment Property, plant and equipment (in millions): Sep 27, 2009 Sep 28, 2008 Land . . . . . . . . . . . . . . . . . . . . . . . . . . . . . . . . . . . . . . . . . . . . . . . . . . . $ 58.2 $ 59.1 Buildings . . . . . . . . . . . . . . . . . . . . . . . . . . . . . . . . . . . . . . . . . . . . . . . . 231.5 217.7 Leasehold improvements . . . . . . . . . . . . . . . . . . . . . . . . . . . . . . . . . . . . . 3,349.0 3,363.1 Store equipment . . . . . . . . . . . . . . . . . . . . . . . . . . . . . . . . . . . . . . . . . . . 1,073.4 1,045.3 Roasting equipment . . . . . . . . . . . . . . . . . . . . . . . . . . . . . . . . . . . . . . . . 282.9 220.7 Furniture, fixtures and other . . . . . . . . . . . . . . . . . . . . . . . . . . . . . . . . . . 586.7 517.8 Work in progress . . . . . . . . . . . . . . . . . . . . . . . . . . . . . . . . . . . . . . . . . . 119.2 293.6 5,700.9 5,717.3 Less accumulated depreciation and amortization . . . . . . . . . . . . . . . . . . . (3,164.5) (2,760.9) Property, plant and equipment, net . . . . . . . . . . . . . . . . . . . . . . . . . . . . . . $ 2,536.4 $ 2,956.4 Note 9: Other Intangible Assets and Goodwill Other intangible assets (in millions): Sep 27, 2009 Sep 28, 2008 Indefinite-lived intangibles . . . . . . . . . . . . . . . . . . . . . . . . . . . . . . . . . . . $60.8 $58.3 Definite-lived intangibles . . . . . . . . . . . . . . . . . . . . . . . . . . . . . . . . . . . . 15.0 14.2 Accumulated amortization . . . . . . . . . . . . . . . . . . . . . . . . . . . . . . . . . . . . (7.6) (5.9) Definite-lived intangibles, net . . . . . . . . . . . . . . . . . . . . . . . . . . . . . . . . . 7.4 8.3 Total other intangible assets . . . . . . . . . . . . . . . . . . . . . . . . . . . . . . . . . . $68.2 $66.6 Definite-lived intangibles approximate remaining weighted average useful life in years. . . . . . . . . . . . . . . . . . . . . . . . . . . . . . . . . . . . . . . . . . . . . 8 8 Amortization expense for definite-lived intangibles was $1.7 million, $1.5 million and $1.0 million during fiscal 2009, 2008 and 2007, respectively. Estimated amortization expense for each of the next five fiscal years and thereafter, as of September 27, 2009 (in millions): Fiscal Year Ending 2010 . . . . . . . . . . . . . . . . . . . . . . . . . . . . . . . . . . . . . . . ............................ $1.1 2011 . . . . . . . . . . . . . . . . . . . . . . . . . . . . . . . . . . . . . . . ............................ 1.0 2012 . . . . . . . . . . . . . . . . . . . . . . . . . . . . . . . . . . . . . . . ............................ 1.0 2013 . . . . . . . . . . . . . . . . . . . . . . . . . . . . . . . . . . . . . . . ............................ 0.9 2014 . . . . . . . . . . . . . . . . . . . . . . . . . . . . . . . . . . . . . . . ............................ 0.8 Thereafter . . . . . . . . . . . . . . . . . . . . . . . . . . . . . . . . . . . ............................ 2.6 Total . . . . . . . . . . . . . . . . . . . . . . . . . . . . . . . . . . . . . . . . . . . . . . . . . . . . . . . . . . . . . . . . . . . $7.4 61
  • 70.
    Changes in thecarrying amount of goodwill by reportable operating segment for the fiscal year ended September 27, 2009 (in millions): United States International CPG Total Balance as of September 28, 2008 . . . . . . . . . . . . . . $118.1 $117.4 $31.0 $266.5 Purchase price adjustment of previous acquisitions . . — (1.2) — (1.2) Impairment . . . . . . . . . . . . . . . . . . . . . . . . . . . . . . . (7.0) — — (7.0) Other . . . . . . . . . . . . . . . . . . . . . . . . . . . . . . . . . . . . — 0.8 — 0.8 Balance as of September 27, 2009 . . . . . . . . . . . . . . $111.1 $117.0 $31.0 $259.1 United States The impairment of $7.0 million relates to the Company’s Hawaii reporting unit as discussed further in Note 1. International The decrease in goodwill of $1.2 million was due to purchase price adjustments for property, plant and equipment acquired as a part of the Coffee Vision, Inc. acquisition, completed in the fourth quarter of fiscal 2008. The increase in goodwill of $0.8 million included in Other was due to foreign currency fluctuations. Note 10: Debt Debt consisted of the following (in millions): Sep 27, 2009 Sep 28, 2008 Commercial paper program (end of period weighted average interest rate of 3.4)% . . . . . . . . . . . . . . . . . . . . . . . . . . . . . . . . . . . . . . . . . . . . . . . $ — $ 413.0 Revolving credit facility (end of period weighted average interest rate of 3.5)% . . . . . . . . . . . . . . . . . . . . . . . . . . . . . . . . . . . . . . . . . . . . . . . . . — 300.0 Current portion of long-term debt . . . . . . . . . . . . . . . . . . . . . . . . . . . . . . 0.2 0.7 Short-term debt . . . . . . . . . . . . . . . . . . . . . . . . . . . . . . . . . . . . . . . . . . 0.2 713.7 6.25% 10-year Senior Notes (due Aug 2017) . . . . . . . . . . . . . . . . . . . . . . 549.2 549.2 Other long-term debt. . . . . . . . . . . . . . . . . . . . . . . . . . . . . . . . . . . . . . . . 0.1 0.4 Long-term debt . . . . . . . . . . . . . . . . . . . . . . . . . . . . . . . . . . . . . . . . . . 549.3 549.6 Total debt . . . . . . . . . . . . . . . . . . . . . . . . . . . . . . . . . . . . . . . . . . . . . . $549.5 $1,263.3 Revolving Credit Facility and Commercial Paper Program The Company has a $1 billion unsecured credit facility (the “credit facility”) with various banks, of which $100 million may be used for issuances of letters of credit. The credit facility is available for working capital, capital expenditures and other corporate purposes, which may include acquisitions and share repurchases. The credit facility is currently set to terminate in August 2011. On October 31, 2008, the Company entered into an amendment to its facility that, among other changes, increased the interest rate range for borrowings under the credit facility to 0.21% to 0.67% over LIBOR or the greater of the bank prime rate or the Federal Funds Rate plus 0.50%. The specific spread over LIBOR will continue to depend upon the Company’s long-term credit ratings assigned by Moody’s and Standard & Poor’s rating agencies and the Company’s coverage ratio. The credit facility contains provisions requiring the Company to maintain compliance with certain covenants, including a minimum fixed charge coverage ratio which measures the Company’s ability to cover financing expenses. Under the Company’s commercial paper program it may issue unsecured commercial paper notes, up to a maximum aggregate amount outstanding at any time of $1 billion, with individual maturities that may vary, but not exceed 397 days from the date of issue. The program is backstopped by the Company’s credit facility, and the combined 62
  • 71.
    borrowing limit is$1 billion for the commercial paper program and the credit facility. The Company may issue commercial paper from time to time, and the proceeds of the commercial paper financing will be used for working capital needs, capital expenditures and other corporate purposes, which may include acquisitions and share repurchases. As of September 27, 2009, the Company also had $14.1 million in letters of credit outstanding under the credit facility, leaving a total of $985.9 million in remaining borrowing capacity under the combined credit facility and commercial paper program. As of September 28, 2008, letters of credit totaling $15.9 million were outstanding. Long-term Debt In August 2007, the Company issued $550 million of 6.25% Senior Notes (the “notes”) due in August 2017, in an underwritten registered public offering. Interest is payable semi-annually on February 15 and August 15 of each year. The notes require the Company to maintain compliance with certain covenants, which limit future liens and sale and leaseback transactions on certain material properties. Other long term debt, totaling $0.1 million as of September 27, 2009, matures in fiscal 2011. Scheduled principal payments on long-term debt are as follows (in millions): Fiscal Year Ending 2010 . . . . . . . .................................................. . . . . . . . . $ 0.3 2011 . . . . . . . .................................................. ........ 0.1 2012 . . . . . . . .................................................. ........ — 2013 . . . . . . . .................................................. ........ — 2014 . . . . . . . .................................................. ........ — Thereafter . . . .................................................. . . . . . . . . 550.0 Total principal payments . . . . . . . . . . . . . . . . . . . . . . . . . . . . . . . . . . . . . . . . . . . . . . . . . . $550.4 Interest Expense Interest expense, net of interest capitalized, was $39.1 million, $53.4 million and $38.2 million in fiscal 2009, 2008 and 2007, respectively. In fiscal 2009, 2008 and 2007, $2.9 million, $7.2 million and $3.9 million, respectively, of interest was capitalized for new store and other asset construction projects, and included in Net property, plant and equipment on the consolidated balance sheets. Note 11: Other Long-term Liabilities Other long-term liabilities (in millions): Sep 27, 2009 Sep 28, 2008 Deferred rent . . . . . . . . . . . . . . . . . . . . . . . . . . . . . . . . . . . . . . . . . . . . . $266.0 $303.9 Unrecognized tax benefits . . . . . . . . . . . . . . . . . . . . . . . . . . . . . . . . . . . . 55.1 60.4 Asset retirement obligations . . . . . . . . . . . . . . . . . . . . . . . . . . . . . . . . . . 43.4 44.6 Minority interest . . . . . . . . . . . . . . . . . . . . . . . . . . . . . . . . . . . . . . . . . . . 11.2 18.3 Other . . . . . . . . . . . . . . . . . . . . . . . . . . . . . . . . . . . . . . . . . . . . . . . . . . . 25.1 15.2 Total . . . . . . . . . . . . . . . . . . . . . . . . . . . . . . . . . . . . . . . . . . . . . . . . . . . $400.8 $442.4 Deferred rent liabilities represent amounts for tenant improvement allowances, rent escalation clauses and rent holidays related to certain operating leases. The Company amortizes deferred rent over the terms of the leases as reductions to rent expense on the consolidated statements of earnings. Unrecognized tax benefits represent the estimated long-term portion of the Company’s gross unrecognized tax benefits including interest. See Notes 1 and 15 for additional information. Asset retirement obligations represent the estimated fair value of the Company’s 63
  • 72.
    future costs ofremoving leasehold improvements at the termination of leases for certain stores and administrative facilities. Minority interest represents the collective ownership interests of minority shareholders for operations accounted for under the consolidation method, in which Starbucks owns less than 100% of the equity interest. The other remaining long-term liabilities generally include obligations to be settled or paid for one year beyond each period presented, for items such as hedging instruments and the long-term portion of capital lease obligations. Note 12: Leases In the fourth quarter of fiscal 2009 Starbucks determined that there was an immaterial classification error in the lease footnote of the 2008 10-K. Amounts of $25.7 million and $22.7 million for the fiscal years ended September 28, 2008 and September 30, 2007, respectively, were incorrectly classified as contingent rent that should have been classified as minimum rentals. The total for rent expense under operating leases was not impacted. The following table reflects the corrected amounts for fiscal 2008 and 2007. Rental expense under operating lease agreements (in millions): Fiscal Year Ended Sep 27, 2009 Sep 28, 2008 Sep 30, 2007 Minimum rentals . . . . . . . . . . . . . . . . . . . . . . . . . . . . . . . . $690.0 $709.1 $609.9 Contingent rentals . . . . . . . . . . . . . . . . . . . . . . . . . . . . . . . 24.7 32.0 28.2 Total . . . . . . . . . . . . . . . . . . . . . . . . . . . . . . . . . . . . . . . . . $714.7 $741.1 $638.1 Minimum future rental payments under noncancelable operating leases as of September 27, 2009 (in millions): Fiscal Year Ending 2010 . . . . . . . . . . . . . . . . . . . . . . . . . . . . . . . . . . . . . . . . . . . . . . . . . . . . . . . . . . . . . . . . $ 706.7 2011 . . . . . . . . . . . . . . . . . . . . . ........................................... 669.0 2012 . . . . . . . . . . . . . . . . . . . . . ........................................... 612.3 2013 . . . . . . . . . . . . . . . . . . . . . ........................................... 551.0 2014 . . . . . . . . . . . . . . . . . . . . . ........................................... 488.1 Thereafter . . . . . . . . . . . . . . . . . ........................................... 1,362.1 Total minimum lease payments . . . . . . . . . . . . . . . . . . . . . . . . . . . . . . . . . . . . . . . . . . . . $4,389.2 The Company has subleases related to certain of its operating leases. During fiscal 2009, 2008 and 2007, the Company recognized sublease income of $7.1 million, $3.5 million and $3.6 million, respectively. The Company had capital lease obligations of $7.8 million and $6.7 million as of September 27, 2009 and September 28, 2008, respectively. Capital lease obligations expire at various dates, with the latest maturity in 2015. The current portion of the total obligation is included in Other accrued expenses and the remaining long-term portion is included in Other long-term liabilities on the consolidated balance sheets. Assets held under capital leases are included in Net property, plant and equipment on the consolidated balance sheets. The Company had $76.2 million and $91.1 million in prepaid rent included in Prepaid expenses and other current assets on the consolidated balance sheets as of September 27, 2009 and September 28, 2008, respectively. Note 13: Shareholders’ Equity In addition to 1.2 billion shares of authorized common stock with $0.001 par value per share, the Company has authorized 7.5 million shares of preferred stock, none of which was outstanding at September 27, 2009. 64
  • 73.
    Share repurchase activitywas as follows (in millions, except for average price data): Fiscal Year Ending Sep 27, 2009 Sep 28, 2008 Number of shares acquired . . . . . . . . . . . . . . . . . . . . . . . . . . . . . . . . . . . — 12.2 Average price per share of acquired shares. . . . . . . . . . . . . . . . . . . . . . . . — $24.12 Total accrual-based cost of acquired shares . . . . . . . . . . . . . . . . . . . . . . . — $295.3 Total cash-based cost of acquired shares . . . . . . . . . . . . . . . . . . . . . . . . . — $311.4 The difference between the accrual-based and cash-based cost of acquired shares represents the effect of the net change in unsettled trades from the prior fiscal year end. As of September 27, 2009, 6.3 million shares remained available for repurchase under current authorizations. Comprehensive Income Comprehensive income includes all changes in equity during the period, except those resulting from transactions with shareholders of the Company. It has two components: net earnings and other comprehensive income. Accumulated other comprehensive income reported on the Company’s consolidated balance sheets consists of foreign currency translation adjustments and the unrealized gains and losses, net of applicable taxes, on available-for-sale securities and on derivative instruments designated and qualifying as cash flow and net investment hedges. Comprehensive income, net of related tax effects (in millions): Fiscal Year Ended Sep 27, 2009 Sep 28, 2008 Sep 30, 2007 Net earnings . . . . . . . . . . . . . . . . . . . . . . . . . . . . . . . . . . . $390.8 $315.5 $672.6 Unrealized holding gains/(losses) on available-for-sale securities, net of tax (provision)/benefit of $(1.9), $2.4, and ($0.2) in 2009, 2008 and 2007, respectively . . . . . . . . . . . . . . . . . . . . . . . . . . . . . . . . 3.3 (4.0) 0.3 Unrealized holding gains/(losses) on cash flow hedging instruments, net of tax (provision)/benefit of $(2.4), ($0.4) and $7.5 in 2009, 2008 and 2007, respectively . . . . . . . . . . . . . . . . . . . . . . . . . . . . . . . . 4.0 0.7 (12.8) Unrealized holding losses on net investment hedging instruments, net of tax benefit of $4.0, $0.6 and $5.2 in 2009, 2008 and 2007, respectively . . . . . . . . . . . . . (6.8) (0.9) (8.8) Reclassification adjustment for net losses realized in net earnings for cash flow hedges, net of tax benefit of $0.8, $3.0 and $0.5 in 2009, 2008 and 2007, respectively . . . . . . . . . . . . . . . . . . . . . . . . . . . . . . . . 1.3 5.0 0.9 Net unrealized gain/(loss) . . . . . . . . . . . . . . . . . . . . . . . . . 1.8 0.8 (20.4) Translation adjustment, net of tax benefit of $6.0, $0.3 and $— in 2009, 2008, and 2007, respectively. . . . . . . . . . . . 15.2 (7.0) 37.7 Total comprehensive income . . . . . . . . . . . . . . . . . . . . . . . $407.8 $309.3 $689.9 The favorable translation adjustment change during fiscal 2009 of $15.2 million was primarily due to the weakening of the US dollar against the Japanese yen, Australian dollar and the euro. The unfavorable translation adjustment change during fiscal 2008 of $7.0 million was primarily due to the strengthening of the US dollar against several currencies including the Australian dollar, Korean won and Canadian dollar. The favorable translation adjustment change during fiscal 2007 of $37.7 million was primarily due to the weakening of the US dollar against several currencies including the euro, Canadian dollar and British pound. 65
  • 74.
    Components of Accumulatedother comprehensive income, net of tax (in millions): Fiscal Year Ended Sep 27, 2009 Sep 28, 2008 Net unrealized losses on available-for-sale securities . . . . . . . . . . . . . . . . $ (0.8) $ (4.1) Net unrealized losses on hedging instruments. . . . . . . . . . . . . . . . . . . . . . (23.7) (22.2) Translation adjustment . . . . . . . . . . . . . . . . . . . . . . . . . . . . . . . . . . . . . . 89.9 74.7 Accumulated other comprehensive income . . . . . . . . . . . . . . . . . . . . . . . . $ 65.4 $ 48.4 As of September 27, 2009, the translation adjustment of $89.9 million was net of tax provisions of $1.0 million. As of September 28, 2008, the translation adjustment of $74.7 million was net of tax provisions of $7.0 million. Note 14: Employee Stock and Benefit Plans The Company maintains several equity incentive plans under which it may grant non-qualified stock options, incentive stock options, restricted stock, RSUs, or stock appreciation rights to employees, non-employee directors and consultants. The Company issues new shares of common stock upon exercise of stock options and the vesting of RSUs. The Company also has employee stock purchase plans (“ESPP”). As of September 27, 2009, there were 38.2 million shares of common stock available for issuance pursuant to future equity-based compensation awards and 9.8 million shares available for issuance under its ESPP plans. Total stock based compensation and ESPP expense recognized in the consolidated financial statements (in millions): Fiscal Year Ended Sep 27, 2009 Sep 28, 2008 Sep 30, 2007 Stock option expense . . . . . . . . . . . . . . . . . . . . . . . . . . . $61.6 $57.6 $ 92.3 RSU expense . . . . . . . . . . . . . . . . . . . . . . . . . . . . . . . . . 16.6 5.6 — ESPP expense . . . . . . . . . . . . . . . . . . . . . . . . . . . . . . . . 5.0 11.8 11.6 Total stock-based compensation expense on the consolidated statements of earnings . . . . . . . . . . . . . . . . $83.2 $75.0 $103.9 Total related tax benefit . . . . . . . . . . . . . . . . . . . . . . . . . . . $29.3 $24.0 $ 35.3 Stock-based compensation capitalized in the respective fiscal year, as included in Net property, plant and equipment and inventories on the consolidated balance sheets . . . . . . . . . . . . . . . . . . . . . . . . . . . . . . . . . . . . . . $ 1.3 $ 1.9 $ 2.5 Stock Option Plans Stock options to purchase the Company’s common stock are granted at the fair market value of the stock on the date of grant. The majority of options become exercisable in four equal installments beginning a year from the date of grant and generally expire 10 years from the date of grant, except for options granted in the exchange program, described below, which have a seven year life. Options granted to non-employee directors generally vest over one to three years. Nearly all outstanding stock options are non-qualified stock options. The fair value of each stock option granted is estimated on the grant date using the Black-Scholes-Merton (“BSM”) option valuation model. The assumptions used to calculate the fair value of options granted are evaluated and revised, as necessary, to reflect market conditions and the Company’s experience. Options granted are valued using the multiple option valuation approach, and the resulting expense is recognized over the requisite service period for each separately vesting portion of the award. Compensation expense is recognized only for those options expected to vest, with forfeitures estimated at the date of grant based on the Company’s historical experience and future expectations. On March 18, 2009, Starbucks shareholders approved a proposal to allow for a one-time stock option exchange program, designed to provide eligible employees an opportunity to exchange certain outstanding underwater stock 66
  • 75.
    options for alesser amount of new options to be granted with lower exercise prices. Stock options eligible for exchange were those with an exercise price per share greater than $19.00 that were granted prior to December 1, 2007 under the Company’s Amended and Restated 2005 Long-Term Equity Incentive Plan (the “2005 Plan”), the Amended and Restated Key Employee Stock Option Plan-1994 or the 1991 Company-Wide Stock Option Plan. On May 1, 2009 Starbucks commenced the option exchange program, which expired on May 29, 2009. A total of 14.3 million eligible stock options were tendered by employees, representing 65% of the total stock options eligible for exchange. On June 1, 2009, the Company granted an aggregate of 4.7 million new stock options in exchange for the eligible stock options surrendered. The exercise price of the new stock options was $14.92, which was the closing price of Starbucks common stock on June 1, 2009. The new stock options were granted under the 2005 Plan. No incremental stock option expense was recognized for the exchange because the fair value of the new options, using standard employee stock option valuation techniques, was approximately equal to the fair value of the surrendered options they replaced. The fair value of stock option awards and ESPP shares was estimated at the grant date with the following weighted average assumptions for the fiscal years ended September 27, 2009, September 28, 2008 and September 30, 2007 (excludes options granted in the 2009 stock option exchange program described above): Employee Stock Options Granted During the Period ESPP Fiscal Year Ended 2009 2008 2007 2009 2008 2007 Expected term (in years) . . . . 4.9 4.7 4.7 0.25 - 0.5 0.25 - 0.5 0.25 - 0.5 Expected stock price volatility . . . . . . . . . . . . . . 44.5% 29.3% 28.9% 37% - 64% 26% - 44% 28% - 31% Risk-free interest rate . . . . . . 2.2% 3.4% 4.6% 0.2% - 1.7% 1.3% - 4.5% 4.7% - 5.1% Expected dividend yield . . . . . 0.0% 0.0% 0.0% 0.0% 0.0% 0.0% Weighted average grant price . . . . . . . . . . . . . . . . . $8.97 $22.11 $36.04 $ 10.92 $ 14.52 $ 24.59 Estimated fair value per option granted . . . . . . . . . . $3.61 $ 6.85 $11.72 $ 2.67 $ 4.00 $ 6.03 The expected term of the options represents the estimated period of time until exercise and is based on historical experience of similar awards, giving consideration to the contractual terms, vesting schedules and expectations of future employee behavior. Expected stock price volatility is based on a combination of historical volatility of the Company’s stock and the one-year implied volatility of its traded options, for the related vesting periods. The risk- free interest rate is based on the implied yield available on US Treasury zero-coupon issues with an equivalent remaining term. As the Company does not pay dividends, the dividend yield is 0%. The amounts shown above for the estimated fair value per option granted are before the estimated effect of forfeitures, which reduce the amount of expense recorded on the consolidated statement of earnings. The BSM option valuation model was developed for use in estimating the fair value of traded options, which have no vesting restrictions and are fully transferable. The Company’s employee stock options have characteristics significantly different from those of traded options, and changes in the subjective input assumptions can materially affect the fair value estimate. Because Starbucks stock options do not trade on a secondary exchange, employees do not derive a benefit from holding stock options unless there is an increase, above the grant price, in the market price of the Company’s stock. Such an increase in stock price would benefit all shareholders commensurately. 67
  • 76.
    Stock option transactionsfrom October 1, 2006, through September 27, 2009 (in millions, except per share and contractual life amounts): Weighted Weighted Average Average Shares Exercise Remaining Aggregate Subject to Price Contractual Intrinsic Options per Share Life (Years) Value Outstanding, October 1, 2006 . ....................... 69.4 16.83 6.2 1,196.2 Granted . . . . . . . . . . . . . . . . ....................... 12.3 36.04 Exercised . . . . . . . . . . . . . . ....................... (12.7) 10.23 Expired/forfeited . . . . . . . . . ....................... (3.5) 30.92 Outstanding, September 30, 2007 . . . . . . . . . . . . . . . . . . . . . . 65.5 20.97 6.2 507.5 Granted . . . . . . . . . . . . . . . . . . . . . . . . . . . . . . . . . . . . . . . 15.4 22.11 Exercised . . . . . . . . . . . . . . . . . . . . . . . . . . . . . . . . . . . . . (6.6) 10.71 Expired/forfeited . . . . . . . . . . . . . . . . . . . . . . . . . . . . . . . . (11.3) 28.49 Outstanding, September 28, 2008 . . . . . . . . . . . . . . . . . . . . . . 63.0 20.96 5.7 114.9 Granted . . . . . . . . . . . . . . . . . . . . . . . . . . . . . . . . . . . . . . . 30.9 8.97 Granted under option exchange program. . . . . . . . . . . . . . . 4.7 14.92 Exercised . . . . . . . . . . . . . . . . . . . . . . . . . . . . . . . . . . . . . (7.2) 7.31 Expired/forfeited . . . . . . . . . . . . . . . . . . . . . . . . . . . . . . . . (13.5) 18.99 Cancelled under option exchange program . . . . . . . . . . . . . (14.3) 29.34 Outstanding, September 27, 2009 . . . . . . . . . . . . . . . . . . . . . . 63.6 14.75 6.7 442.4 Exercisable, September 27, 2009 . . . . . . . . . . . . . . . . . . . . . . 27.5 17.69 4.1 142.1 Vested and expected to vest, September 27, 2009 . . . . . . . . . . 57.8 15.12 6.5 388.6 The aggregate intrinsic value in the table above is the amount by which the market value of the underlying stock exceeded the exercise price of outstanding options, is before applicable income taxes and represents the amount optionees would have realized if all in-the-money options had been exercised on the last business day of the period indicated. The closing per share market value of the Company’s stock on September 25, 2009 was $19.83. As of September 27, 2009, total unrecognized stock-based compensation expense, net of estimated forfeitures, related to nonvested stock options was approximately $68 million, before income taxes, and is expected to be recognized over a weighted average period of approximately 2.7 years. The total intrinsic value of stock options exercised was $44 million, $50 million and $274 million during the three fiscal years ended September 27, 2009. The total fair value of options vested was $75 million, $99 million and $28 million during fiscal years 2009, 2008 and 2007, respectively. RSUs The Company has both time-vested and performance-based RSUs. Time-vested RSUs are awarded to eligible employees and entitle the grantee to receive shares of common stock at the end of a vesting period, subject solely to the employee’s continuing employment. The Company’s performance-based RSUs are awarded to eligible employees and entitle the grantee to receive shares of common stock if the Company achieves specified performance goals for the full fiscal year in the year of award and the grantee remains employed during the subsequent vesting period. The fair value of RSUs is based on the closing price of Starbucks common stock on the award date. Expense for performance-based RSUs is recognized when it is probable the performance goal will be achieved. 68
  • 77.
    Summary of allRSU transactions from October 1, 2006 through September 27, 2009 (in millions, except per share and contractual life amounts): Weighted Weighted Average Average Number Grant Date Remaining Aggregate of Fair Value Contractual Intrinsic Shares per Share Life (Years) Value Nonvested, October 1, 2006, . . . . . . . . . . . . . . . . . . — $ — — $ — Granted . . . . . . . . . . . . . . . . . . . . . . . . . . . . . . . . 0.2 27.83 Vested . . . . . . . . . . . . . . . . . . . . . . . . . . . . . . . . . — — Forfeited/Cancelled . . . . . . . . . . . . . . . . . . . . . . . — — Nonvested, September 30, 2007 . . . . . . . . . . . . . . . . 0.2 27.83 3.0 4.7 Granted . . . . . . . . . . . . . . . . . . . . . . . . . . . . . . . . 2.0 16.43 Vested . . . . . . . . . . . . . . . . . . . . . . . . . . . . . . . . . — — Forfeited/Cancelled . . . . . . . . . . . . . . . . . . . . . . . (0.2) 17.27 Nonvested, September 28, 2008 . . . . . . . . . . . . . . . . 2.0 17.36 2.5 30.5 Granted . . . . . . . . . . . . . . . . . . . . . . . . . . . . . . . . 3.3 8.78 Vested . . . . . . . . . . . . . . . . . . . . . . . . . . . . . . . . . — — Forfeited/Cancelled . . . . . . . . . . . . . . . . . . . . . . . (0.9) 13.94 Nonvested, September 27, 2009 . . . . . . . . . . . . . . . . 4.4 11.55 1.6 88.2 As of September 27, 2009, total unrecognized stock-based compensation expense related to nonvested RSUs, net of estimated forfeitures, was approximately $23 million, before income taxes, which is expected to be recognized over a weighted average period of approximately 2.4 years. ESPP The Company’s ESPP allows eligible employees to contribute up to 10% of their base earnings toward the quarterly purchase of the Company’s common stock, subject to an annual maximum dollar amount. The ESPP for US employees was amended in March 2009 to change the employees’ purchase price to 95% of the fair market value of the stock on the last business day of the quarterly offering period. Prior to the amendment, the employees’ purchase price was 85% of the lesser of the fair market value of the stock on the first or last business day of the quarterly offering period. Summary of transactions under this ESPP from fiscal year 2007 through 2009 (shares in millions): Average Price Per Shares Share Issued during fiscal year 2007. . . . . . . . . . . . . . . . . . . . . . . . . . . . . . . . . . . . ... 1.9 24.59 Issued during fiscal year 2008. . . . . . . . . . . . . . . . . . . . . . . . . . . . . . . . . . . . ... 2.9 14.52 Issued during fiscal year 2009. . . . . . . . . . . . . . . . . . . . . . . . . . . . . . . . . . . . ... 2.5 10.92 Total number of shares issuable under the plan . . . . . . . . . . . . . . . . . . . . . . . ... 32.0 Total number of shares issued since inception . . . . . . . . . . . . . . . . . . . . . . . . ... 23.5 Shares available for future issuance. . . . . . . . . . . . . . . . . . . . . . . . . . . . . . . . ... 8.5 Starbucks has an additional employee stock purchase plan in the UK, which allows eligible UK employees to purchase shares of common stock through payroll deductions during six-month offering periods at the lesser of the fair market value of the stock at the beginning or at the end of the offering period. The Company awards one matching share for each six shares purchased under the plan. The Company did not initiate a new offering period at the conclusion of the six-month offering period that ended April 30, 2009, and does not plan to reactivate plan 69
  • 78.
    offerings in theimmediate future. The total number of shares issuable under the plan is 1.4 million. As of September 27, 2009, 1.3 million shares were available for future issuance. Deferred Stock Plan Starbucks has a deferred stock plan for certain key employees that enables participants in the plan to defer receipt of ownership of common shares from the exercise of nonqualified stock options. The minimum deferral period is five years. As of September 27, 2009, receipt of 3.4 million shares was deferred under the terms of this plan. The rights to receive these shares, represented by common stock units, are included in the calculation of basic and diluted earnings per share as common stock equivalents. No new initial deferrals are permitted under this plan; the plan permits re-deferrals of previously deferred shares. Defined Contribution Plans Starbucks maintains voluntary defined contribution plans, both qualified and non-qualified, covering eligible employees as defined in the plan documents. Participating employees may elect to defer and contribute a portion of their eligible compensation to the plans up to limits stated in the plan documents, not to exceed the dollar amounts set by applicable laws. Effective beginning in plan year 2009, the Company changed to a fully discretionary matching contribution, from one based on a fixed schedule tied to participant contribution percentage and employment tenure. The Company’s matching contributions to all US and non-US plans were $19.7 million, $25.3 million and $20.1 million in fiscal years 2009, 2008 and 2007, respectively. Note 15: Income Taxes Provision for income taxes (in millions): Fiscal Year Ended Sep 27, 2009 Sep 28, 2008 Sep 30, 2007 Current taxes: Federal . . . . . . . . . . . . . . . . . . . . . . . . . . . . . . . ...... $165.3 $ 180.4 $326.7 State . . . . . . . . . . . . . . . . . . . . . . . . . . . . . . . . . ...... 35.0 34.3 65.3 Foreign . . . . . . . . . . . . . . . . . . . . . . . . . . . . . . . ...... 26.3 40.4 31.2 Deferred taxes, net. . . . . . . . . . . . . . . . . . . . . . . . . ...... (58.2) (111.1) (39.5) Total . . . . . . . . . . . . . . . . . . . . . . . . . . . . . . . . . . . . . . . . . $168.4 $ 144.0 $383.7 Reconciliation of the statutory federal income tax rate with the Company’s effective income tax rate: Fiscal Year Ended Sep 27, 2009 Sep 28, 2008 Sep 30, 2007 Statutory rate. . . . . . . . . . . . . . . . . . . . . . . . . . . . . . . . . . . 35.0% 35.0% 35.0% State income taxes, net of federal income tax benefit . . . . . 2.6 2.8 3.4 Foreign earnings taxed at lower rates . . . . . . . . . . . . . . . . . (2.3) (3.6) (1.1) Domestic production activity deduction . . . . . . . . . . . . . . . (2.3) (2.6) (0.5) Credit resulting from employment audit . . . . . . . . . . . . . . . (2.0) — — Other, net . . . . . . . . . . . . . . . . . . . . . . . . . . . . . . . . . . . . . (0.9) (0.3) (0.5) Effective tax rate . . . . . . . . . . . . . . . . . . . . . . . . . . . . . . . . 30.1% 31.3% 36.3% US income and foreign withholding taxes have not been provided on approximately $520 million of cumulative undistributed earnings of foreign subsidiaries and equity investees. The Company intends to reinvest these earnings for the foreseeable future. If these amounts were distributed to the US, in the form of dividends or otherwise, the Company would be subject to additional US income taxes. Determination of the amount of unrecognized deferred income tax liabilities on these earnings is not practicable because such liability, if any, is dependent on circum- stances existing if and when remittance occurs. 70
  • 79.
    Tax effect oftemporary differences and carryforwards that comprise significant portions of deferred tax assets and liabilities (in millions): Sep 27, 2009 Sep 28, 2008 Deferred tax assets: Accrued occupancy costs . . . . . . . . . . . . . . . . . . . . . . . . . . . . . . . . . . . $ 51.5 $ 54.8 Accrued compensation and related costs. . . . . . . . . . . . . . . . . . . . . . . . 70.1 56.2 Other accrued expenses . . . . . . . . . . . . . . . . . . . . . . . . . . . . . . . . . . . . 24.5 25.2 Asset retirement obligation asset . . . . . . . . . . . . . . . . . . . . . . . . . . . . . 13.9 13.3 Deferred revenue . . . . . . . . . . . . . . . . . . . . . . . . . . . . . . . . . . . . . . . . . 39.3 36.0 Asset impairments . . . . . . . . . . . . . . . . . . . . . . . . . . . . . . . . . . . . . . . . 99.7 80.8 Tax credits . . . . . . . . . . . . . . . . . . . . . . . . . . . . . . . . . . . . . . . . . . . . . 61.4 26.1 Stock based compensation . . . . . . . . . . . . . . . . . . . . . . . . . . . . . . . . . . 96.6 79.6 Other . . . . . . . . . . . . . . . . . . . . . . . . . . . . . . . . . . . . . . . . . . . . . . . . . 56.1 49.6 Total . . . . . . . . . . . . . . . . . . . . . . . . . . . . . . . . . . . . . . . . . . . . . . . . . . 513.1 421.6 Valuation allowance . . . . . . . . . . . . . . . . . . . . . . . . . . . . . . . . . . . . . . (20.3) (20.0) Total deferred tax asset, net of valuation allowance . . . . . . . . . . . . . . . . . 492.8 401.6 Deferred tax liabilities: Property, plant and equipment . . . . . . . . . . . . . . . . . . . . . . . . . . . . . . . (45.6) (18.1) Other . . . . . . . . . . . . . . . . . . . . . . . . . . . . . . . . . . . . . . . . . . . . . . . . . (25.4) (21.4) Total . . . . . . . . . . . . . . . . . . . . . . . . . . . . . . . . . . . . . . . . . . . . . . . . . . (71.0) (39.5) Net deferred tax asset . . . . . . . . . . . . . . . . . . . . . . . . . . . . . . . . . . . . . . . $421.8 $362.1 Reported as: Current deferred income tax asset . . . . . . . . . . . . . . . . . . . . . . . . . . . . $286.6 $234.2 Long-term deferred income tax asset (included in Other assets) . . . . . . 135.2 127.9 Net deferred tax asset . . . . . . . . . . . . . . . . . . . . . . . . . . . . . . . . . . . . . . . $421.8 $362.1 The Company will establish a valuation allowance if either it is more likely than not that the deferred tax asset will expire before the Company is able to realize their benefits, or the future deductibility is uncertain. Periodically, the valuation allowance is reviewed and adjusted based on management’s assessments of realizable deferred tax assets. The valuation allowance as of September 27, 2009 and September 28, 2008 was related to net operating losses of consolidated foreign subsidiaries. The net change in the total valuation allowance for the years ended September 27, 2009, and September 28, 2008, was an increase of $0.3 million and $6.3 million, respectively. As of September 27, 2009, the Company has foreign tax credit carryforwards of $38.5 million with expiration dates between fiscal years 2013 and 2019. As of the end of fiscal 2009, the Company also has capital loss carryforwards of $1.1 million with expiration dates between fiscal years 2010 and 2014. Taxes currently payable of $57.2 million and $14.8 million are included in Accrued taxes on the consolidated balance sheets as of September 27, 2009 and September 28, 2008, respectively. Uncertain Tax Positions As described in Note 1, on October 1, 2007, the first day of the Company’s fiscal 2008, Starbucks adopted new accounting requirements for uncertain tax positions. The cumulative effects of the related changes were recorded as a decrease of $1.7 million and $1.6 million, respectively, to the Company’s fiscal 2008 opening balances of retained earnings and additional paid-in capital. The Company also recorded an increase of $28.5 million to current income tax assets, an increase of $12.2 million to long-term income tax assets, a decrease of $24.6 million to current tax liabilities and an increase of $68.6 million to long-term tax liabilities. 71
  • 80.
    As of September27, 2009, the Company had $49.1 million of gross unrecognized tax benefits of which $25.4 million, if recognized, would affect the effective tax rate. The Company recognizes interest and penalties related to income tax matters in income tax expense. As of September 27, 2009 and September 28, 2008, the Company had accrued interest and penalties of $9.9 million and $9.1 million, respectively, before benefit of federal tax deduction, recorded on its consolidated balance sheets. The following table summarizes the activity related to the Company’s unrecognized tax benefits from October 1, 2007 to September 27, 2009 (in millions): Sep 27, 2009 Sep 28, 2008 Beginning balance . . . . . . . . . . . . . . . . . . . . . . . . . . . . . . . . . . . . . . . . . $ 52.6 $ 58.3 Increase related to prior year tax positions . . . . . . . . . . . . . . . . . . . . . . . . 4.2 64.9 Decrease related to prior year tax positions . . . . . . . . . . . . . . . . . . . . . . . (11.6) (37.2) Increase related to current year tax positions . . . . . . . . . . . . . . . . . . . . . . 8.4 17.0 Decrease related to current year tax positions. . . . . . . . . . . . . . . . . . . . . . (0.9) (5.4) Decreases related to settlements with taxing authorities . . . . . . . . . . . . . . (3.0) (11.1) Decreases related to lapsing of statute of limitations . . . . . . . . . . . . . . . . (0.6) (33.9) Ending balance . . . . . . . . . . . . . . . . . . . . . . . . . . . . . . . . . . . . . . . . . . . . $ 49.1 $ 52.6 Starbucks is currently under routine audit by various jurisdictions outside the US as well as US state taxing jurisdictions for fiscal years 2003 through 2008. The Company is no longer subject to US federal or state examination for years before fiscal year 2005, with the exception of three states. The Company is subject to income tax in many jurisdictions outside the US, none of which are individually material to the consolidated financial statements. There is a reasonable possibility that the unrecognized tax benefits will change within the next 12 months, but the Company does not expect this change to be material to the consolidated financial statements. Note 16: Earnings per Share Calculation of net earnings per common share (“EPS”) — basic and diluted (in millions, except EPS): Fiscal Year Ended Sep 27, 2009 Sep 28, 2008 Sep 30, 2007 Net earnings . . . . . . . . . . . . . . . . . . . . . . . . . . . . . . . . . . . $390.8 $315.5 $672.6 Weighted average common shares and common stock units outstanding (for basic calculation) . . . . . . . . . . . 738.7 731.5 749.8 Dilutive effect of outstanding common stock options and RSUs . . . . . . . . . . . . . . . . . . . . . . . . . . . . . . . . . . . . . 7.2 10.2 20.3 Weighted average common and common equivalent shares outstanding (for diluted calculation) . . . . . . . . . 745.9 741.7 770.1 EPS — basic . . . . . . . . . . . . . . . . . . . . . . . . . . . . . . . . . . . $ 0.53 $ 0.43 $ 0.90 EPS — diluted . . . . . . . . . . . . . . . . . . . . . . . . . . . . . . . . . . $ 0.52 $ 0.43 $ 0.87 Potential dilutive shares consist of the incremental common shares issuable upon the exercise of outstanding stock options (both vested and non-vested) and unvested RSUs, using the treasury stock method. Potential dilutive shares are excluded from the computation of earnings per share if their effect is antidilutive. The number of antidilutive options totaled 16.6 million, 40.4 million and 10.4 million, in fiscal years 2009, 2008 and 2007, respectively. Note 17: Commitments and Contingencies Guarantees The Company has unconditionally guaranteed the repayment of certain Japanese yen-denominated bank loans and related interest and fees of an unconsolidated equity investee, Starbucks Japan. The guarantees continue until the 72
  • 81.
    loans, including accruedinterest and fees, have been paid in full. The Company’s maximum exposure under this commitment is disclosed in the table below and is limited to the sum of unpaid principal and interest, as well as other related expenses. These amounts will vary based on fluctuations in the yen foreign exchange rate. Starbucks has commitments under which it unconditionally guarantees its proportionate share of certain borrowings of unconsolidated equity investees. The Company’s maximum exposure under these commitments disclosed in the table below excludes interest and other related costs. The fair value of these guarantees is included in Equity and cost investments and Other accrued expenses on the consolidated balance sheets. The following table presents information on unconditional guarantees as of September 27, 2009 (in millions): Estimated Fair Value Maximum Year Guarantee Recorded on Exposure Expires in Balance Sheet Japanese yen-denominated bank loans . . . . . . . . . . . . . . . . . $ 2.9 2014 $ —(1) Borrowings of other unconsolidated equity investees . . . . . . . $17.9 2009 to 2012 $3.7 (1) Since there has been no modification of these loan guarantees subsequent to the Company’s adoption of accounting requirements for guarantees, Starbucks has applied the disclosure provisions only and has not recorded the guarantees on its consolidated balance sheets. Legal Proceedings On October 8, 2004, a former hourly employee of the Company filed a lawsuit in San Diego County Superior Court entitled Jou Chau v. Starbucks Coffee Company. The lawsuit alleged that the Company violated the California Labor Code by allowing shift supervisors to receive tips. More specifically, the lawsuit alleged that since shift supervisors direct the work of baristas, they qualify as “agents” of the Company and are therefore excluded from receiving tips under California Labor Code Section 351, which prohibits employers and their agents from collecting or receiving tips left by patrons for other employees. The lawsuit further alleges that because the tipping practices violated the Labor Code, they were unfair practices under the California Unfair Competition Law. On February 28, 2008, the trial court ruled against the Company in the liability phase of the trial and on March 20, 2008 the court ordered the Company to pay approximately $87 million in restitution, plus interest. The Company appealed the decision of the trial court and on June 2, 2009 the California Court of Appeal reversed the trial court’s judgment in its entirety and ruled in favor of Starbucks. The Court of Appeal denied plaintiffs’ petition for rehearing and reaffirmed its ruling on July 2, 2009. The plaintiffs filed a petition for review with the California Supreme Court on July 13, 2009. The California Supreme Court denied plaintiffs’ petition for review. The trial court has been ordered to enter judgment for Starbucks and dismiss the case. On June 30, 2005, three individuals, Erik Lords, Hon Yeung, and Donald Brown filed a lawsuit in Orange County Superior Court, California. The lawsuit alleged that the Company violated the California Labor Code section 432.8 by asking job applicants to disclose at the time of application convictions for marijuana related offenses more than two years old. The California Court of Appeal issued a ruling on December 10, 2008 instructing the trial judge to enter summary judgment against plaintiffs and the California Supreme Court has rejected the plaintiffs’ appeal. The matter is now back before the trial court awaiting final dismissal. The Company is party to various other legal proceedings arising in the ordinary course of its business, but it is not currently a party to any legal proceeding that management believes would have a material adverse effect on the consolidated financial position or results of operations of the Company. Note 18: Segment Reporting Segment information is prepared on the same basis that the Company’s management reviews financial information for operational decision making purposes. Starbucks has three reportable operating segments: US, International and CPG. In the fourth fiscal quarter of 2009, the Company changed the composition of its reportable segments. The US foodservice business, which was previously reported in the US segment, is now reported in the CPG segment, as a 73
  • 82.
    result of internalmanagement realignments within the US and CPG businesses. Segment information for all prior periods presented has been revised to reflect this change. United States The Company’s US operations represent 80% of total Company-operated retail revenues, 33% of total specialty revenues and 73% of total net revenues for fiscal year 2009. US operations sell coffee and other beverages, complementary food, whole bean coffees, and coffee brewing equipment and merchandise primarily through Company-operated retail stores. Specialty operations within the US include licensed retail stores, and other initiatives related to the Company’s core business. International The Company’s International operations represent the remaining 20% of Company-operated retail revenues and 20% of total specialty revenues as well as 19% of total net revenues for fiscal year 2009. International operations sell coffee and other beverages, complementary food, whole bean coffees, and coffee brewing equipment and merchandise through Company-operated retail stores in the UK, Canada and several other markets. Specialty operations in International primarily include retail store licensing operations in nearly 40 countries and foodservice accounts, primarily in Canada and the UK. Many of the Company’s International operations are in early stages of development that require a more extensive support organization, relative to the current levels of revenue and operating income, than in the US. Global Consumer Products Group The Company’s CPG segment represents 47% of total specialty revenues and 8% of total net revenues for fiscal year 2009. CPG operations sell a selection of whole bean and ground coffees as well as a selection of premium Tazo» teas through licensing arrangements in US and international markets. CPG operations also produce and sell ready-to-drink beverages which include, among others, bottled Frappuccino» beverages, Starbucks DoubleShot» espresso drinks, and Discoveries» chilled cup coffee, as well as Starbucks» super-premium ice creams through its marketing and distribution agreements and joint ventures. The US foodservice business sells coffee and other related products to institutional foodservice companies with the majority of its sales through national broadline distribution networks. Unallocated Corporate includes expenses pertaining to corporate administrative functions that support the oper- ating segments but are not specifically attributable to or managed by any segment and are not included in the reported financial results of the operating segments. These unallocated corporate expenses include certain general and administrative expenses, related depreciation and amortization expenses, restructuring charges and amounts included in Net interest income and other and Interest expense on the consolidated statements of earnings. The Company’s revenue mix by product type was as follows (in millions): Fiscal Year Ended Sep 27, 2009 Sep 28, 2008 Sep 30, 2007 Beverage . . . . . . . . . . . . . . . . . . . . . . . . . . . . . . . . $6,238.4 64% $ 6,663.3 64% $6,029.1 64% Food. . . . . . . . . . . . . . . . . . . . . . . . . . . . . . . . . . . . 1,680.2 17% 1,511.7 15% 1,332.7 14% Whole bean coffees. . . . . . . . . . . . . . . . . . . . . . . . . 965.2 10% 987.8 9% 913.1 10% Other(1) . . . . . . . . . . . . . . . . . . . . . . . . . . . . . . . . . 890.8 9% 1,220.2 12% 1,136.6 12% Total . . . . . . . . . . . . . . . . . . . . . . . . . . . . . . . . . . . $9,774.6 100% $10,383.0 100% $9,411.5 100% (1) Other includes royalty and licensing revenues, beverage-related accessories and equipment. 74
  • 83.
    The tables belowrepresent information by geographic area (in millions): Fiscal Year Ended Sep 27, 2009 Sep 28, 2008 Sep 30, 2007 Net revenues from external customers: United States . . . . . . . . . . . . . . . . . . . . . . . . . . . . . . . . . . . . . . . . . . $7,787.7 $ 8,227.0 $7,678.9 Other countries . . . . . . . . . . . . . . . . . . . . . . . . . . . . . . . . . . . . . . . . 1,986.9 2,156.0 1,732.6 Total . . . . . . . . . . . . . . . . . . . . . . . . . . . . . . . . . . . . . . . . . . . . . . . . $9,774.6 $10,383.0 $9,411.5 No customer accounts for 10% or more of the Company’s revenues. Revenues are shown based on the geographic location of the customers. Revenues from countries other than the US consist primarily of revenues from Canada and the UK, which together account for approximately 66% of net revenues from other countries for fiscal 2009. Sep 27, 2009 Sep 28, 2008 Sep 30, 2007 Long-lived assets: United States . . . . . . . . . . . . . . . . . . . . . . . . . . . . . . . . . . . . . . . . . . $2,776.7 $3,099.9 $2,990.6 Other countries . . . . . . . . . . . . . . . . . . . . . . . . . . . . . . . . . . . . . . . . 764.3 824.8 667.9 Total . . . . . . . . . . . . . . . . . . . . . . . . . . . . . . . . . . . . . . . . . . . . . . . . $3,541.0 $3,924.7 $3,658.5 Management evaluates the performance of its operating segments based on net revenues and operating income. The accounting policies of the operating segments are the same as those described in the summary of significant accounting policies in Note 1. Operating income represents earnings before Net interest income and other, Interest expense and Income taxes. Management does not evaluate the performance of its operating segments using asset measures. The identifiable assets by segment disclosed in this note are those assets specifically identifiable with each segment and include net property, plant and equipment, equity and cost investments, goodwill, and other intangible assets. Corporate assets are primarily comprised of cash and investments, assets of the corporate headquarters and roasting facilities, and inventory. The methodology used to identify specific assets with the segments in fiscal 2009 was applied to the fiscal 2008 and 2007 amounts disclosed below. 75
  • 84.
    The table belowpresents information by operating segment for the fiscal years noted (in millions): Unallocated United States International CPG Corporate Total Fiscal 2009: Net Revenues: Company-operated retail . . . ................ $6,572.1 $1,608.0 $ — $ — $ 8,180.1 Specialty: Licensing . . . . . . . . . . . . ..... . . . . . . . . . . . 528.9 266.2 427.2 — 1,222.3 Foodservice and other . . . ..... . . . . . . . . . . . 3.6 46.2 322.4 — 372.2 Total specialty . . . . . . . ..... . . . . . . . . . . . 532.5 312.4 749.6 — 1,594.5 Total net revenues . . . . . . . . . ..... . . . . . . . . . . . 7,104.6 1,920.4 749.6 — 9,774.6 Depreciation and amortization . ..... . . . . . . . . . . . 378.1 102.5 5.7 48.4 534.7 Income from equity investees . ..... . . . . . . . . . . . 0.5 53.6 67.8 — 121.9 Operating income/(loss) . . . . . ..... . . . . . . . . . . . 531.8 92.9 296.3 (359.0) 562.0 Equity method investments . . . ..... . . . . . . . . . . . — 248.8 64.4 — 313.2 Total assets . . . . . . . . . . . . . . ..... . . . . . . . . . . . 1,650.0 1,071.3 102.1 2,753.4 5,576.8 Net impairment and disposition losses . . . . . . . . . . . 120.8 45.9 — 57.7 224.4 Fiscal 2008: Net Revenues: Company-operated retail . . . . . . . . ........... $6,997.7 $1,774.2 $ — $ — $ 8,771.9 Specialty: Licensing . . . . . . . . . . . . . . . . . . . . . . . . . . . . 504.2 274.8 392.6 — 1,171.6 Foodservice and other . . . . . . . . . . . . . . . . . . . 30.1 54.4 355.0 — 439.5 Total specialty . . . . . . . . . . . . . . . . . . . . . . . 534.3 329.2 747.6 — 1,611.1 Total net revenues . . . . . . . . . . . . . . . . . . . . . . . . . 7,532.0 2,103.4 747.6 — 10,383.0 Depreciation and amortization . . . . . . . . . . . . . . . . . 395.4 108.8 6.3 38.8 549.3 Income (loss) from equity investees . . . . . . . . . . . . . (1.3) 54.2 60.7 — 113.6 Operating income/(loss) . . . . . . . . . . . . . . . . . . . . . 454.2 110.0 279.2 (339.5) 503.9 Equity method investments . . . . . . . . . . . . . . . . . . . (0.5) 223.6 44.8 — 267.9 Total assets . . . . . . . . . . . . . . . . . . . . . . . . . . . . . . 1,966.3 1,066.0 85.6 2,554.7 5,672.6 Net impairment and disposition losses . . . . . . . . . . . 275.1 19.0 — 30.9 325.0 Fiscal 2007: Net Revenues: Company-operated retail . . . ................ $6,560.9 $1,437.4 $ — $ — $ 7,998.3 Specialty: Licensing . . . . . . . . . . . . ..... . . . . . . . . . . . 439.1 220.9 366.3 — 1,026.3 Foodservice and other . . . ..... . . . . . . . . . . . 22.9 37.9 326.1 — 386.9 Total specialty . . . . . . . ..... . . . . . . . . . . . 462.0 258.8 692.4 — 1,413.2 Total net revenues . . . . . . . . . ..... . . . . . . . . . . . 7,022.9 1,696.2 692.4 — 9,411.5 Depreciation and amortization . ..... . . . . . . . . . . . 341.7 84.2 6.6 34.7 467.2 Income from equity investees . ..... . . . . . . . . . . . 0.8 45.7 61.5 — 108.0 Operating income/(loss) . . . . . ..... . . . . . . . . . . . 1,005.2 137.7 248.9 (337.9) 1,053.9 Equity method investments . . . ..... . . . . . . . . . . . 0.8 196.9 36.8 — 234.5 Total assets . . . . . . . . . . . . . . ..... . . . . . . . . . . . 2,078.7 948.7 90.0 2,226.5 5,343.9 Net impairment and disposition losses . . . . . . . . . . . 9.3 15.1 — 1.6 26.0 The table below reconciles the total of the reportable segments’ operating income to the Company’s consolidated earnings before income taxes (in millions): Fiscal Year Ended Sep 27, 2009 Sep 28, 2008 Sep 30, 2007 Operating income . . . . . . . . . . . . . . . . . . . . . . . . . . . . . . . . . . . . . . . $562.0 $503.9 $1,053.9 Interest income and other, net . . . . . . . . . . . . . . . . . . . . . . . . . . . . . . 36.3 9.0 40.4 Interest expense . . . . . . . . . . . . . . . . . . . . . . . . . . . . . . . . . . . . . . . . (39.1) (53.4) (38.0) Earnings before income taxes . . . . . . . . . . . . . . . . . . . . . . . . . . . . . . $559.2 $459.5 $1,056.3 76
  • 85.
    Note 19: Subsequent Event On September 30, 2009, Starbucks acquired 100 percent ownership of the Company’s business in France, converting it from a 50% joint venture with Sigla S.A. (Grupo Vips) of Spain to a Company-operated market. Starbucks simultaneously sold its 50% ownership interests in the Spain and Portugal markets to Grupo Vips, converting them to licensed markets. Note 20: Summarized Quarterly Financial Information (unaudited, in millions, except EPS) First Second Third Fourth Total 2009: Net revenues . . . . . . . . . . . . . . . . . . . . . . . . . . $2,615.2 $2,333.3 $2,403.9 $2,422.2 $ 9,774.6 Operating income(1) . . . . . . . . . . . . . . . . . . . . . 117.7 40.9 204.0 199.4 562.0 Net earnings(1) . . . . . . . . . . . . . . . . . . . . . . . . . 64.3 25.0 151.5 150.0 390.8 EPS — diluted . . . . . . . . . . . . . . . . . . . . . . . . . 0.09 0.03 0.20 0.20 0.52 2008: Net revenues . . . . . . . . . . . . . . . . . . . . . . . . . . $2,767.6 $2,526.0 $2,574.0 $2,515.4 $10,383.0 Operating income/(loss)(2) . . . . . . . . . . . . . . . . 333.1 178.2 (21.6) 14.2 503.9 (2) Net earnings/(loss) . . . . . . . . . . . . . . . . . . . . 208.1 108.7 (6.7) 5.4 315.5 EPS — diluted . . . . . . . . . . . . . . . . . . . . . . . . . 0.28 0.15 (0.01) 0.01 0.43 (1) Includes pretax restructuring charges of $75.5 million, $152.1 million, $51.6 million and $53.2 million for the first, second, third and fourth fiscal quarters respectively. (2) Includes pretax restructuring charges of $167.7 million and $99.2 million for the third and fourth fiscal quarters, respectively. 77
  • 86.
    REPORT OF INDEPENDENTREGISTERED PUBLIC ACCOUNTING FIRM To the Board of Directors and Shareholders of Starbucks Corporation Seattle, Washington We have audited the accompanying consolidated balance sheets of Starbucks Corporation and subsidiaries (the “Company”) as of September 27, 2009 and September 28, 2008, and the related consolidated statements of earnings, shareholders’ equity, and cash flows for each of the three years in the period ended September 27, 2009. These financial statements are the responsibility of the Company’s management. Our responsibility is to express an opinion on these financial statements based on our audits. We conducted our audits in accordance with the standards of the Public Company Accounting Oversight Board (United States). Those standards require that we plan and perform the audit to obtain reasonable assurance about whether the financial statements are free of material misstatement. An audit includes examining, on a test basis, evidence supporting the amounts and disclosures in the financial statements. An audit also includes assessing the accounting principles used and significant estimates made by management, as well as evaluating the overall financial statement presentation. We believe that our audits provide a reasonable basis for our opinion. In our opinion, such consolidated financial statements present fairly, in all material respects, the financial position of Starbucks Corporation and subsidiaries as of September 27, 2009 and September 28, 2008, and the results of their operations and their cash flows for each of the three years in the period ended September 27, 2009, in conformity with accounting principles generally accepted in the United States of America. We have also audited, in accordance with the standards of the Public Company Accounting Oversight Board (United States), the Company’s internal control over financial reporting as of September 27, 2009, based on criteria established in Internal Control — Integrated Framework issued by the Committee of Sponsoring Organizations of the Treadway Commission and our report dated November 20, 2009 expressed an unqualified opinion on the Company’s internal control over financial reporting. /s/ DELOITTE & TOUCHE LLP Seattle, Washington November 20, 2009 78
  • 87.
    Item 9. Changes in and Disagreements with Accountants on Accounting and Financial Disclosure Not applicable. Item 9A. Controls and Procedures Disclosure Controls and Procedures The Company maintains disclosure controls and procedures that are designed to ensure that material information required to be disclosed in the Company’s periodic reports filed or submitted under the Securities Exchange Act of 1934, as amended (the “Exchange Act”), is recorded, processed, summarized and reported within the time periods specified in the SEC’s rules and forms. Starbucks disclosure controls and procedures are also designed to ensure that information required to be disclosed in the reports the Company files or submits under the Exchange Act is accumulated and communicated to the Company’s management, including its principal executive officer and principal financial officer as appropriate, to allow timely decisions regarding required disclosure. During the fourth quarter of fiscal 2009 the Company carried out an evaluation, under the supervision and with the participation of the Company’s management, including the chief executive officer and the chief financial officer, of the effectiveness of the design and operation of the disclosure controls and procedures, as defined in Rules 13a-15(e) and 15d-15(e) under the Exchange Act. Based upon that evaluation, the Company’s chief executive officer and chief financial officer concluded that the Company’s disclosure controls and procedures were effective, as of the end of the period covered by this report (September 27, 2009). During the fourth quarter of fiscal 2009, there were no changes in the Company’s internal control over financial reporting (as defined in Rules 13a-15(f) and 15d-15(f) of the Exchange Act) that materially affected or are reasonably likely to materially affect internal control over financial reporting. The certifications required by Section 302 of the Sarbanes-Oxley Act of 2002 are filed as exhibits 31.1 and 31.2, respectively, to this 10-K. Report of Management on Internal Control over Financial Reporting The management of Starbucks is responsible for establishing and maintaining adequate internal control over financial reporting. Internal control over financial reporting is a process to provide reasonable assurance regarding the reliability of the Company’s financial reporting for external purposes in accordance with accounting principles generally accepted in the United States of America. Internal control over financial reporting includes maintaining records that in reasonable detail accurately and fairly reflect the Company’s transactions; providing reasonable assurance that transactions are recorded as necessary for preparation of the Company’s financial statements; providing reasonable assurance that receipts and expenditures are made in accordance with management autho- rization; and providing reasonable assurance that unauthorized acquisition, use or disposition of company assets that could have a material effect on the Company’s financial statements would be prevented or detected on a timely basis. Because of its inherent limitations, internal control over financial reporting is not intended to provide absolute assurance that a misstatement of the Company’s financial statements would be prevented or detected. Management conducted an evaluation of the effectiveness of the Company’s internal control over financial reporting based on the framework and criteria established in Internal Control — Integrated Framework, issued by the Committee of Sponsoring Organizations of the Treadway Commission. This evaluation included review of the documentation of controls, evaluation of the design effectiveness of controls, testing of the operating effectiveness of controls and a conclusion on this evaluation. Based on this evaluation, management concluded that the Company’s internal control over financial reporting was effective as of September 27, 2009. The Company’s internal control over financial reporting as of September 27, 2009, has been audited by Deloitte & Touche LLP, an independent registered public accounting firm, as stated in their report which is included herein. 79
  • 88.
    Report of IndependentRegistered Public Accounting Firm To the Board of Directors and Shareholders of Starbucks Corporation Seattle, Washington We have audited the internal control over financial reporting of Starbucks Corporation and subsidiaries (the “Company”) as of September 27, 2009, based on criteria established in Internal Control — Integrated Framework issued by the Committee of Sponsoring Organizations of the Treadway Commission. The Company’s management is responsible for maintaining effective internal control over financial reporting and for its assessment of the effectiveness of internal control over financial reporting, included in the accompanying Report of Management on Internal Control over Financial Reporting. Our responsibility is to express an opinion on the Company’s internal control over financial reporting based on our audit. We conducted our audit in accordance with the standards of the Public Company Accounting Oversight Board (United States). Those standards require that we plan and perform the audit to obtain reasonable assurance about whether effective internal control over financial reporting was maintained in all material respects. Our audit included obtaining an understanding of internal control over financial reporting, assessing the risk that a material weakness exists, testing and evaluating the design and operating effectiveness of internal control based on the assessed risk, and performing such other procedures as we considered necessary in the circumstances. We believe that our audit provides a reasonable basis for our opinion. A company’s internal control over financial reporting is a process designed by, or under the supervision of, the company’s principal executive and principal financial officers, or persons performing similar functions, and effected by the company’s board of directors, management, and other personnel to provide reasonable assurance regarding the reliability of financial reporting and the preparation of financial statements for external purposes in accordance with generally accepted accounting principles. A company’s internal control over financial reporting includes those policies and procedures that (1) pertain to the maintenance of records that, in reasonable detail, accurately and fairly reflect the transactions and dispositions of the assets of the company; (2) provide reasonable assurance that transactions are recorded as necessary to permit preparation of financial statements in accordance with generally accepted accounting principles, and that receipts and expenditures of the company are being made only in accordance with authorizations of management and directors of the company; and (3) provide reasonable assurance regarding prevention or timely detection of unauthorized acquisition, use, or disposition of the company’s assets that could have a material effect on the financial statements. Because of the inherent limitations of internal control over financial reporting, including the possibility of collusion or improper management override of controls, material misstatements due to error or fraud may not be prevented or detected on a timely basis. Also, projections of any evaluation of the effectiveness of the internal control over financial reporting to future periods are subject to the risk that the controls may become inadequate because of changes in conditions, or that the degree of compliance with the policies or procedures may deteriorate. In our opinion, the Company maintained, in all material respects, effective internal control over financial reporting as of September 27, 2009, based on the criteria established in Internal Control — Integrated Framework issued by the Committee of Sponsoring Organizations of the Treadway Commission. We have also audited, in accordance with the standards of the Public Company Accounting Oversight Board (United States), the consolidated financial statements as of and for the fiscal year ended September 27, 2009, of the Company and our report dated November 20, 2009 expressed an unqualified opinion on those financial statements. /s/ DELOITTE & TOUCHE LLP Seattle, Washington November 20, 2009 80
  • 89.
    Item 9B. OtherInformation None. PART III As used in this Part III, “Starbucks” and the “Company” mean Starbucks Corporation. Item 10. Directors, Executive Officers and Corporate Governance The information required by this item regarding the Company’s directors is incorporated herein by reference to the sections entitled “Proposal 1 — Election Of Directors” and “Executive Compensation — Section 16(a) Beneficial Ownership Reporting Compliance” and “Corporate Governance — Board Committees and Related Matters” in the Company’s definitive Proxy Statement for the Annual Meeting of Shareholders to be held on March 24, 2010 (the “Proxy Statement”). Information regarding the Company’s executive officers is set forth in Item 4 of Part 1 of this Report under the caption “Executive Officers of the Registrant.” The Company adopted a code of ethics applicable to its chief executive officer, chief financial officer, controller and other finance leaders, which is a “code of ethics” as defined by applicable rules of the SEC. This code is publicly available on the Company’s website at www.starbucks.com/aboutus/corporate_governance.asp. If the Company makes any amendments to this code other than technical, administrative or other non-substantive amendments, or grants any waivers, including implicit waivers, from a provision of this code to the Company’s chief executive officer, chief financial officer or controller, the Company will disclose the nature of the amendment or waiver, its effective date and to whom it applies on its website or in a report on Form 8-K filed with the SEC. Item 11. Executive Compensation The information required by this item is incorporated by reference to the sections entitled “Executive Compen- sation” and “Corporate Governance — Compensation Committee” in the Proxy Statement. Item 12. Security Ownership of Certain Beneficial Owners and Management and Related Shareholder Matters The information required by this item is incorporated by reference to the sections entitled “Beneficial Ownership of Common Stock” and “Executive Compensation — Equity Compensation Plan Information” in the Proxy Statement. Item 13. Certain Relationships and Related Transactions, and Director Independence The information required by this item is incorporated by reference to the section entitled “Executive Compensa- tion — Certain Relationships and Related Transactions” and “Corporate Governance — Affirmative Determina- tions Regarding Director Independence and Other Matters” in the Proxy Statement. Item 14. Principal Accountant Fees and Services The information required by this item is incorporated by reference to the sections entitled “Independent Registered Public Accounting Firm Fees” and “Policy on Audit Committee Pre-Approval of Audit and Permissible Non-Audit Services of the Independent Registered Public Accounting Firm” in the Proxy Statement. 81
  • 90.
    PART IV Item 15. Exhibits and Financial Statement Schedules (a) The following documents are filed as a part of this 10-K: 1. Financial Statements The following financial statements are included in Part II, Item 8 of this 10-K: • Consolidated Statements of Earnings for the fiscal years ended September 27, 2009, September 28, 2008 and September 30, 2007; • Consolidated Balance Sheets as of September 27, 2009 and September 28, 2008; • Consolidated Statements of Cash Flows for the fiscal years ended September 27, 2009 September 28, 2008 and September 30, 2007; • Consolidated Statements of Shareholders’ Equity for the fiscal years ended September 27, 2009, September 28, 2008 and September 30, 2007; • Notes to Consolidated Financial Statements; and • Reports of Independent Registered Public Accounting Firm 2. Financial Statement Schedules Financial statement schedules are omitted because they are not required or are not applicable, or the required information is provided in the consolidated financial statements or notes described in Item 15(a)(1) above. 3. Exhibits The Exhibits listed in the Index to Exhibits, which appears immediately following the signature page and is incorporated herein by reference, are filed as part of this 10-K. 82
  • 91.
    SIGNATURES Pursuant to therequirements of Section 13 or 15(d) of the Securities Exchange Act of 1934, as amended, the registrant has duly caused this report to be signed on its behalf by the undersigned, thereunto duly authorized. STARBUCKS CORPORATION By: /s/ Howard Schultz Howard Schultz chairman, president and chief executive officer November 20, 2009 POWER OF ATTORNEY Know all persons by these presents, that each person whose signature appears below constitutes and appoints Howard Schultz and Troy Alstead, and each of them, as such person’s true and lawful attorneys-in-fact and agents, with full power of substitution and resubstitution, for such person and in such person’s name, place and stead, in any and all capacities, to sign any and all amendments to this Report, and to file the same, with all exhibits thereto, and other documents in connection therewith, with the Securities and Exchange Commission, granting unto said attorneys-in-fact and agents, and each of them, full power and authority to do and perform each and every act and thing requisite and necessary to be done in connection therewith, as fully to all intents and purposes as such person might or could do in person, hereby ratifying and confirming that all said attorneys-in-fact and agents, or any of them or their or such person’s substitute or substitutes, may lawfully do or cause to be done by virtue thereof. Pursuant to the requirements of the Securities Exchange Act of 1934, as amended, this report has been signed below by the following persons on behalf of the Registrant and in the capacities indicated as of November 20, 2009. Signature Title By: /s/ Howard Schultz chairman, president and chief executive officer Howard Schultz By: /s/ Troy Alstead executive vice president, chief financial officer and chief Troy Alstead administrative officer (principal financial officer and principal accounting officer) By: /s/ Barbara Bass director Barbara Bass By: /s/ William W. Bradley director William W. Bradley By: /s/ Mellody Hobson director Mellody Hobson By: /s/ Kevin Johnson director Kevin Johnson 83
  • 92.
    Signature Title By: /s/ Olden Lee director Olden Lee By: /s/ Sheryl Sandberg director Sheryl Sandberg By: /s/ James G. Shennan Jr. director James G. Shennan Jr. By: /s/ Javier G. Teruel director Javier G. Teruel By: /s/ Myron E. Ullman III director Myron E. Ullman III By: /s/ Craig E. Weatherup director Craig E. Weatherup 84
  • 93.
    INDEX TO EXHIBITS Incorporated by Reference Exhibit Date of Exhibit Filed Number Exhibit Description Form File No. First Filing Number Herewith 3.1 Restated Articles of Incorporation of 10-Q 0-20322 05/12/06 3.1 Starbucks Corporation 3.2 Amended and Restated Bylaws of Starbucks 8-K 0-20322 1/12/09 3.2 Corporation 4.1 Form of Indenture S-3 ASR 333-145572 8/20/07 4.1 4.2 Form of Note for 6.25% Senior Notes due 8-K 0-20322 8/23/07 4.2 2017 4.3 Form of Supplemental Indenture for 8-K 0-20322 8/23/07 4.3 6.25% Senior Notes due 2017 10.1* Starbucks Corporation Amended and 8-K 0-20322 3/20/09 10.2 Restated Key Employee Stock Option Plan — 1994, as amended and restated through March 18, 2009 10.2* Starbucks Corporation Amended and 10-K 0-20322 12/23/03 10.2 Restated 1989 Stock Option Plan for Non- Employee Directors 10.3 Starbucks Corporation 1991 Company-Wide 8-K 0-20322 3/20/09 10.3 Stock Option Plan, as amended and restated through March 18, 2009 10.3.1 Starbucks Corporation 1991 Company-Wide 10-K 0-20322 12/23/03 10.3.1 Stock Option Plan — Rules of the UK Sub-Plan, as amended and restated through November 20, 2003 10.4* Starbucks Corporation Employee Stock 10-Q 0-20322 2/04/09 10.6 Purchase Plan — 1995 as amended and restated through April 1, 2009 10.5 Amended and Restated Lease, dated as of 10-K 0-20322 12/20/01 10.5 January 1, 2001, between First and Utah Street Associates, L.P. and Starbucks Corporation 10.6* Starbucks Corporation Executive 8-K 0-20322 9/25/06 10.1 Management Bonus Plan, as amended and restated effective September 19, 2006 10.7* Starbucks Corporation Management S-8 333-65181 10/01/98 4.1 Deferred Compensation Plan 10.8* Starbucks Corporation 1997 Deferred Stock 10-K 0-20322 12/23/99 10.17 Plan 10.9 Starbucks Corporation UK Share Save Plan 10-K 0-20322 12/23/03 10.9 10.10* Starbucks Corporation Directors Deferred 10-K 0-20322 12/23/03 10.10 Compensation Plan, as amended and restated effective September 29, 2003 10.11* Consulting Agreement dated April 6, 2009 10-Q 0-20322 08/05/09 10.1 between Starbucks Corporation and Olden Lee 10.12 Starbucks Corporation UK Share Incentive 10-K 0-20322 12/14/06 10.12 Plan, as amended and restated effective November 14, 2006 85
  • 94.
    Incorporated by Reference Exhibit Date of Exhibit Filed Number Exhibit Description Form File No. First Filing Number Herewith 10.13* Starbucks Corporation 2005 Long-Term 8-K 0-20322 03/20/09 10.1 Equity Incentive Plan, as amended and restated effective March 18, 2009 10.14* 2005 Key Employee Sub-Plan to the 10-Q 0-20322 02/10/06 10.2 Starbucks Corporation 2005 Long-Term Equity Incentive Plan, as amended and restated effective November 15, 2005 10.15* 2005 Non-Employee Director Sub-Plan to 8-K 0-20322 02/10/05 10.3 the Starbucks Corporation 2005 Long-Term Equity Incentive Plan 10.16* Stock Option Grant Agreement for Purchase 8-K 0-20322 02/10/05 10.4 of Stock under the 2005 Key Employee Sub-Plan to the Starbucks Corporation 2005 Long-Term Equity Incentive Plan 10.17* Stock Option Grant Agreement for Purchase 8-K 0-20322 02/10/05 10.5 of Stock under the 2005 Non-Employee Director Sub-Plan to the Starbucks Corporation 2005 Long-Term Equity Incentive Plan 10.18* Letter Agreement dated as of February 11, 10-Q 0-20322 02/16/05 10.1 2005 by and among the Company, the Schultz Irrevocable Trust and the Howard D. Schultz Irrevocable Trust 10.19* Letter Agreement dated February 5, 2009 10-Q 0-20322 05/06/09 10.4 between Starbucks Corporation and John Culver 10.20 2005 Company-Wide Sub-Plan to the 10-Q 0-20322 08/10/05 10.1 Starbucks Corporation 2005 Long-Term Equity Incentive Plan 10.21 Stock Option Grant Agreement for Purchase 10-Q 0-20322 08/10/05 10.2 of Stock under the 2005 Company-Wide Sub-Plan to the Starbucks Corporation 2005 Long-Term Equity Incentive Plan 10.22 Credit Agreement dated August 12, 2005 8-K 0-20322 08/15/05 10.1 among Starbucks Corporation, Bank of America, N.A., as Administrative Agent, Swing Line Lender and L/C Issuer, Wachovia Bank N.A. and Citibank, N.A., as Co-Documentation Agents, Banc of America Securities LLC and Wells Fargo Bank, N.A., as Joint Lead Arrangers and Joint Book Managers, Wells Fargo Bank, N.A., as Syndication Agent, and the other Lenders party thereto. 10.23 Commercial Paper Dealer Agreement 8-K 0-20322 3/27/07 10.1.1 between Starbucks Corporation and Banc of America Securities LLC, dated as of March 27, 2007 86
  • 95.
    Incorporated by Reference Exhibit Date of Exhibit Filed Number Exhibit Description Form File No. First Filing Number Herewith 10.24 Commercial Paper Dealer Agreement 8-K 0-20322 3/27/07 10.1.2 between Starbucks Corporation and Goldman, Sachs & Co., dated as of March 27, 2007 10.25* Letter Agreement dated April 2, 2007 8-K 0-20322 4/3/07 10.1 between Starbucks Corporation and Peter J. Bocian 10.26* Letter Agreement dated July 16, 2007 8-K 0-20322 7/17/07 10.1 between Starbucks Corporation and Martin Coles 10.27* Letter Agreement dated February 19, 2008 10-Q 0-20322 05/08/08 10.1 between Starbucks Corporation and Arthur Rubinfeld 10.28* Letter Agreement dated January 10, 2008 10-Q 0-20322 05/08/08 10.2 between Starbucks Corporation and Chet Kuchinad 10.29* Letter Agreement dated February 21, 2008 10-Q 0-20322 05/08/08 10.3 between Starbucks Corporation and Clifford Burrows 10.30 Amendment No. 4 to Credit Agreement 8-K 0-20322 10/31/08 10.1 dated October 31, 2008, among Starbucks Corporation, Bank of America, N.A., as Administrative Agent and the Lenders party thereto 10.31 Amendment No. 5 to Credit Agreement 10-Q 0-20322 08/05/09 10.2 dated June 8, 2009, among Starbucks Corporation, Bank of America, N.A., as Administrative Agent and the Lenders party thereto 10.32* Letter Agreement dated November 6, 2008 8-K 0-20322 11/12/08 10.1 between Starbucks Corporation and Troy Alstead 10.33* Time Vested Restricted Stock Unit 8-K 0-20322 11/7/08 10.1 Agreement (US) under Starbucks Corporation 2005 Long-Term Equity Incentive Plan 10.34* Time Vested Restricted Stock Unit 8-K 0-20322 11/7/08 10.2 Agreement (International) under Starbucks Corporation 2005 Long-Term Equity Incentive Plan 10.35* Performance Based Restricted Stock Unit 8-K 0-20322 11/7/08 10.3 Agreement under Starbucks Corporation 2005 Long-Term Equity Incentive Plan 12 Computation of Ratio of Earnings to Fixed — — — — X Charges 21 Subsidiaries of Starbucks Corporation — — — — X 23 Consent of Independent Registered Public — — — — X Accounting Firm 87
  • 96.
    Incorporated by Reference Exhibit Date of Exhibit Filed Number Exhibit Description Form File No. First Filing Number Herewith 31.1 Certification of Principal Executive Officer — — — — X Pursuant to Rule 13a-14 of the Securities Exchange Act of 1934, As Adopted Pursuant to Section 302 of the Sarbanes- Oxley Act of 2002 31.2 Certification of Principal Financial Officer — — — — X Pursuant to Rule 13a-14 of the Securities Exchange Act of 1934, As Adopted Pursuant to Section 302 of the Sarbanes-Oxley Act of 2002 32 Certifications of Principal Executive Officer — — — — X and Principal Financial Officer Pursuant to 18 USC. Section 1350, As Adopted Pursuant to Section 906 of the Sarbanes-Oxley Act of 2002 * Denotes a management contract or compensatory plan or arrangement. 88
  • 97.
    Market Information Board of Directors and Senior Officers Starbucks common stock is traded on the NASDAQ Global Select Board of Directors Market (“NASDAQ”), under the symbol SBUX. The following table Howard Schultz Starbucks Corporation, chairman, president and chief executive officer shows the quarterly high and low closing sale prices per share of the Barbara Bass Gerson Bakar Foundation, president Company’s common stock as reported by NASDAQ for each quarter during the last two fiscal years. William W. Bradley Allen & Company LLC, managing director Mellody Hobson Ariel Investments, LLC, president September 27, 2009: High Low Kevin Johnson Juniper Networks, Inc., chief executive officer Fourth Quarter $20.76 $12.97 Olden Lee PepsiCo, Inc., retired executive Third Quarter 15.30 11.11 Sheryl Sandberg Facebook, Inc., chief operating officer Second Quarter 12.39 8.27 James G. Shennan, Jr. Trinity Ventures, general partner emeritus First Quarter 14.87 7.17 Javier G. Teruel Colgate-Palmolive Company, retired vice chairman September 28, 2008: Myron E. Ullman, III J.C. Penney Company, Inc., chairman and chief executive officer Fourth Quarter $16.92 $13.58 Craig E. Weatherup Pepsi-Cola Company, retired chief executive officer Third Quarter 18.60 15.66 Second Quarter 20.47 16.80 Senior Officers First Quarter 26.84 20.03 Howard Schultz chairman, president and chief executive officer Clifford Burrows president, Starbucks Coffee U.S. The Company’s U.S. Securities and Exchange Commission filings may be obtained without charge by accessing the Investor Relations section John Culver president, Starbucks Coffee International of the Company’s website at http://investor.starbucks.com, at Michelle Gass president, Seattle’s Best Coffee http://sec.gov, or by making a request to Investor Relations via the Arthur Rubinfeld president, Global Development address, phone number or website listed below. Annie Young-Scrivner chief marketing officer Investor Relations Troy Alstead executive vice president, chief financial officer and chief administrative officer Starbucks Corporation Paula E. Boggs executive vice president, general counsel and secretary PO Box 34067 Peter D. Gibbons executive vice president, Global Supply Chain Operations M/S S-SR1 Seattle, WA 98124-1067 Kalen Holmes executive vice president, Partner Resources (206) 447-1575, ext. 87118 Olden Lee interim executive vice president, Partner Resources http://investor.starbucks.com Chris Carr senior vice president and general manager, Starbucks Licensed Stores Mercy Corrales senior vice president; president, Asia Pacific Independent Auditors Deloitte & Touche LLP Terry Davenport senior vice president, Marketing Stephen Gillett senior vice president, chief information officer and general manager, Digital Ventures Transfer Agent Willard (Dub) Hay senior vice president, Coffee BNY Mellon Shareowner Services Lucy Lee Helm senior vice president, deputy general counsel Starbucks Coffee Company Buck Hendrix senior vice president; president, EMEA c/o BNY Mellon Shareowner Services Charles Jemley senior vice president, Finance-International PO Box 38015 Louis Jordan senior vice president, Finance-U.S. Pittsburgh, PA 15252 Dorothy J. Kim senior vice president (888) 835-2866 www.bnymellon.com/shareowner James Koster senior vice president, Partner Resources, U.S. and Global Supply Chain Operations David Landau senior vice president, deputy general counsel and chief compliance officer Annual Meeting of Shareholders Cosimo LaPorta senior vice president, Operations, Starbucks Coffee International March 24, 2010 10:00 a.m. PST Barbara Le Marrec senior vice president; chief retail officer, Starbucks Coffee Japan Marion Oliver McCaw Hall Dan Loeb senior vice president; president, Greater China Seattle, WA James McDermet senior vice president, Northeast Division Live webcast at: http://investor.starbucks.com Michael Malanga senior vice president, U.S. Store Development, Global Strategy and Support Services Colin Moore senior vice president; president, Starbucks Coffee Americas GLOBAL RESPONSIBILITY Tim Pfeiffer senior vice president, Store Design Starbucks is committed to being a deeply responsible company in the Craig Russell senior vice president, Store Services communities where it does business around the world. The Company’s Michael Stafford senior vice president, Talent Management focus is on ethically sourcing high-quality coffee, reducing its environmental impacts and contributing positively to communities. Carl Sweat senior vice president, Global Beverage Starbucks Global Responsibility strategy and commitments are integral Clarice Turner senior vice president, North Division to the Company’s overall business strategy. As a result, Starbucks Vivek Varma senior vice president, Public Affairs believes it delivers benefits to the Company and its stakeholders, including employees, business partners, customers, suppliers, Jinlong Wang senior vice president, SCI Business Development and chairman, Greater China shareholders, community members and others. For an overview of Mark Wesley senior vice president, Global Development-International Starbucks Global Responsibility strategy and commitments, please Rossann Williams senior vice president, South Division see Starbucks fiscal 2009 Global Responsibility Report, available online at starbucks.com/sharedplanet on Earth Day, April 22, 2010.
  • 98.
    Fiscal 2009 willstand out as a year filled with many challenges and opportunities for Starbucks. With the commitment and hard work of our resourceful partners, and the support of millions of loyal customers around the world, Starbucks not only weathered the storm but emerged as a much more innovative, efficient and sustainable organization. For this, Starbucks sincerely thanks all of those who played a part. In fiscal 2010, our commitment is to remain focused on driving rigorous discipline throughout our business, and introducing relevant innovation—while continuously enhancing the Starbucks Experience—which will continue to differentiate Starbucks for years to come. To minimize our environmental impact, the Starbucks Corporation Fiscal 2009 Annual Report, not the 10-K, was printed on paper manufactured from 100% post-consumer recycled fibers, certified Processed Chlorine Free (PCF), using 100% Green-e certified renewable energy. We’ll keep looking for ways to further reduce our environmental footprint. © 2009 Starbucks Corporation. All rights reserved. SJBQ410OTH-00551