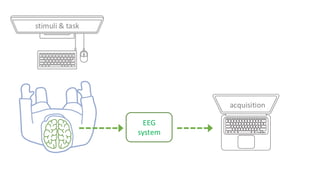
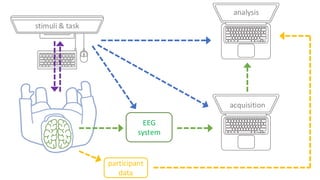
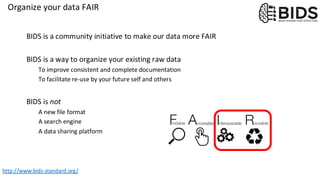
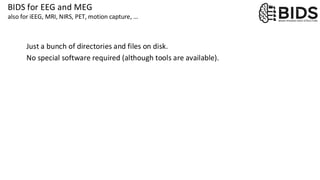
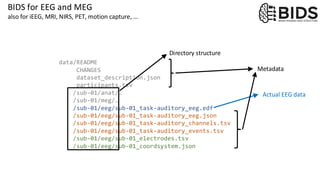
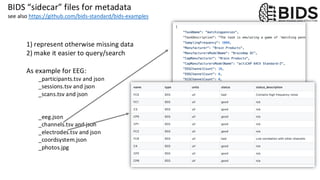
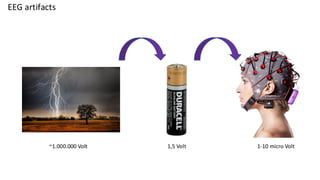
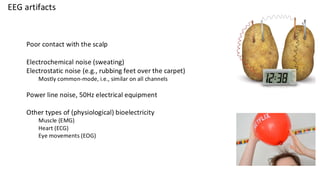
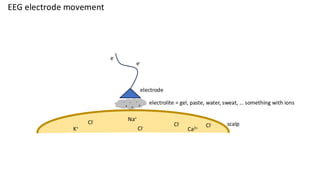
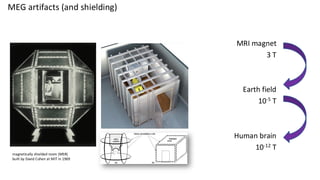
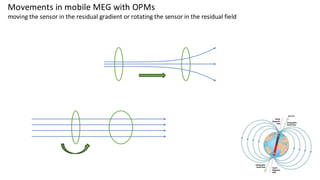
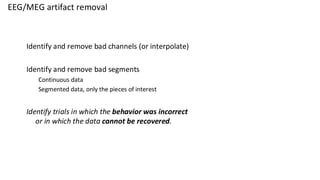
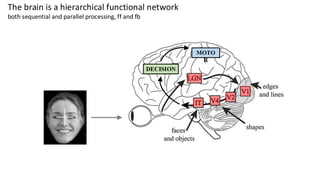
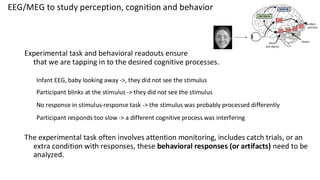
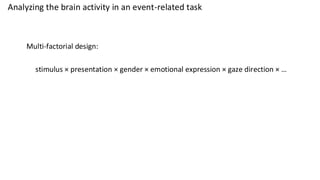
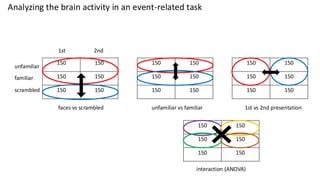
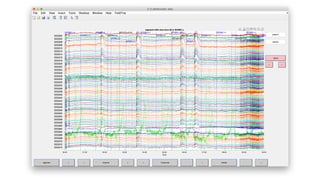
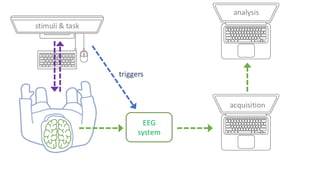
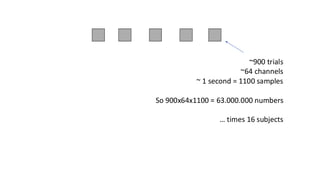
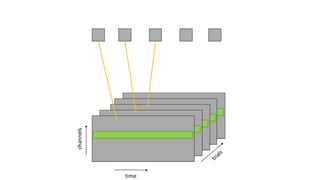
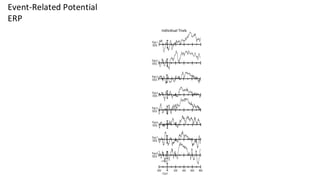
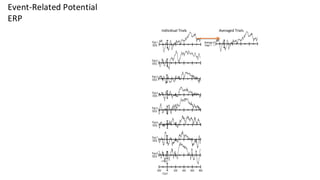
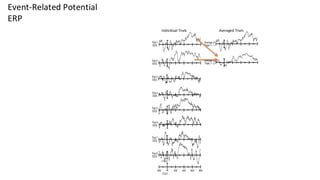
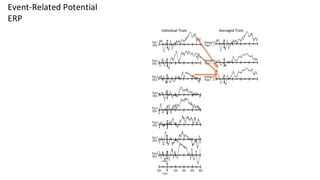
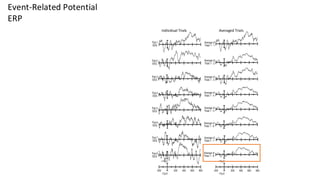
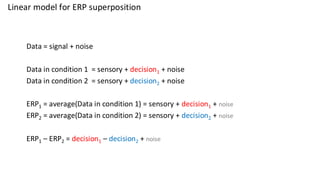
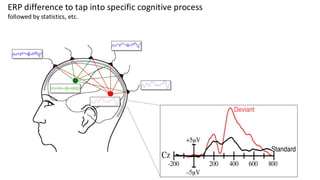
Get to know your data
preprocessing, segmentation and artifacts
Robert Oostenveld
Donders Institute, Radboud University, Nijmegen, NL
Karolinska Institutet, Stockholm, SE
robert.oostenveld@donders.ru.nl
Get to know your data
artifacts, preprocessing, segmentation
Robert Oostenveld
Donders Institute, Radboud University, Nijmegen, NL
Karolinska Institutet, Stockholm, SE
robert.oostenveld@donders.ru.nl
Get to know your data
artifacts, segmentation, preprocessing
Robert Oostenveld
Donders Institute, Radboud University, Nijmegen, NL
Karolinska Institutet, Stockholm, SE
robert.oostenveld@donders.ru.nl
Get to know your data
Robert Oostenveld
Donders Institute, Radboud University, Nijmegen, NL
Karolinska Institutet, Stockholm, SE
robert.oostenveld@donders.ru.nl
Get to know your data – learning goals
What are the characteristics of the data that we use in the analysis?
How to organize your raw data?
Quality assessment and control
What are the artifacts and why are they relevant?
Preprocessing and segmenting (or vice versa)
Selective averaging to get ERPs/ERFs
Collecting your data – in the lab or not
1. You have designed your own study, recruited your own participants,
and collected your own data in the lab.
2. You have received data from a (former) colleague in the lab,
or downloaded it from an online repository.
Either way: organize it!
EEG
system
acquisition
stimuli & task
EEG
system
acquisition
analysis
stimuli & task
participant
data
Preprocessing, processing, analysis
Prior to preprocessing
Data curation: collecting all files, naming them consistently, etc.
EEG/MEG data is large, consists of many files, and is complex
EEG data characteristics
64 channels, 500 Hz, 1 hour is approx. 500 MB
Typical study ~30 subjects, 15 GB of raw data
Many EEG companies, hence many file formats.
Analysis often done on laptops.
MEG data characteristics
SQUID-based systems
275 or 306 channels, 1000 Hz, 1 hour is approx. 4 GB
Typical study ~30 subjects, 120 GB of raw data
Few MEG companies, hence small number of formats
Neuromag/Elekta/MEGIN: one recording is one *.fif file
CTF: one recording is one *.ds directory with ~10 files
Analysis often done on “large” computers.
MEG data characteristics
OPM-based systems
SQUIDs OPMs
SQUIDs versus OPMs
FieldLine OPM system at Karolinska/Stockholm
now upgraded to 128 sensors (256 channels) and a smart helmet
CercaMagnetics OPM system installed in Cardiff
MEG data characteristics
OPM-based systems
A single OPM sensor can have 1-3 channels (x, y, z)
Total system has anywhere between 1 to 384 channels
Typical study ~30 subjects, 120 GB of raw data
OPM sensors can be placed in a flexible cap, like EEG, or in a 3D printed helmet
Position of the sensors relative the cap/helmet and to the head.
3D scans of the head and sensors, Polhemus digitizer, etc.
Auxiliary data
Anatomical MRI data
Directly from the scanner as ~200 DICOM files (*.ima, *.dcm)
Commonly converted to NIfTI format, one file (*.nii or *.nii.gz)
Behavioural data (time-resolved)
Mostly encoded as “triggers” together with the MEG or EEG data stream
Stimulus presentation log file
Video and/or audio recordings (e.g., for verbal responses)
Eye tracker for gaze and pupil diameter
…
Other data (usually tabular, not time-resolved)
Handedness, gender, age, …
Questionare outcomes
~ 50 MB
kB to GB
~ 1 kB
Organize your data FAIR
Findable
Make your data available in a catalog or repository
with a persistent identifier (DOI, handle) and metadata
Accessible
Be explicit about data usage terms (agreement with downloader)
Interoperable
Make your data human and machine readable, e.g. BIDS
Reusable
Make sure you document enough details, e.g. “data descriptor” paper
that can be cited, along with citing our data -> measurable impact!
Wilkinson et al. (2016) The FAIR Guiding Principles. Sci Data.
Organize your data FAIR
BIDS is a community initiative to make our data more FAIR
BIDS is a way to organize your existing raw data
To improve consistent and complete documentation
To facilitate re-use by your future self and others
BIDS is not
A new file format
A search engine
A data sharing platform
http://www.bids-standard.org/
BIDS for EEG and MEG
also for iEEG, MRI, NIRS, PET, motion capture, …
Just a bunch of directories and files on disk.
No special software required (although tools are available).
data/README
CHANGES
dataset_description.json
participants.tsv
/sub-01/anat/…
/sub-01/meg/…
/sub-01/eeg/sub-01_task-auditory_eeg.edf
/sub-01/eeg/sub-01_task-auditory_eeg.json
/sub-01/eeg/sub-01_task-auditory_channels.tsv
/sub-01/eeg/sub-01_task-auditory_events.tsv
/sub-01/eeg/sub-01_electrodes.tsv
/sub-01/eeg/sub-01_coordsystem.json
Actual EEG data
Directory structure
Metadata
BIDS for EEG and MEG
also for iEEG, MRI, NIRS, PET, motion capture, …
BIDS “sidecar” files for metadata
see also https://github.com/bids-standard/bids-examples
1) represent otherwise missing data
2) make it easier to query/search
As example for EEG:
_participants.tsv and json
_sessions.tsv and json
_scans.tsv and json
_eeg.json
_channels.tsv and json
_electrodes.tsv and json
_coordsystem.json
_photos.jpg
Get to know your data – learning goals
What are the characteristics of the data that we use in the analysis?
How to organize your raw data?
Quality assessment and control
What are the artifacts and why are they relevant?
Preprocessing and segmenting (or vice versa)
Selective averaging to get ERPs/ERFs
Preprocessing, processing, analysis
Prior to preprocessing
Data curation: collecting all files, naming them consistently, etc.
First processing steps do not depend (much) on the research question
Quality assessment
Artifact removal
Filtering, baseline correction
Aligning stimulus presentation and behavioral data with EEG/MEG
Segmenting/epoching
Aligning MRI with EEG/MEG sensors and anatomical processing
Later steps are tightly linked to the research question
Averaging ERPs in specific conditions
Computing power spectra, time-frequency analysis, connectivity
Source reconstruction
Modelling (e.g., using GLM)
Statistical inference
You should plan for multiple iterations of the preprocessing
goal
start
goal
start
Quality control and artifacts
EEG electrodes attached to subject’s head
Bad attachment -> bad signals
MEG is not directly attached to subject
Few bad channels (dependent on hardware tuning)
EEG artifacts
Anything that causes potential differences
MEG artifacts
Anything that causes magnetic fields
EEG artifacts
~1.000.000 Volt 1,5 Volt 1-10 micro Volt
EEG artifacts
Poor contact with the scalp
Electrochemical noise (sweating)
Electrostatic noise (e.g., rubbing feet over the carpet)
Mostly common-mode, i.e., similar on all channels
Power line noise, 50Hz electrical equipment
Other types of (physiological) bioelectricity
Muscle (EMG)
Heart (ECG)
Eye movements (EOG)
EEG electrode movement
electrode
e-
e-
electrolite = gel, paste, water, sweat, … something with ions
+
-
-
+ +
-
scalp
Cl-
Cl-
Cl-
K+
Na+
Ca2+ Cl-
MEG artifacts (and shielding)
MRI magnet
3 T
Earth field
10-5 T
Human brain
10-12 T
magnetically shielded room (MSR)
built by David Cohen at MIT in 1969
Common MEG artifacts
Power line noise, 50Hz equipment
Large metal objects moving outside the MSR
Car, trolly, elevator, the fan of airconditioning
Residual field of the earth
Building vibrations cause movements of the MSR walls and dewar
Other types of (physiological) bioelectricity
Muscle (EMG)
Heart (ECG)
Eye movements (EOG)
Movements in mobile MEG with OPMs
moving the sensor in the residual gradient or rotating the sensor in the residual field
EEG/MEG artifact removal
Identify and remove bad channels (or interpolate)
Identify and remove bad segments
Continuous data
Segmented data, only the pieces of interest
Identify trials in which the behavior was incorrect
or in which the data cannot be recovered.
MOTO
R
DECISION
The brain is a hierarchical functional network
both sequential and parallel processing, ff and fb
EEG/MEG to study perception, cognition and behavior
Experimental task and behavioral readouts ensure
that we are tapping in to the desired cognitive processes.
Infant EEG, baby looking away ->, they did not see the stimulus
Participant blinks at the stimulus -> they did not see the stimulus
No response in stimulus-response task -> the stimulus was probably processed differently
Participant responds too slow -> a different cognitive process was interfering
The experimental task often involves attention monitoring, includes catch trials, or an
extra condition with responses, these behavioral responses (or artifacts) need to be
analyzed.
EEG/MEG data cleaning
After rejecting bad behavior and broken data, we can clean the remainder.
The data is a spatio-temporal mixing of different sources.
Spatio-temporal models can separate brain and noise sources.
For EEG: ICA, PCA, IClabel, ASR, MARA, GEDAI
For MEG: SSP, SSS/tSSS (Maxfilter), HFC, AMM, ICA
These are based on data-driven or biophysical models of the
spatial distribution of the brain activity or the noise.
Get to know your data – learning goals
What are the characteristics of the data that we use in the analysis?
How to organize your raw data?
Quality assessment and control
What are the artifacts and why are they relevant?
Preprocessing and segmenting (or vice versa)
Selective averaging to get ERPs/ERFs
Analyzing the brain activity in an event-related task
Signal-to-Noise-Ratio (SNR) is not sufficient to directly observe
the brain responses
Stimulus or task is repeated many times (i.e. trials)
For example: one trial every 4 seconds, ~900 trials in one hour
Experimental manipulation is usually a subtle difference between trials
EEG/MEG response of interest is only about 1 second around the stimulus
So 1 hour recording results in only ~900 seconds of useable data
Analyzing the brain activity in an event-related task
http://doi.org/10.1038/sdata.2015.1
Analyzing the brain activity in an event-related task
900 trials
900 times a picture of something
900 trials
600 faces
300 unfamiliar
300 familiar (i.e., celebrities)
300 scrambled faces
900 trials
150 unfamilar faces 1st time, 150 unfamilar faces 2nd time
150 familar faces 1st time, 150 familar faces 2nd time
150 scrambled faces 1st, 150 scrambled 2nd time
Also other dimensions: gender, emotional expression, gaze direction, …
1st
presentation
2nd
presentation
unfamiliar 150 150
familiar 150 150
scrambled 150 150
http://doi.org/10.1038/sdata.2015.1
Analyzing the brain activity in an event-related task
Multi-factorial design:
stimulus × presentation × gender × emotional expression × gaze direction × …
150 150
150 150
150 150
150 150
150 150
150 150
150 150
150 150
150 150
1st 2nd
unfamiliar
familiar
scrambled
150 150
150 150
150 150
faces vs scrambled unfamiliar vs familiar 1st vs 2nd presentation
interaction (ANOVA)
Analyzing the brain activity in an event-related task
EEG
system
acquisition
analysis
stimuli & task
triggers
~900 trials
~64 channels
~ 1 second = 1100 samples
So 900x64x1100 = 63.000.000 numbers
… times 16 subjects
channels
time
Individual Trials Averaged Trials
Event-Related Potential
ERP
Individual Trials Averaged Trials
Event-Related Potential
ERP
Individual Trials Averaged Trials
Event-Related Potential
ERP
Individual Trials Averaged Trials
Event-Related Potential
ERP
Individual Trials Averaged Trials
Event-Related Potential
ERP
Event-Related Potential
ERP
The brain signal of interest is assumed to be constant over all trials.
The noise is independent over trials.
After averaging the noise is proportional to 1/sqrt(Ntrials).
Averaging over trials improves the signal-to-noise ratio (SNR).
10 trials -> SNR is sqrt(10) ≅ 3x better
100 trials -> SNR is sqrt(100) ≅ 10x better
Linear model for ERP superposition
Data = signal + noise
Data in condition 1 = signal1 + noise
Data in condition 2 = signal2 + noise
ERP1 = average(Data in condition 1) = signal1 + noise
ERP2 = average(Data in condition 2) = signal2 + noise
ERP1 – ERP2 = signal1 – signal2 + noise
Related to the task, constant over trials
Not related to the task
Linear model for ERP superposition
Data = signal + noise
Data in condition 1 = sensory + decision1 + noise
Data in condition 2 = sensory + decision2 + noise
ERP1 = average(Data in condition 1) = sensory + decision1 + noise
ERP2 = average(Data in condition 2) = sensory + decision2 + noise
ERP1 – ERP2 = decision1 – decision2 + noise
ERP difference to tap into specific cognitive process
followed by statistics, etc.
Get to know your data – learning goals
What are the characteristics of the data that we use in the analysis?
How to organize your raw data?
Quality assessment and control
What are the artifacts and why are they relevant?
Preprocessing and segmenting (or vice versa)
Selective averaging to get ERPs/ERFs
Get to know your data
artifacts, preprocessing, segmentation
Robert Oostenveld
Donders Institute, Radboud University, Nijmegen, NL
Karolinska Institutet, Stockholm, SE
robert.oostenveld@donders.ru.nl

Get to know your EEG and MEG data - artifacts, segmenting, preprocessing

  • 1.
    Get to knowyour data preprocessing, segmentation and artifacts Robert Oostenveld Donders Institute, Radboud University, Nijmegen, NL Karolinska Institutet, Stockholm, SE robert.oostenveld@donders.ru.nl
  • 2.
    Get to knowyour data artifacts, preprocessing, segmentation Robert Oostenveld Donders Institute, Radboud University, Nijmegen, NL Karolinska Institutet, Stockholm, SE robert.oostenveld@donders.ru.nl
  • 3.
    Get to knowyour data artifacts, segmentation, preprocessing Robert Oostenveld Donders Institute, Radboud University, Nijmegen, NL Karolinska Institutet, Stockholm, SE robert.oostenveld@donders.ru.nl
  • 4.
    Get to knowyour data Robert Oostenveld Donders Institute, Radboud University, Nijmegen, NL Karolinska Institutet, Stockholm, SE robert.oostenveld@donders.ru.nl
  • 5.
    Get to knowyour data – learning goals What are the characteristics of the data that we use in the analysis? How to organize your raw data? Quality assessment and control What are the artifacts and why are they relevant? Preprocessing and segmenting (or vice versa) Selective averaging to get ERPs/ERFs
  • 6.
    Collecting your data– in the lab or not 1. You have designed your own study, recruited your own participants, and collected your own data in the lab. 2. You have received data from a (former) colleague in the lab, or downloaded it from an online repository. Either way: organize it!
  • 7.
  • 8.
  • 9.
    Preprocessing, processing, analysis Priorto preprocessing Data curation: collecting all files, naming them consistently, etc. EEG/MEG data is large, consists of many files, and is complex
  • 10.
    EEG data characteristics 64channels, 500 Hz, 1 hour is approx. 500 MB Typical study ~30 subjects, 15 GB of raw data Many EEG companies, hence many file formats. Analysis often done on laptops.
  • 11.
    MEG data characteristics SQUID-basedsystems 275 or 306 channels, 1000 Hz, 1 hour is approx. 4 GB Typical study ~30 subjects, 120 GB of raw data Few MEG companies, hence small number of formats Neuromag/Elekta/MEGIN: one recording is one *.fif file CTF: one recording is one *.ds directory with ~10 files Analysis often done on “large” computers.
  • 12.
  • 13.
  • 14.
    FieldLine OPM systemat Karolinska/Stockholm now upgraded to 128 sensors (256 channels) and a smart helmet
  • 15.
    CercaMagnetics OPM systeminstalled in Cardiff
  • 16.
    MEG data characteristics OPM-basedsystems A single OPM sensor can have 1-3 channels (x, y, z) Total system has anywhere between 1 to 384 channels Typical study ~30 subjects, 120 GB of raw data OPM sensors can be placed in a flexible cap, like EEG, or in a 3D printed helmet Position of the sensors relative the cap/helmet and to the head. 3D scans of the head and sensors, Polhemus digitizer, etc.
  • 17.
    Auxiliary data Anatomical MRIdata Directly from the scanner as ~200 DICOM files (*.ima, *.dcm) Commonly converted to NIfTI format, one file (*.nii or *.nii.gz) Behavioural data (time-resolved) Mostly encoded as “triggers” together with the MEG or EEG data stream Stimulus presentation log file Video and/or audio recordings (e.g., for verbal responses) Eye tracker for gaze and pupil diameter … Other data (usually tabular, not time-resolved) Handedness, gender, age, … Questionare outcomes ~ 50 MB kB to GB ~ 1 kB
  • 18.
    Organize your dataFAIR Findable Make your data available in a catalog or repository with a persistent identifier (DOI, handle) and metadata Accessible Be explicit about data usage terms (agreement with downloader) Interoperable Make your data human and machine readable, e.g. BIDS Reusable Make sure you document enough details, e.g. “data descriptor” paper that can be cited, along with citing our data -> measurable impact! Wilkinson et al. (2016) The FAIR Guiding Principles. Sci Data.
  • 19.
    Organize your dataFAIR BIDS is a community initiative to make our data more FAIR BIDS is a way to organize your existing raw data To improve consistent and complete documentation To facilitate re-use by your future self and others BIDS is not A new file format A search engine A data sharing platform http://www.bids-standard.org/
  • 20.
    BIDS for EEGand MEG also for iEEG, MRI, NIRS, PET, motion capture, … Just a bunch of directories and files on disk. No special software required (although tools are available).
  • 21.
  • 22.
    BIDS “sidecar” filesfor metadata see also https://github.com/bids-standard/bids-examples 1) represent otherwise missing data 2) make it easier to query/search As example for EEG: _participants.tsv and json _sessions.tsv and json _scans.tsv and json _eeg.json _channels.tsv and json _electrodes.tsv and json _coordsystem.json _photos.jpg
  • 23.
    Get to knowyour data – learning goals What are the characteristics of the data that we use in the analysis? How to organize your raw data? Quality assessment and control What are the artifacts and why are they relevant? Preprocessing and segmenting (or vice versa) Selective averaging to get ERPs/ERFs
  • 24.
    Preprocessing, processing, analysis Priorto preprocessing Data curation: collecting all files, naming them consistently, etc. First processing steps do not depend (much) on the research question Quality assessment Artifact removal Filtering, baseline correction Aligning stimulus presentation and behavioral data with EEG/MEG Segmenting/epoching Aligning MRI with EEG/MEG sensors and anatomical processing Later steps are tightly linked to the research question Averaging ERPs in specific conditions Computing power spectra, time-frequency analysis, connectivity Source reconstruction Modelling (e.g., using GLM) Statistical inference
  • 25.
    Preprocessing, processing, analysis Priorto preprocessing Data curation: collecting all files, naming them consistently, etc. First processing steps do not depend (much) on the research question Quality assessment Artifact removal Filtering, baseline correction Aligning stimulus presentation and behavioral data with EEG/MEG Segmenting/epoching Aligning MRI with EEG/MEG sensors and anatomical processing Later steps are tightly linked to the research question Averaging ERPs in specific conditions Computing power spectra, time-frequency analysis, connectivity Source reconstruction Modelling (e.g., using GLM) Statistical inference
  • 26.
    You should planfor multiple iterations of the preprocessing goal start goal start
  • 27.
    Quality control andartifacts EEG electrodes attached to subject’s head Bad attachment -> bad signals MEG is not directly attached to subject Few bad channels (dependent on hardware tuning) EEG artifacts Anything that causes potential differences MEG artifacts Anything that causes magnetic fields
  • 28.
    EEG artifacts ~1.000.000 Volt1,5 Volt 1-10 micro Volt
  • 29.
    EEG artifacts Poor contactwith the scalp Electrochemical noise (sweating) Electrostatic noise (e.g., rubbing feet over the carpet) Mostly common-mode, i.e., similar on all channels Power line noise, 50Hz electrical equipment Other types of (physiological) bioelectricity Muscle (EMG) Heart (ECG) Eye movements (EOG)
  • 30.
    EEG electrode movement electrode e- e- electrolite= gel, paste, water, sweat, … something with ions + - - + + - scalp Cl- Cl- Cl- K+ Na+ Ca2+ Cl-
  • 31.
    MEG artifacts (andshielding) MRI magnet 3 T Earth field 10-5 T Human brain 10-12 T magnetically shielded room (MSR) built by David Cohen at MIT in 1969
  • 32.
    Common MEG artifacts Powerline noise, 50Hz equipment Large metal objects moving outside the MSR Car, trolly, elevator, the fan of airconditioning Residual field of the earth Building vibrations cause movements of the MSR walls and dewar Other types of (physiological) bioelectricity Muscle (EMG) Heart (ECG) Eye movements (EOG)
  • 33.
    Movements in mobileMEG with OPMs moving the sensor in the residual gradient or rotating the sensor in the residual field
  • 34.
    EEG/MEG artifact removal Identifyand remove bad channels (or interpolate) Identify and remove bad segments Continuous data Segmented data, only the pieces of interest Identify trials in which the behavior was incorrect or in which the data cannot be recovered.
  • 35.
    MOTO R DECISION The brain isa hierarchical functional network both sequential and parallel processing, ff and fb
  • 36.
    EEG/MEG to studyperception, cognition and behavior Experimental task and behavioral readouts ensure that we are tapping in to the desired cognitive processes. Infant EEG, baby looking away ->, they did not see the stimulus Participant blinks at the stimulus -> they did not see the stimulus No response in stimulus-response task -> the stimulus was probably processed differently Participant responds too slow -> a different cognitive process was interfering The experimental task often involves attention monitoring, includes catch trials, or an extra condition with responses, these behavioral responses (or artifacts) need to be analyzed.
  • 37.
    EEG/MEG data cleaning Afterrejecting bad behavior and broken data, we can clean the remainder. The data is a spatio-temporal mixing of different sources. Spatio-temporal models can separate brain and noise sources. For EEG: ICA, PCA, IClabel, ASR, MARA, GEDAI For MEG: SSP, SSS/tSSS (Maxfilter), HFC, AMM, ICA These are based on data-driven or biophysical models of the spatial distribution of the brain activity or the noise.
  • 38.
    Get to knowyour data – learning goals What are the characteristics of the data that we use in the analysis? How to organize your raw data? Quality assessment and control What are the artifacts and why are they relevant? Preprocessing and segmenting (or vice versa) Selective averaging to get ERPs/ERFs
  • 39.
    Analyzing the brainactivity in an event-related task Signal-to-Noise-Ratio (SNR) is not sufficient to directly observe the brain responses Stimulus or task is repeated many times (i.e. trials) For example: one trial every 4 seconds, ~900 trials in one hour Experimental manipulation is usually a subtle difference between trials EEG/MEG response of interest is only about 1 second around the stimulus So 1 hour recording results in only ~900 seconds of useable data
  • 40.
    Analyzing the brainactivity in an event-related task http://doi.org/10.1038/sdata.2015.1
  • 41.
    Analyzing the brainactivity in an event-related task 900 trials 900 times a picture of something 900 trials 600 faces 300 unfamiliar 300 familiar (i.e., celebrities) 300 scrambled faces 900 trials 150 unfamilar faces 1st time, 150 unfamilar faces 2nd time 150 familar faces 1st time, 150 familar faces 2nd time 150 scrambled faces 1st, 150 scrambled 2nd time Also other dimensions: gender, emotional expression, gaze direction, … 1st presentation 2nd presentation unfamiliar 150 150 familiar 150 150 scrambled 150 150 http://doi.org/10.1038/sdata.2015.1
  • 42.
    Analyzing the brainactivity in an event-related task Multi-factorial design: stimulus × presentation × gender × emotional expression × gaze direction × …
  • 43.
    150 150 150 150 150150 150 150 150 150 150 150 150 150 150 150 150 150 1st 2nd unfamiliar familiar scrambled 150 150 150 150 150 150 faces vs scrambled unfamiliar vs familiar 1st vs 2nd presentation interaction (ANOVA) Analyzing the brain activity in an event-related task
  • 45.
  • 48.
    ~900 trials ~64 channels ~1 second = 1100 samples So 900x64x1100 = 63.000.000 numbers … times 16 subjects
  • 49.
  • 50.
    Individual Trials AveragedTrials Event-Related Potential ERP
  • 51.
    Individual Trials AveragedTrials Event-Related Potential ERP
  • 52.
    Individual Trials AveragedTrials Event-Related Potential ERP
  • 53.
    Individual Trials AveragedTrials Event-Related Potential ERP
  • 54.
    Individual Trials AveragedTrials Event-Related Potential ERP
  • 55.
    Event-Related Potential ERP The brainsignal of interest is assumed to be constant over all trials. The noise is independent over trials. After averaging the noise is proportional to 1/sqrt(Ntrials). Averaging over trials improves the signal-to-noise ratio (SNR). 10 trials -> SNR is sqrt(10) ≅ 3x better 100 trials -> SNR is sqrt(100) ≅ 10x better
  • 56.
    Linear model forERP superposition
  • 57.
    Linear model forERP superposition
  • 58.
    Linear model forERP superposition Data = signal + noise Data in condition 1 = signal1 + noise Data in condition 2 = signal2 + noise ERP1 = average(Data in condition 1) = signal1 + noise ERP2 = average(Data in condition 2) = signal2 + noise ERP1 – ERP2 = signal1 – signal2 + noise Related to the task, constant over trials Not related to the task
  • 59.
    Linear model forERP superposition Data = signal + noise Data in condition 1 = sensory + decision1 + noise Data in condition 2 = sensory + decision2 + noise ERP1 = average(Data in condition 1) = sensory + decision1 + noise ERP2 = average(Data in condition 2) = sensory + decision2 + noise ERP1 – ERP2 = decision1 – decision2 + noise
  • 60.
    ERP difference totap into specific cognitive process followed by statistics, etc.
  • 61.
    Get to knowyour data – learning goals What are the characteristics of the data that we use in the analysis? How to organize your raw data? Quality assessment and control What are the artifacts and why are they relevant? Preprocessing and segmenting (or vice versa) Selective averaging to get ERPs/ERFs
  • 62.
    Get to knowyour data artifacts, preprocessing, segmentation Robert Oostenveld Donders Institute, Radboud University, Nijmegen, NL Karolinska Institutet, Stockholm, SE robert.oostenveld@donders.ru.nl