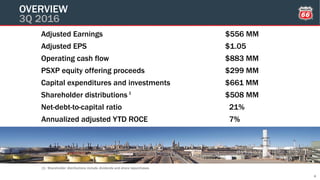
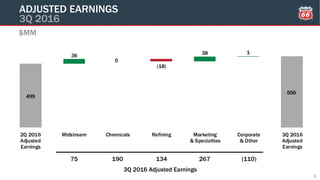
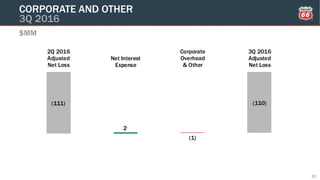
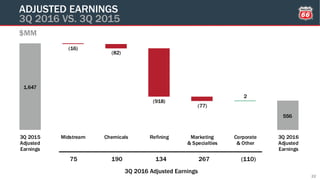
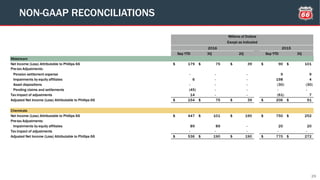
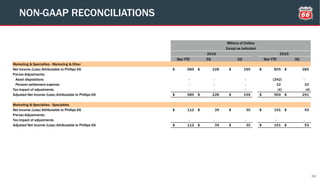
- Phillips 66 reported adjusted earnings of $556 million for Q3 2016 compared to $499 million in Q2 2016.
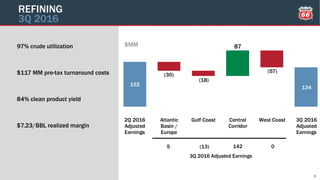
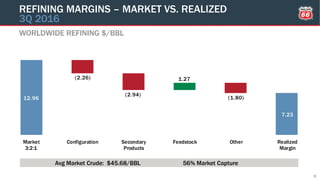
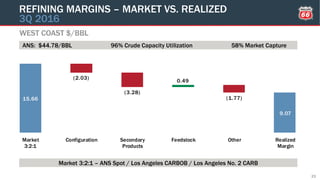
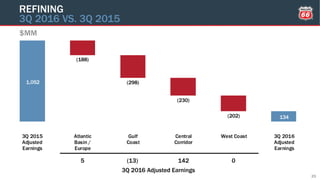
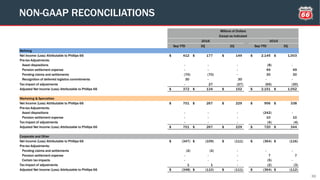
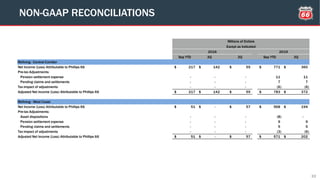
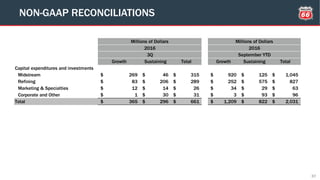
- Refining earnings decreased from $134 million to $142 million due to higher turnaround costs and lower margins.
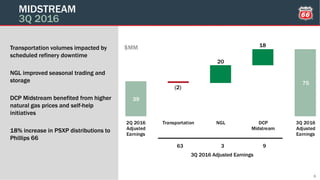
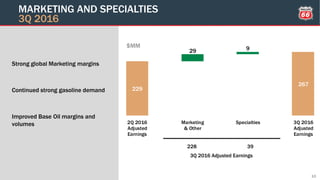
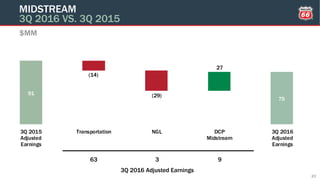
- Midstream earnings increased from $39 million to $75 million due to higher volumes and natural gas prices.
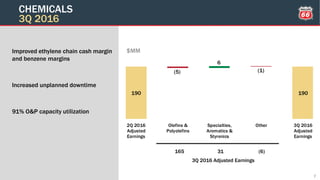
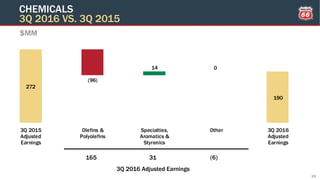
- Chemicals earnings remained flat at $190 million despite higher margins as downtime offset gains.