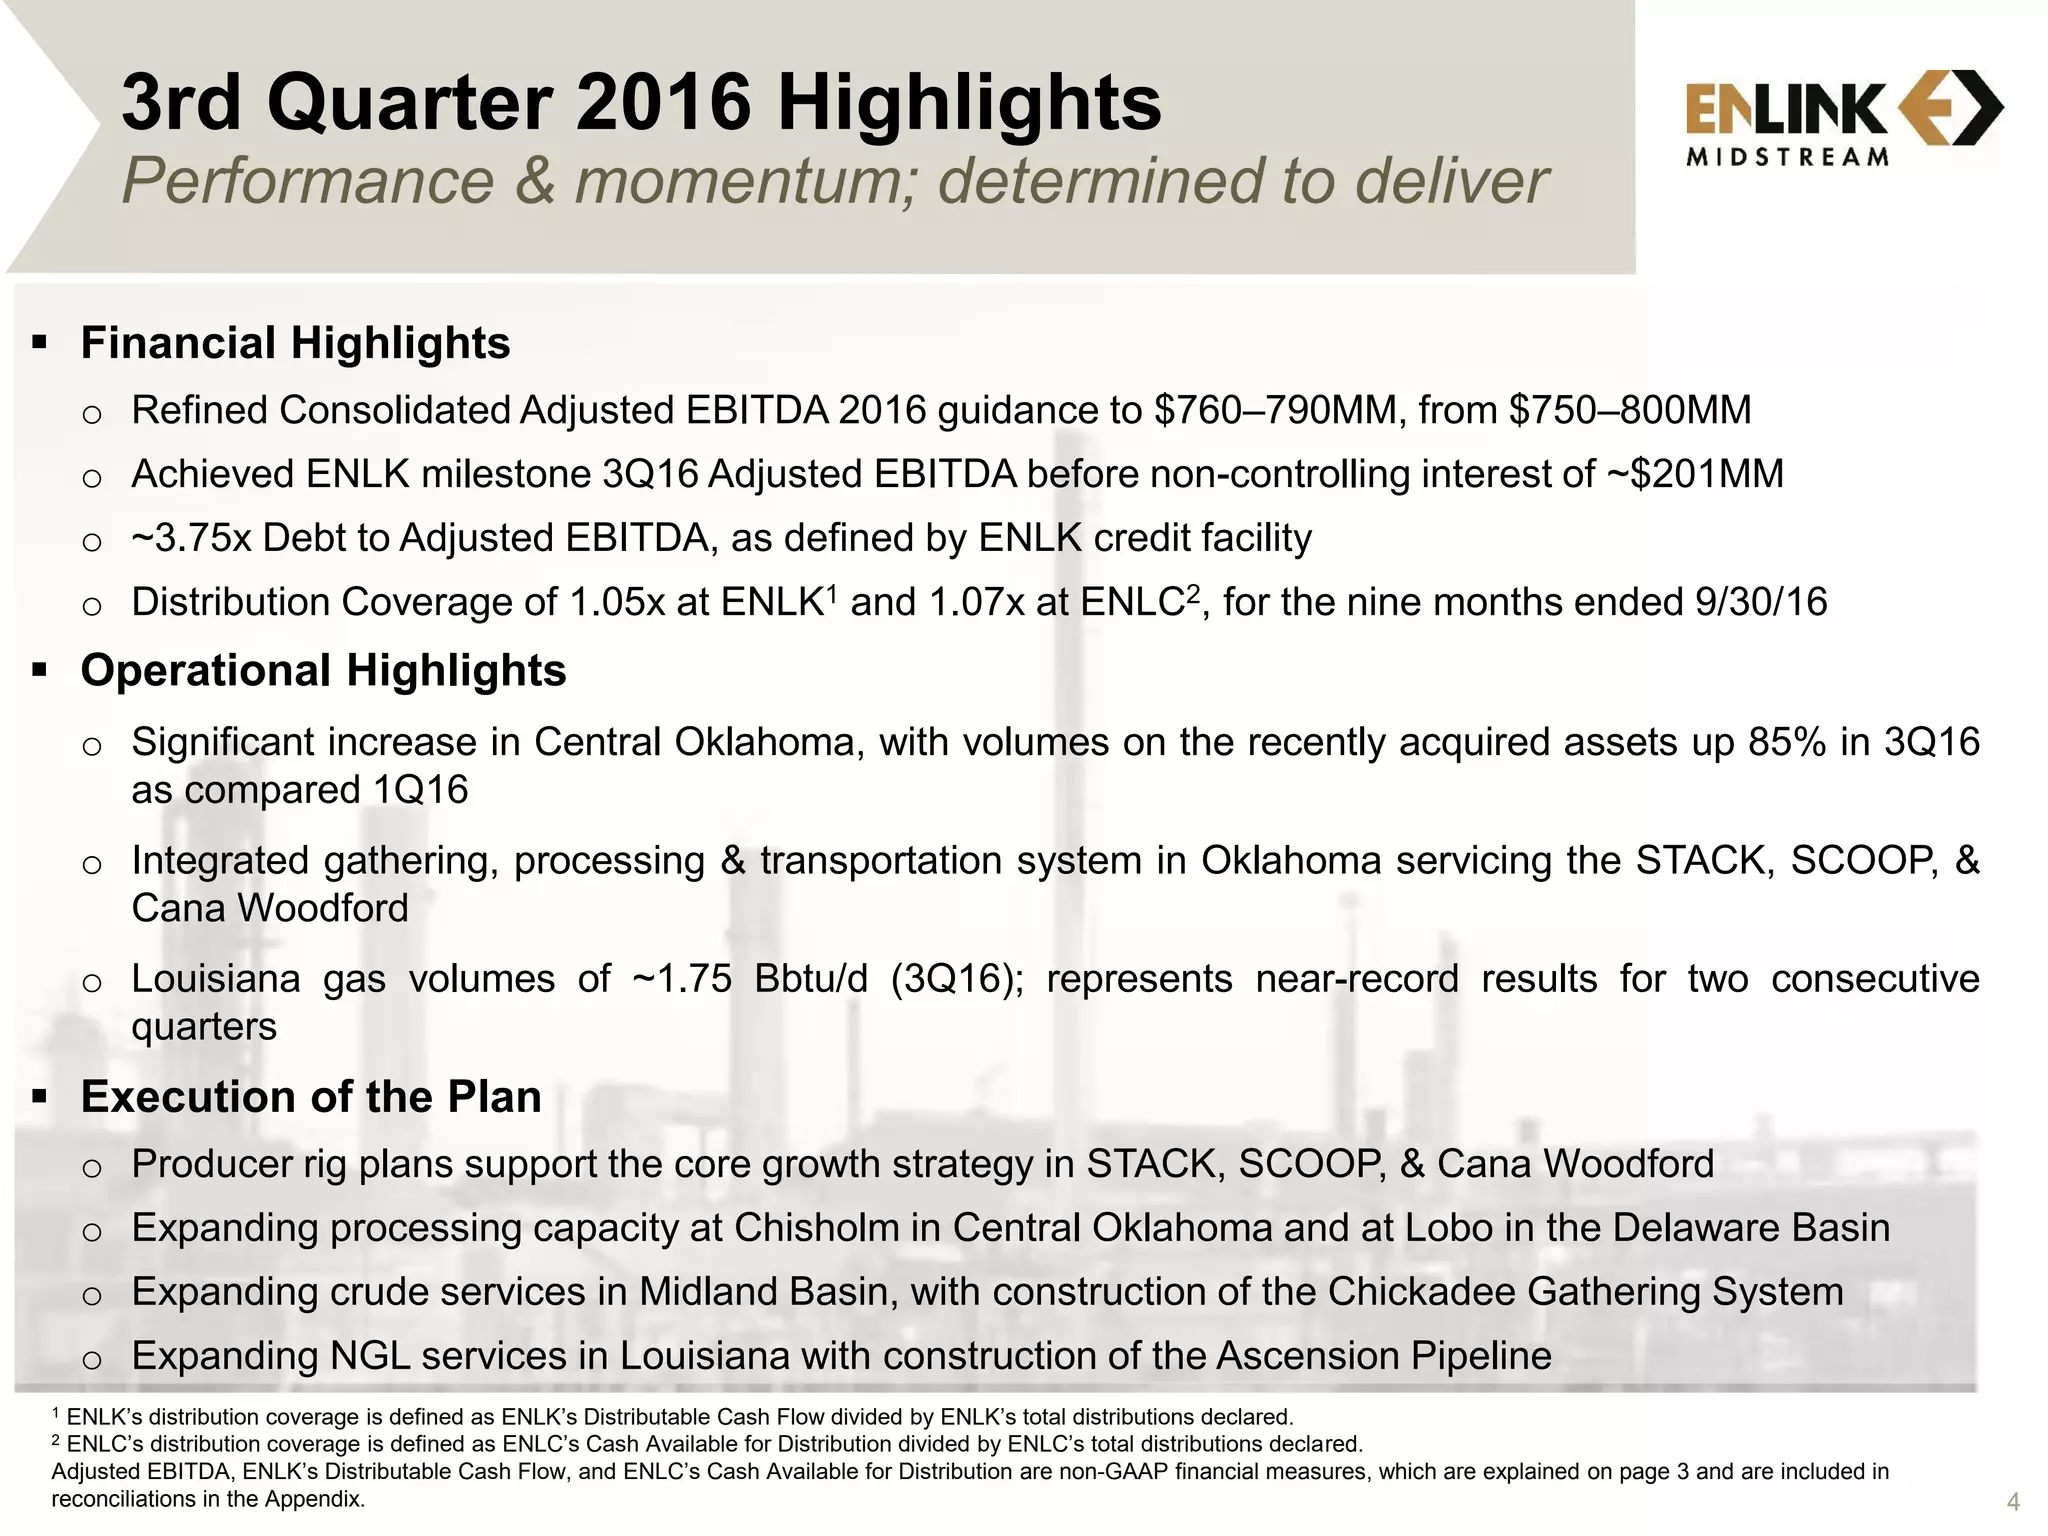
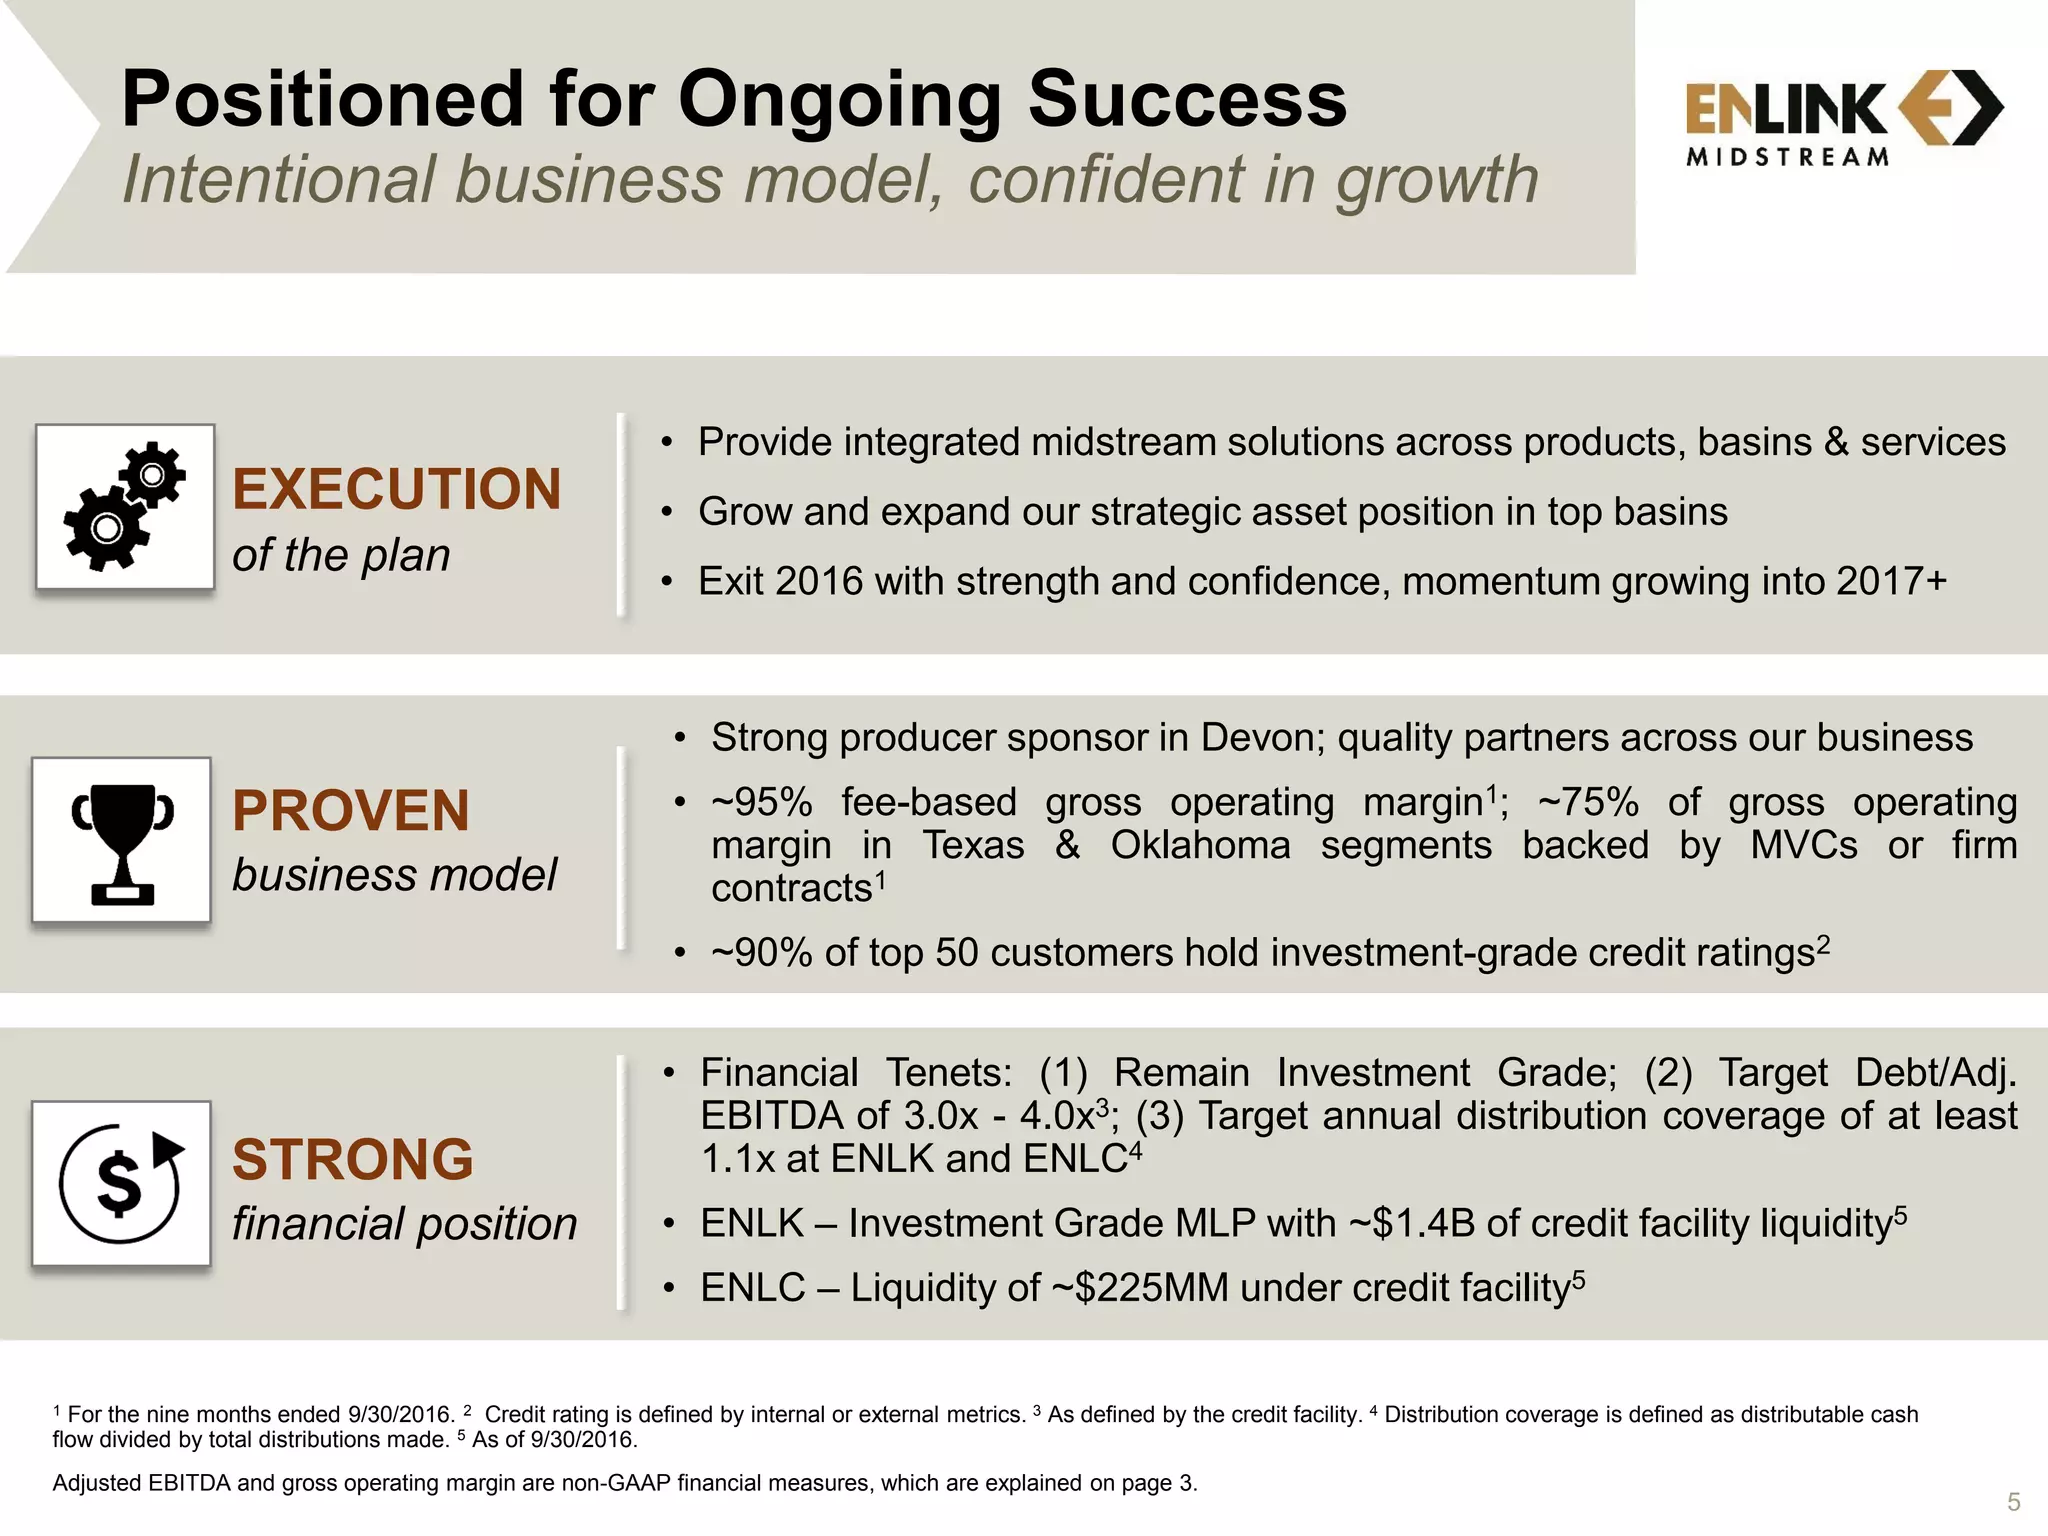
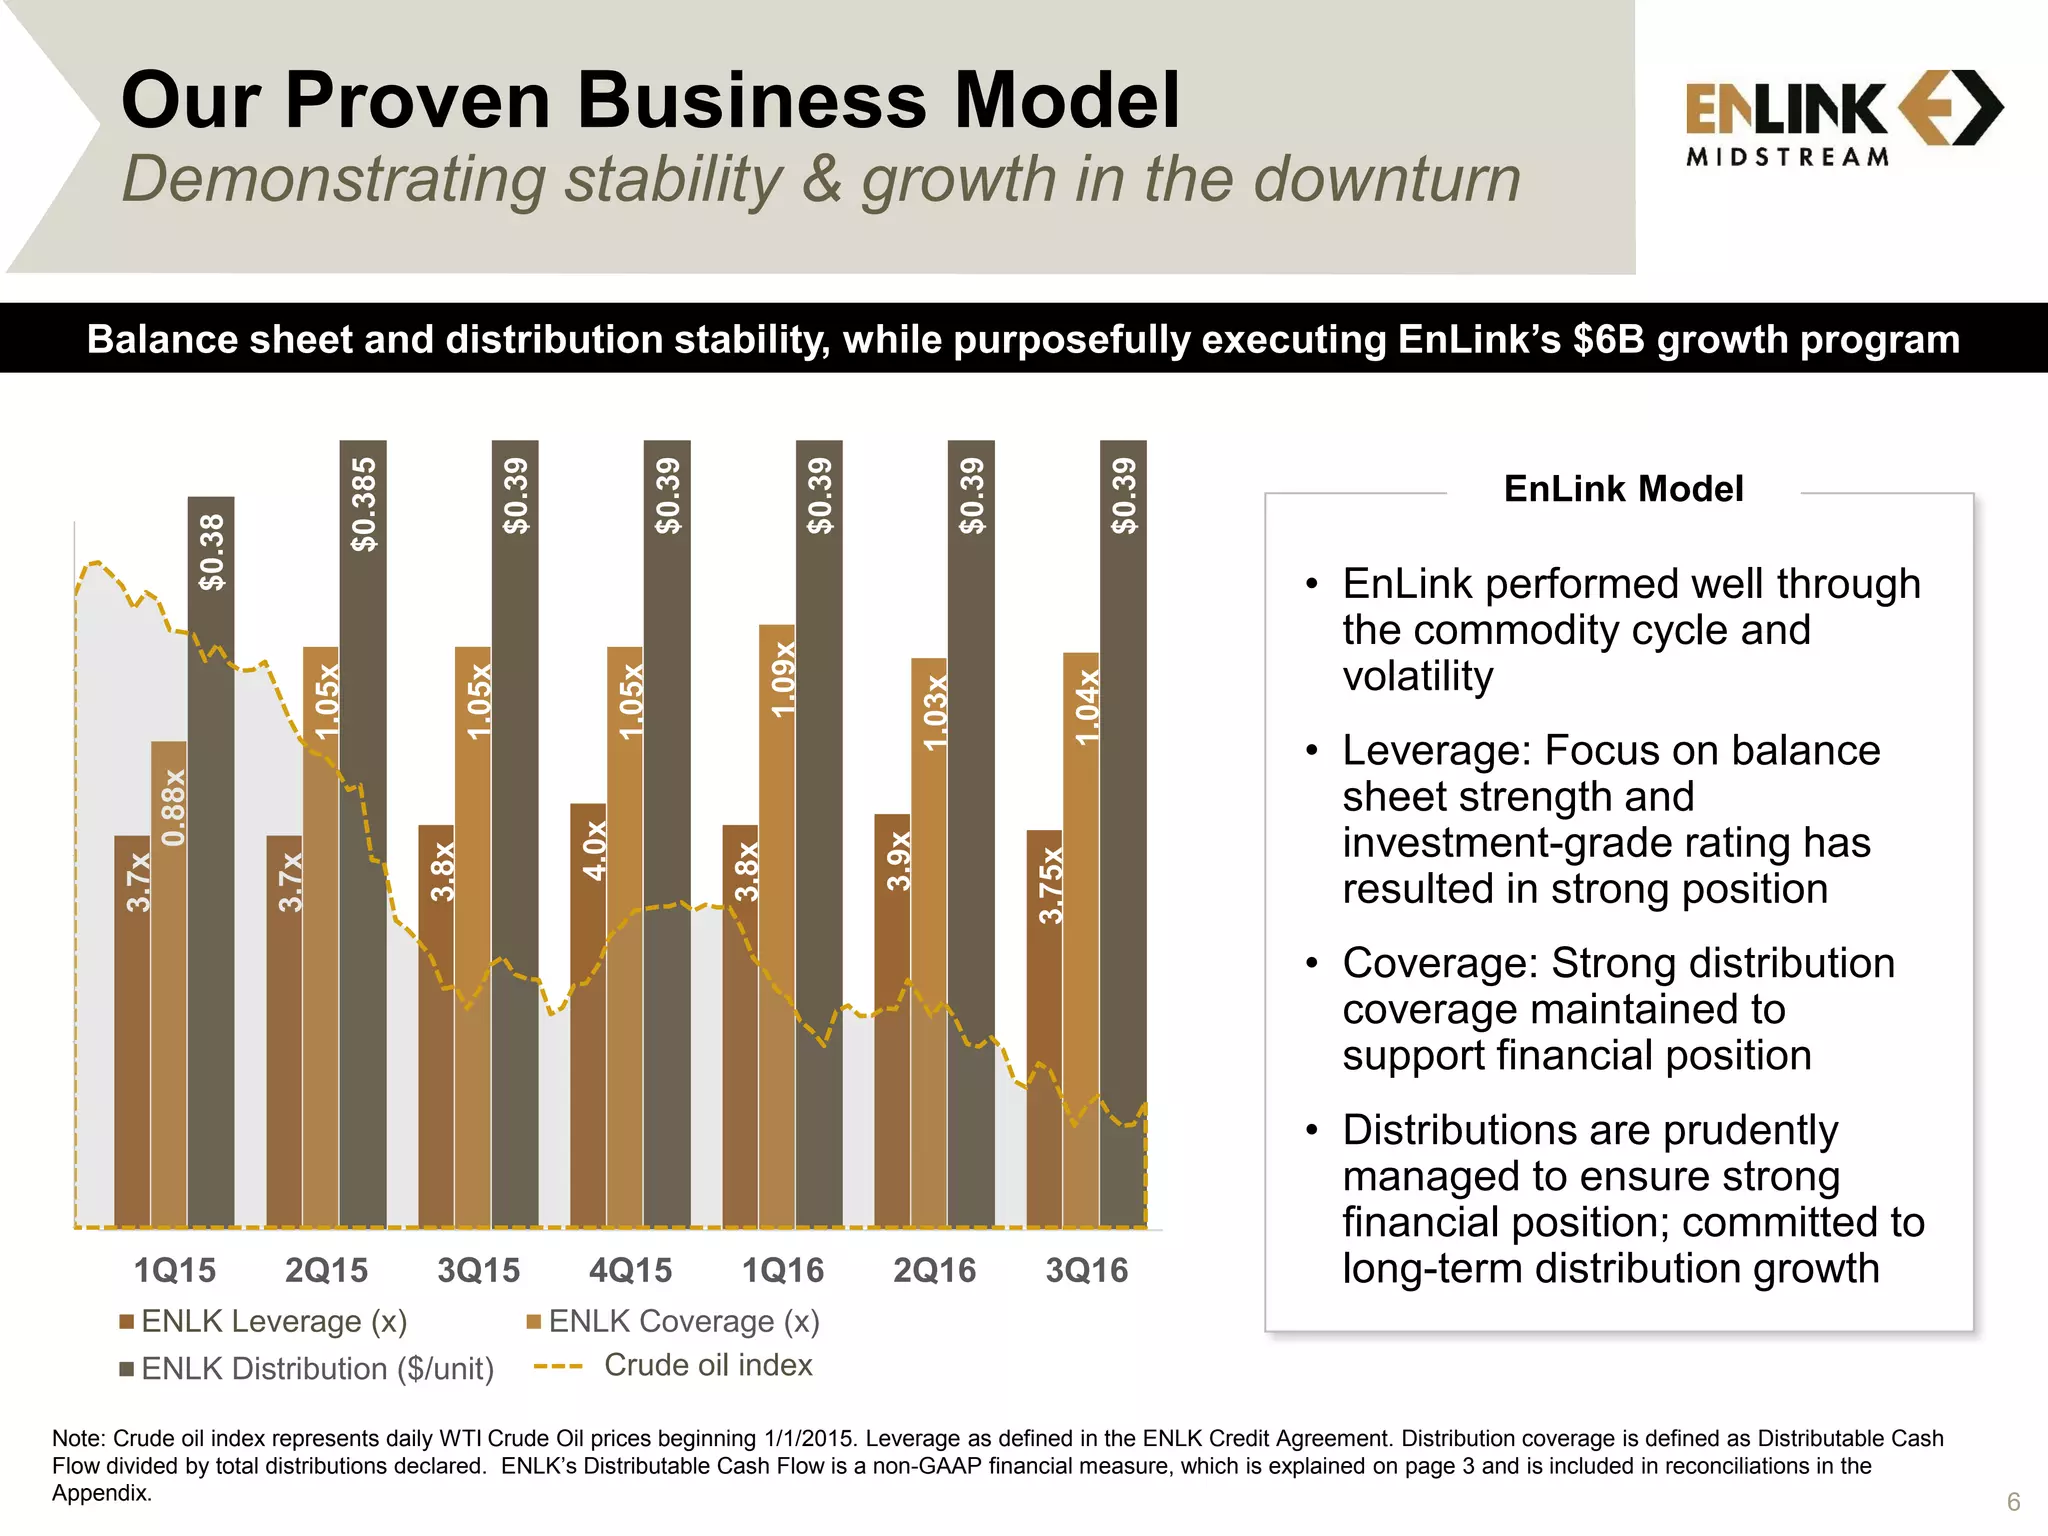
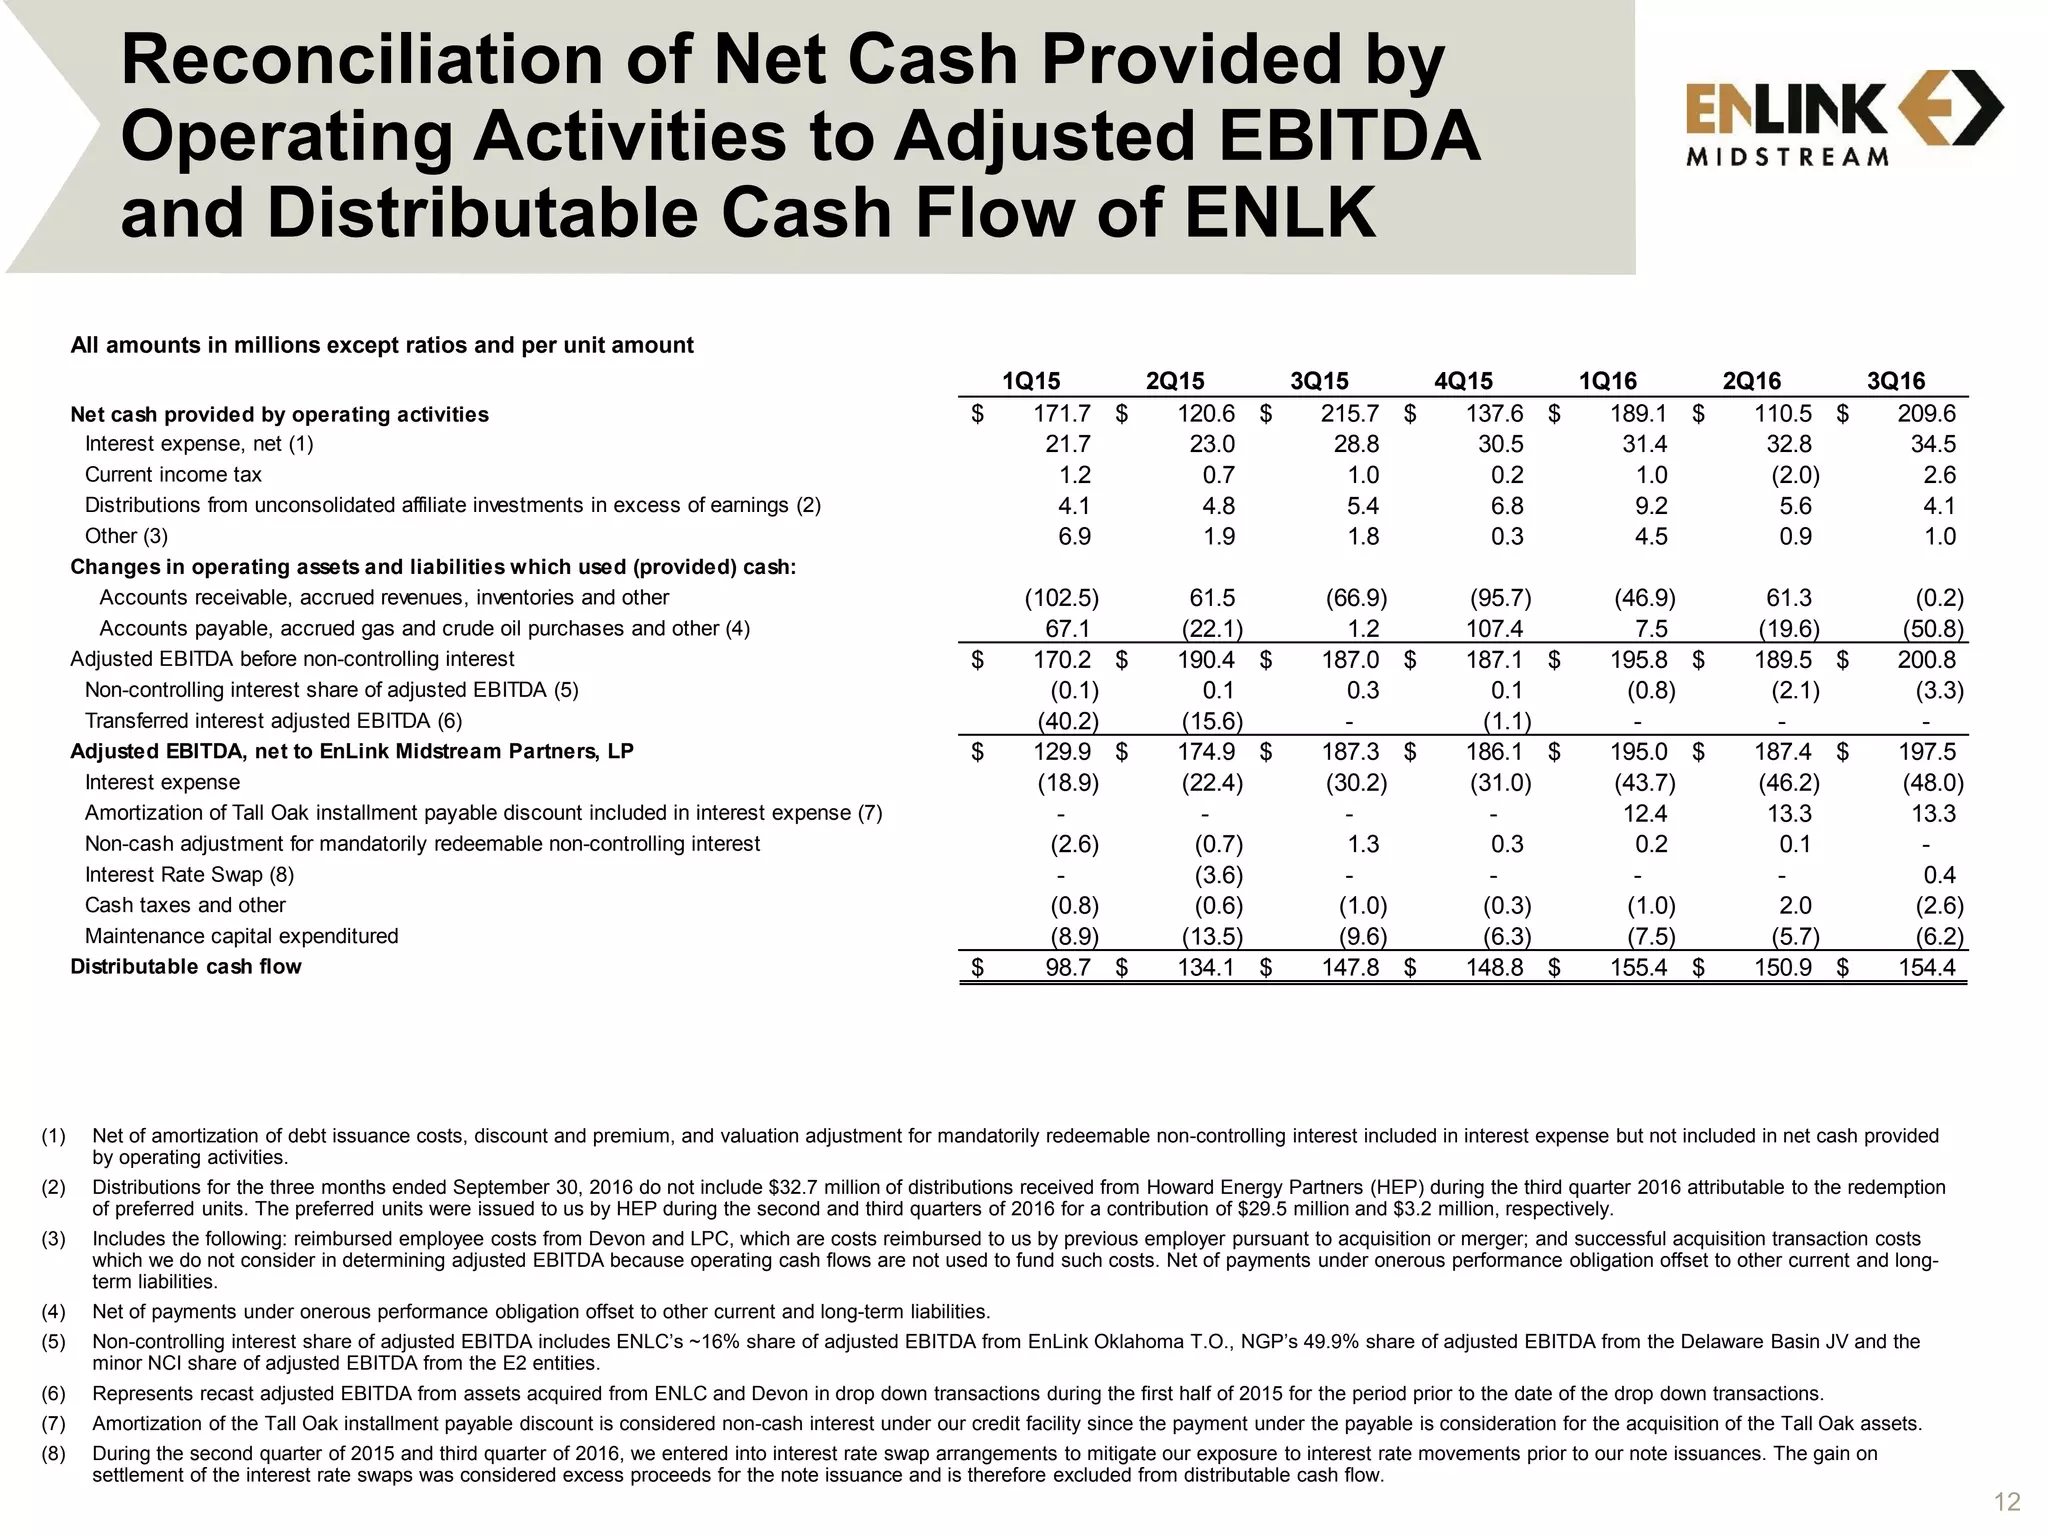
This document provides an overview of Jefferies Energy Conference and includes forward-looking statements and notices about the presentation. It discusses EnLink Midstream's 3rd quarter 2016 financial highlights including refining their consolidated adjusted EBITDA guidance range to $760-790 million, achieving approximately $201 million in adjusted EBITDA before non-controlling interest for ENLK in 3Q16, and a debt ratio of approximately 3.75 times. It also includes notices about non-GAAP financial measures used and forward-looking statements.
- SemGroup reported third quarter 2016 results with Adjusted EBITDA of $71.3 million, down from $77.7 million in the first quarter of 2016. Net income was a loss of $7.4 million.
- For full year 2016, SemGroup updated capital expenditures guidance to $350 million, a $100 million reduction due to timing of the Maurepas pipeline project.
- SemGroup has a strong balance sheet with $1.1 billion in liquidity and a leverage ratio of 3.0x at the end of the third quarter, within its target leverage of below 4.5x.
This document provides an overview of SemGroup's non-GAAP financial measures, forward-looking statements, and strategic growth plan. It discusses SemGroup's Adjusted EBITDA measure and why certain items are excluded. It also notes key limitations of non-GAAP measures and that management compensates for these limitations. An overview is then provided of SemGroup's crude and natural gas assets, operations, and strategic growth areas. Key performance metrics and asset details are highlighted for SemGroup's crude and natural gas businesses.
1) EnLink Midstream provides guidance for 2017 including adjusted EBITDA of $815-885 million and distributable cash flow of $590-650 million.
2) Capital expenditures are projected to be $590-750 million focused on growth projects in core areas like Central Oklahoma, Delaware Basin, and Louisiana.
3) Volume growth is expected across all segments, especially in Central Oklahoma where volumes are projected to increase 180% year-over-year.
This document contains an investor presentation for Crestwood Midstream Partners LP and Crestwood Equity Partners LP. The presentation highlights the companies' diversified portfolio of midstream assets across major US basins, including the Bakken, Delaware Basin, PRB Niobrara, and Marcellus. Over 85% of forecasted 2017 EBITDA is supported by take-or-pay or fixed-fee contracts with investment grade customers. The presentation outlines Crestwood's organic growth strategy through 2018-2021 focused on high-return expansion projects around its core assets to drive distributable cash flow per unit growth.
This document provides an overview of SemGroup's non-GAAP financial measures, forward-looking statements, and strategy for creating shareholder value. It discusses SemGroup's stable cash flows derived from long-term contracts and investment-grade counterparties. The presentation also outlines SemGroup's crude oil and natural gas assets located in key North American basins and its strategy to pursue organic growth and strategic acquisitions.
This document discusses SemGroup's non-GAAP financial measure of Adjusted EBITDA. It explains that Adjusted EBITDA excludes certain non-cash and other selected items in order to increase comparability between reporting periods. It also notes that SemGroup does not provide guidance for net income due to non-cash items that cannot be accurately forecasted. Additionally, the document contains forward-looking statements regarding SemGroup's prospects, financial performance, annual dividend growth, capital expenditures, and other matters.
- EnLink Midstream reported financial and operational results for the second quarter of 2017, delivering earnings and volume growth. Adjusted EBITDA was $209.7 million, up from $207.6 million in the previous quarter.
- Volume growth across their assets in key basins like the Permian Basin, Central Oklahoma and Louisiana was driven by ongoing drilling and completion activity from producers like Devon Energy.
- Rigs counts have remained consistent in EnLink's core basins, and existing well inventory is expected to support volume growth through 2017 to meet guidance targets.
The document discusses SemGroup's second quarter 2017 results and HFOTCO acquisition. Key points include:
- SemGroup completed its acquisition of HFOTCO in July 2017 for initial consideration of $1.5 billion including cash, debt assumption, and shares issued. A second $600 million cash payment is due by end of 2018.
- Base business performed as expected in Q2 2017. Several new pipeline projects were completed or are under construction to expand infrastructure.
- SemGroup is focused on funding the second HFOTCO payment through options like asset sales, partnerships, or equity offerings. Integration of HFOTCO is proceeding as planned.
Sem group investor presentation post 4Q and FY 2016 earnings finalSemGroupCorporation
This document discusses SemGroup's non-GAAP financial measure of Adjusted EBITDA and provides context around its use. It notes that Adjusted EBITDA excludes certain non-cash and other selected items in order to increase comparability between reporting periods. It also contains forward-looking statements regarding SemGroup's expectations for future financial performance and growth opportunities.
Sem group announces hfotco acquisition final presentationSemGroupCorporation
SemGroup acquired Houston Fuel Oil Terminal Company (HFOTCO) for $1.5 billion initially, with a second $600 million payment due by end of 2018. HFOTCO owns 330 acres and 16.8 million barrels of storage on the Houston Ship Channel with connections to major pipelines and refineries. The acquisition enhances SemGroup's scale and diversification with take-or-pay contracts from investment-grade customers. Growth projects are expected to increase HFOTCO's adjusted EBITDA to $180-190 million by 2019.
EnLink Midstream provides an overview of its business including its financial and operational highlights for 3Q 2016. Key points include refined 2016 Adjusted EBITDA guidance of $760-790 million, 3Q 2016 Adjusted EBITDA before non-controlling interest of ~$201 million, and distribution coverage ratios of 1.05x for ENLK and 1.07x for ENLC. EnLink also discusses its growth strategy, positioned across multiple basins and services, and commitment to financial strength with leverage of 3.75x debt to Adjusted EBITDA.
EnLink Midstream reported strong third quarter 2016 results, with adjusted EBITDA of approximately $201 million. Operations in the core growth areas of the STACK, SCOOP, and Cana Woodford in Oklahoma performed well, with volumes on recently acquired assets up 85% compared to the first quarter. Louisiana gas volumes were near record levels at 1.75 billion cubic feet per day. EnLink remains focused on executing its $6 billion growth program through expanding existing assets and strategic acquisitions.
Iron Mountain reported second quarter 2016 financial results. Total reported revenues increased compared to the prior year period, driven primarily by the acquisition of Recall which closed in May 2016. Operating income and net income declined due to costs associated with integrating Recall. Adjusted OIBDA increased reflecting the Recall acquisition and benefits from transformation initiatives. Storage and service revenue growth was in line with Iron Mountain's strategic plan targets. The company tightened full year Adjusted OIBDA guidance and updated FFO per share to reflect the impact of the Recall acquisition.
The document provides an operations report for February 14, 2017. It includes forward-looking statements about guidance, projections, and objectives that involve risks and uncertainties. It also discusses non-GAAP financial measures used by the company such as adjusted EBITDA and distributable cash flow. For 2016, the company delivered on its financial and operational priorities by outperforming its adjusted EBITDA guidance, meeting its capital expenditure targets, and achieving distribution coverage above 1.0x. ENLC also met its cash available for distribution guidance and distribution coverage targets for 2016.
The document is an investor presentation for Sunoco LP (SUN) that provides an overview of the company. It discusses SUN's recent acquisitions that have increased its scale and diversified its operations across 30 states. It also summarizes SUN's financial strategy of targeting long-term leverage of 4.0-4.5x and distribution coverage of ~1.1x to maintain investment grade ratings over time. Finally, it provides an operating update showing increased retail gallons sold in 1Q 2016 compared to the prior year.
This document provides an investor presentation for Crestwood Midstream Partners LP and Crestwood Equity Partners LP. It highlights the companies' focus on execution of their growth strategy, commitment to a strong balance sheet and disciplined capital program. Specific projects highlighted include expansion of the Nautilus system in the Delaware Basin, Arrow Debottlenecking phases 1 and 2 in the Bakken, and the Orla processing plant and pipeline. These projects are expected to provide significant incremental annual cash flow of over $120 million by 2021.
The document provides an overview of SemGroup's non-GAAP financial measure of Adjusted EBITDA. It explains that Adjusted EBITDA excludes certain non-cash and selected items in order to increase comparability between reporting periods and is used by management for internal analysis. However, readers should be aware that variations in operating results are also caused by numerous other factors not adjusted for. The document also contains forward-looking statements regarding SemGroup's strategic focus and expectations.
Celp investor presentation march 2017 finalCypressEnergy
Cypress Energy Partners provides pipeline inspection and integrity services as well as water and environmental services to midstream energy customers. Over 85% of its customers are investment grade companies. It inspects over 46,000 miles of pipelines annually using in-line inspection tools to identify anomalies, and performs over 12,000 excavations for further inspection or maintenance. Regulations require pipeline operators to inspect lines every 5-7 years, providing a recurring need for Cypress' inspection services over the 40-60 year lifespan of pipelines.
SemGroup held an earnings conference call on August 5, 2016 to discuss its second quarter 2016 results. The call began with forward-looking statements and information regarding SemGroup and Rose Rock Midstream's use of social media. SemGroup reported adjusted EBITDA of $67.6 million for the quarter, down from $77.7 million in the previous quarter. Rose Rock Midstream reported adjusted EBITDA of $44.9 million, down from $49 million in the first quarter of 2016. SemGroup and Rose Rock maintained strong liquidity with over $720 million and $514 million respectively available.
American Midstream Partners LP will merge with JP Energy Partners LP to form a larger diversified midstream company with a combined enterprise value of approximately $2 billion. The transaction will be executed through a unit-for-unit exchange where AMID will issue new units to JPEP unitholders at a 0.5775 exchange ratio. The merger is expected to deliver synergies of at least $10 million annually and provide benefits like increased scale, financial strength, and growth opportunities for the combined company. The transaction is anticipated to close in late 2016 or early 2017 pending required approvals.
EnLink Midstream provides a strong operations report for May 3, 2016. The report discusses solid execution of their 2016 plan including meeting guidance targets and stable cash flows. It highlights their premier positions in key basins with high growth demand and confidence in their business model with quality customers and contracts. Segment performance showed growth in the Oklahoma segment from the Tall Oak acquisition and continued growth in the Permian region through expanding infrastructure.
The document discusses Sunoco LP's acquisition of Energy Transfer Partners' remaining wholesale fuel distribution and retail assets. The $2.226 billion acquisition will make Sunoco LP one of the leading wholesale fuel and retail marketing platforms in the US with increased scale, diversity, and cash flows. The acquisition is expected to close in Q1 2016 and will be immediately accretive to Sunoco LP's distributable cash flows and distributions.
- The document provides EnLink Midstream's 3rd quarter 2017 operations report, which summarizes financial and operational results and reaffirms guidance.
- EnLink reported adjusted EBITDA at the high end of guidance for 3Q17, driven by strong volume growth. Organic projects are expected to generate significant cash flow going forward.
- Volumes on gas gathering and processing systems grew substantially in key areas like the Permian Basin and Louisiana year-over-year and quarter-over-quarter.
The document provides an overview of OUTFRONT Media's assets and business model as a REIT. It details the company's primary asset types which include billboards, digital displays, posters, and transit assets. It also summarizes the company's top market locations and timeline of becoming a publicly-traded REIT after its split from CBS Corporation in 2014.
EnLink Midstream is pursuing growth through four avenues: 1) dropdown acquisitions from sponsor Devon Energy, 2) expanding with Devon in key regions like the Anadarko Basin, 3) organic growth projects like expanding pipelines and plants, and 4) mergers and acquisitions. EnLink has a large portfolio of midstream assets across major basins in the US and a stable cash flow supported by long-term contracts, positioning it for sustainable growth through these avenues to potentially double in size by 2017.
1. The document reports on the operations and financial results of EnLink Midstream for February 2016. It highlights record adjusted EBITDA of $728 million for 2015 and distribution coverage ratios of around 1.0x and 1.2x.
2. EnLink Midstream executed on its strategy in 2015 by completing $4.5 billion in acquisitions, growth projects, and asset drop downs. This expanded its footprint in key resource plays like the STACK, Midland Basin, and Delaware Basin.
3. The company is well positioned for continued growth in 2016, with projections for increased gas processing volumes, crude/condensate volumes, and rigs operating on dedicated acreage compared to 2014 levels.
The document provides an overview of forward-looking statements and assumptions regarding Antero Midstream Partners LP and Antero Resources Corporation. It summarizes that any projections are based on certain assumptions and are subject to risks and uncertainties that could cause actual results to differ materially. Our ability to make future distributions is substantially dependent on Antero Resources' development plan, which itself depends on its board's annual approval of the capital budget considering expected commodity prices, contractual obligations, and capital resources at that time.
This document provides an investor presentation for SemGroup's second quarter 2017 results. It discusses SemGroup's non-GAAP financial measure of Adjusted EBITDA, noting that it excludes certain items to increase comparability between reporting periods. It also contains forward-looking statements regarding SemGroup's prospects, financial performance, annual dividend growth, and other matters. Finally, it outlines SemGroup's strategy of transforming into a diversified energy infrastructure company through acquisitions in the Gulf Coast, STACK play, and Duvernay/Montney regions to generate stable cash flows under contracts with investment-grade counterparties.
The document provides an operations report for August 3, 2016 that contains forward-looking statements and non-GAAP financial measures. It discusses key risks and uncertainties that could impact financial and operational results. It also contains disclaimers around the use of non-SEC compliant resource estimates and non-GAAP measures, urging investors to consider disclosures in SEC filings.
The document summarizes common injuries in track and field athletes. It discusses overuse injuries that occur during training like muscle strains, as well as acute injuries like stress fractures. It also covers potentially life-threatening issues like sudden cardiac death. The document includes photos of different track and field events and injuries related to sprinting, hurdles, long distance running, jumping events and throwing events. It discusses treatments and prevention of track and field injuries.
EnLink Midstream / Tall Oak Midstream Acquisition Investor CallEnLinkMidstreamLLC
Tall Oak Midstream is acquiring assets in Oklahoma that will expand EnLink Midstream's presence in the core of the STACK and CNOW plays. The acquisition aligns with Devon Energy, who will be the largest customer on the system. It provides EnLink with long-term, fee-based contracts averaging 15 years. The financing structure is expected to be accretive to EnLink's distributions and maintain its investment grade credit rating. The transaction strengthens the relationship between EnLink and Devon while diversifying their businesses and further aligning their growth plans.
The document summarizes EnLink's operations report for August 2016. Key points include:
- EnLink revised 2016 guidance, increased adjusted EBITDA to $750-800 million.
- Q2 2016 results showed adjusted EBITDA of $187.4 million and cash available for distribution of $49.8 million.
- EnLink continues focus on core strategies of maximizing cash flows, executing growth projects, and providing best-in-basin service.
- The document provides EnLink Midstream's 3rd quarter 2017 operations report, which summarizes financial and operational results and reaffirms guidance.
- EnLink reported adjusted EBITDA at the high end of guidance for 3Q17, driven by strong volume growth. Organic projects are expected to generate significant cash flow going forward.
- Volumes on gas gathering and processing systems grew substantially in key areas like the Permian Basin and Louisiana year-over-year and quarter-over-quarter.
This document provides guidance for EnLink Midstream's 2018 financial and operational performance. It begins with forward-looking statements and risk factors that could impact projections. The guidance projects adjusted EBITDA, distributable cash flow, debt levels, distribution coverage, capital expenditures, and segment profit. Non-GAAP terms are defined, including adjusted EBITDA and distributable cash flow.
EnLink Midstream reported strong operational and financial results for 4Q and full-year 2017. The company exceeded its guidance targets for the year, including net income, adjusted EBITDA, distribution coverage, and leverage ratio. Operationally, the company increased volumes across its systems, with significant growth in the Delaware Basin and on its Oklahoma and Midland Basin assets. Looking ahead, EnLink is well positioned for continued growth due to rig activity by producer customers outpacing broader market trends and an inventory of opportunities across its asset portfolio.
The operations report discusses first quarter 2017 execution across EnLink's asset portfolio. Key highlights include expansion projects in Central Oklahoma bringing total processing capacity to nearly 1 Bcf/d by year-end. In the Delaware Basin, the Lobo system is expanding its capacity to 185 MMcf/d. The Ascension pipeline began operations in Louisiana. In the Midland Basin, the Chickadee crude oil gathering system became operational. Overall, EnLink continues focused execution across its integrated asset base.
- The document provides an operations report for the first quarter of 2018, including forward-looking statements about projected financial and operational results that are subject to risks and uncertainties.
- It defines several non-GAAP financial measures used in the report such as gross operating margin, adjusted EBITDA, distributable cash flow, and cash available for distribution.
- Other terms are also defined such as growth capital expenditures, maintenance capital expenditures, segment profit, debt to adjusted EBITDA ratio, and minimum volume commitments.
This document provides an overview of JP Morgan's Energy Oklahoma City SCOOP/STACK & Houston Bus Tour on May 17, 2016. It includes forward-looking statements about future financial and operating results with various risk factors that could impact projections. It also contains non-GAAP financial measures and definitions. The presentation shows stable financial results for ENLK in Q1 2016 with adjusted EBITDA of $195 million, distribution coverage of 1.09x, and leverage of 3.8x debt to EBITDA. It highlights EnLink's premier positions in top U.S. oil and gas basins as well as its focus on execution and stability.
The document discusses Morgan Stanley's MLP Bus Tour and provides an overview of EnLink Midstream. It notes that EnLink has stable cash flows from long-term fee-based contracts, including a significant portion from its sponsor Devon Energy. It is focused on executing in its core areas of Oklahoma, Permian Basin, and Louisiana. EnLink has a strong financial position as an investment grade company with a $1.5 billion credit facility and high-quality customers.
The document discusses EnLink Midstream Partners, LP, a master limited partnership focused on midstream energy services. It notes that EnLink has a stable cash flow due to 95% of contracts being fee-based and 50% from long-term Devon contracts. It also highlights EnLink's organic growth strategy through expansion projects in regions like South Louisiana, West Texas, and Ohio River Valley. Finally, it identifies four avenues for future growth: dropdowns from sponsor Devon Energy, organic expansion projects, third-party acquisitions, and potential new basin development with Devon.
This document provides an overview of J.P. Morgan's 4th Annual Infrastructure/MLP 1x1 Forum on May 14, 2015. It begins with forward-looking statements and discussions of risks and uncertainties. It then discusses EnLink Midstream Partners, LP and EnLink Midstream, LLC, including their assets, growth strategies, and financial position. Key aspects include a stable cash flow supported by long-term contracts, organic growth opportunities through Devon Energy's upstream portfolio, and potential for significant growth from future dropdown transactions from Devon. The document outlines four avenues for doubling the size of EnLink by 2017, including dropdowns, growing with Devon, organic projects, and mergers and acquisitions.
EnLink Midstream provides midstream energy services and is focused on four avenues of growth: drop downs from sponsor Devon Energy, growing with Devon's development plans, organic expansion projects, and mergers and acquisitions. EnLink recently completed over $4 billion of projects and acquisitions to expand its presence in the Permian Basin, Eagle Ford, South Louisiana, and Ohio River Valley regions. It has a stable cash flow profile supported by long-term fee-based contracts with Devon and other customers.
EnLink Midstream provides midstream energy services and is focused on growing through four avenues: dropdowns from sponsor Devon Energy, growing with Devon in key regions, organic expansion projects, and mergers and acquisitions. EnLink recently completed over $4 billion of growth projects and acquisitions to expand its presence in the Permian Basin, Eagle Ford, South Louisiana, and Ohio River Valley. It aims to continue growing its integrated midstream systems and leveraging its relationship with Devon Energy.
EnLink Midstream provides midstream energy services focused on natural gas gathering, processing, transportation and NGL fractionation. Over 95% of its cash flows are fee-based and supported by long-term contracts, providing revenue stability. Its largest customer is Devon Energy, which accounts for over 50% of adjusted EBITDA. EnLink aims to leverage its relationship with Devon to grow its business through potential future asset dropdowns and expanding services for Devon's growing E&P operations.
EnLink Midstream held its 20th Annual Energy Summit on February 23-24, 2015. The presentation discusses EnLink's strategy of providing stable cash flows through long-term fee-based contracts while also pursuing growth opportunities. It highlights four avenues for growth: drop downs from Devon Energy, growing with Devon's production in key areas, organic expansion projects, and mergers and acquisitions. Recent progress includes completing drop downs and announcing expansion projects in various regions for over $2.5 billion in total capital commitments. Guidance forecasts continued stability and distribution growth through 2015.
This document provides an overview of EnLink Midstream's 2015 Analyst & Investor Day. It begins with forward-looking statements and disclosures about non-GAAP financial measures used. The agenda outlines presentations on EnLink Midstream's vision and strategy, its sponsorship with Devon Energy, and its natural gas and liquids businesses. The management team is introduced, consisting of experienced leaders from Crosstex Energy and Devon. The document emphasizes EnLink Midstream's growth strategy through organic expansion projects and dropdown acquisitions from Devon, as well as its stable cash flows, investment grade credit rating, and focus on safely serving customers.
EnLink Midstream held an analyst and investor day on March 30, 2015 to discuss its vision and strategy. The presentation included forward-looking statements and defined non-GAAP financial measures. It also noted that the SEC prohibits the disclosure of certain resource estimates. The agenda included presentations from EnLink Midstream and Devon Energy executives on the companies' visions and the natural gas and liquids businesses. The management team was introduced, which includes experienced leaders from Crosstex Energy and Devon. EnLink Midstream aims to execute its growth strategy through a diversified portfolio, organic expansion projects, and dropdowns from Devon Energy.
EnLink Midstream provides an investor presentation outlining its strategy of stable cash flows through long-term fee-based contracts combined with organic growth and dropdown acquisitions from sponsor Devon Energy. The presentation highlights EnLink's recent $4.2 billion of growth projects across multiple regions, executed using cash from operations without additional debt. It identifies four avenues of future growth: additional dropdowns from Devon, expanding with Devon's development plans, organic expansion projects, and mergers and acquisitions.
EnLink Midstream Partners, LP presented its investor presentation for March 2-4, 2015. The presentation discusses EnLink's strategy of providing stable cash flows through long-term fee-based contracts while pursuing growth opportunities through dropdown acquisitions from sponsor Devon Energy and organic expansion projects. The presentation provides 2015 guidance including adjusted EBITDA of $740 million and outlines EnLink's four avenues for growth: dropdowns from Devon, growing with Devon's production, organic expansion projects, and mergers and acquisitions. Recent progress includes completing the E2 dropdown and announcing expansion projects in West Texas, Ohio River Valley, and a joint venture project in Louisiana.
This document discusses Goldman Sachs' Power, Utilities, MLP & Pipeline Conference in August 2015. It contains forward-looking statements about EnLink Midstream's future financial and operating results that involve risks and uncertainties. It also discusses non-GAAP financial measures used by EnLink Midstream like gross operating margin and segment cash flow. The document outlines EnLink Midstream's strategy of focusing on stability through long-term contracts and organic growth opportunities.
Similar to En link midstream jefferies presentation nov 29 16 (20)
World economy charts case study presented by a Big 4
World economy charts case
World economy charts case study presented by a Big 4
World economy charts case study presented by a Big 4World economy charts case study presented by a Big 4
World economy charts case study presented by a Big 4
World economy charts case study presented by a Big 4World economy charts case study presented by a Big 4World economy charts case study presented by a Big 4World economy charts case study presented by a Big 4World economy charts case study presented by a Big 4World economy charts case study presented by a Big 4World economy charts case study presented by a Big 4World economy charts case study presented by a Big 4World economy charts case study presented by a Big 4World economy charts case study presented by a Big 4World economy charts case study presented by a Big 4World economy charts case study presented by a Big 4World economy charts case study presented by a Big 4World economy charts case study presented by a Big 4study presented by a Big 4
Methanex is the world's largest producer and supplier of methanol. We create value through our leadership in the global production, marketing and delivery of methanol to customers. View our latest Investor Presentation for more details.
ZKsync airdrop of 3.6 billion ZK tokens is scheduled by ZKsync for next week.pdfSOFTTECHHUB
The world of blockchain and decentralized technologies is about to witness a groundbreaking event. ZKsync, the pioneering Ethereum Layer 2 network, has announced the highly anticipated airdrop of its native token, ZK. This move marks a significant milestone in the protocol's journey, empowering the community to take the reins and shape the future of this revolutionary ecosystem.
UnityNet World Environment Day Abraham Project 2024 Press ReleaseLHelferty
June 12, 2024 UnityNet International (#UNI) World Environment Day Abraham Project 2024 Press Release from Markham / Mississauga, Ontario in the, Greater Tkaronto Bioregion, Canada in the North American Great Lakes Watersheds of North America (Turtle Island).
Cleades Robinson, a respected leader in Philadelphia's police force, is known for his diplomatic and tactful approach, fostering a strong community rapport.
The E-Way Bill revolutionizes logistics by digitizing the documentation of goods transport, ensuring transparency, tax compliance, and streamlined processes. This mandatory, electronic system reduces delays, enhances accountability, and combats tax evasion, benefiting businesses and authorities alike. Embrace the E-Way Bill for efficient, reliable transportation operations.
2. 2
Investor Notice
This presentation contains forward-looking statements within the meaning of the federal securities laws. Although these statements reflect the current views,
assumptions and expectations of our management, the matters addressed herein involve certain assumptions, risks and uncertainties that could cause actual
activities, performance, outcomes and results to differ materially than those indicated herein. Such forward-looking statements include, but are not limited to,
statements about guidance, projected or forecasted financial and operating results, operational results of our customers, results in certain basins, future rig
count information, objectives, project timing, expectations and intentions and other statements that are not historical facts. Factors that could result in such
differences or otherwise materially affect our financial condition, results of operations and cash flows include, without limitation, (a) the dependence on Devon
for a substantial portion of the natural gas that we gather, process and transport, (b) developments that materially and adversely affect Devon or our other
customers, (c) adverse developments in the midstream business may reduce our ability to make distributions, (d) our vulnerability to having a significant
portion of our operations concentrated in the Barnett Shale, (e) the amount of hydrocarbons transported in our gathering and transmission lines and the level
of our processing and fractionation operations, (f) impairments to goodwill, long-lived assets and equity method investments, (g) our ability to balance our
purchases and sales, (h) fluctuations in oil, natural gas and NGL prices, (i) construction risks in our major development projects, (j) reductions in our credit
ratings, (k) our debt levels and restrictions contained in our debt documents, (l) our ability to consummate future acquisitions, successfully integrate any
acquired businesses, realize any cost savings and other synergies from any acquisition, (m) changes in the availability and cost of capital, (n) competitive
conditions in our industry and their impact on our ability to connect hydrocarbon supplies to our assets, (o) operating hazards, natural disasters, weather-
related delays, casualty losses and other matters beyond our control, (p) a failure in our computing systems or a cyber-attack on our systems, and (q) the
effects of existing and future laws and governmental regulations, including environmental and climate change requirements and other uncertainties. These
and other applicable uncertainties, factors and risks are described more fully in EnLink Midstream Partners, LP’s and EnLink Midstream, LLC’s filings
(collectively, “EnLink Midstream”) with the Securities and Exchange Commission, including EnLink Midstream Partners, LP’s and EnLink Midstream, LLC’s
Annual Reports on Form 10-K, Quarterly Reports on Form 10-Q and Current Reports on Form 8-K. Neither EnLink Midstream Partners, LP nor EnLink
Midstream, LLC assumes any obligation to update any forward-looking statements.
The assumptions and estimates underlying the forecasted financial information included in the guidance information in this presentation are inherently
uncertain and, though considered reasonable by the EnLink Midstream management team as of the date of its preparation, are subject to a wide variety of
significant business, economic, and competitive risks and uncertainties that could cause actual results to differ materially from those contained in the
forecasted financial information. Accordingly, there can be no assurance that the forecasted results are indicative of EnLink Midstream’s future performance or
that actual results will not differ materially from those presented in the forecasted financial information. Inclusion of the forecasted financial information in this
presentation should not be regarded as a representation by any person that the results contained in the forecasted financial information will be achieved.
The United States Securities and Exchange Commission permits oil and gas companies, in their filings with the SEC, to disclose only proved, probable and
possible reserves that meet the SEC's definitions for such terms, and price and cost sensitivities for such reserves, and prohibits disclosure of resources that
do not constitute such reserves. This presentation may contain certain terms, risked or unrisked resource, potential locations, risked or unrisked locations,
exploration target size and other similar terms. These estimates are by their nature more speculative than estimates of proved, probable and possible
reserves and accordingly are subject to substantially greater risk of being actually realized. The SEC guidelines strictly prohibit us from including these
estimates in filings with the SEC. Investors are urged to consider closely the disclosure in Devon Energy Corporation’s Form 10‐K, available at Devon Energy
Corporation, Attn. Investor Relations, 333 West Sheridan, Oklahoma City, OK 73102‐5015. You can also obtain this form from the SEC by calling
1‐800‐SEC‐0330 or from the SEC’s website at www.sec.gov.
3. 3
Non-GAAP Financial Information
This presentation contains non-generally accepted accounting principle financial measures that we refer to as gross operating margin, adjusted EBITDA,
distributable cash flow, and ENLC cash available for distribution. Gross operating margin is defined as revenue less the cost of sales. Adjusted EBITDA is
defined as net income (loss) plus interest expense, provision for income taxes, depreciation and amortization expense, impairment expense, unit-based
compensation, (gain) loss on non-cash derivatives, (gain) loss on disposition of assets, successful transaction costs, accretion expense associated with asset
retirement obligations, reimbursed employee costs, non-cash rent and distributions from unconsolidated affiliate investments less payments under onerous
performance obligation, non-controlling interest, transferred interest adjusted EBITDA, and (income) loss from unconsolidated affiliate
investments. Distributable cash flow is defined as adjusted EBITDA (as defined above), net to the Partnership, less interest expense (excluding amortization of
the Tall Oak acquisition installment payable discount), adjustments for the mandatorily redeemable non-controlling interest, interest rate swaps, cash taxes and
other, and maintenance capital expenditures. Growth capital expenditures generally include capital expenditures made for acquisitions or capital improvements
that we expect will increase our asset base, operating income or operating capacity over the long-term. Maintenance capital expenditures are capital
expenditures made to replace partially or fully depreciated assets in order to maintain the existing operating capacity of the assets and to extend their useful
lives. ENLC’s cash available for distribution is defined as net income (loss) of ENLC less the net income (loss) of ENLK, which is consolidated into ENLC’s net
income (loss), plus ENLC’s (i) share of distributions from ENLK, (ii) share of EnLink Oklahoma Gas Processing, LP’s (together with its subsidiaries, “EnLink
Oklahoma T.O.”) depreciation expense, (iii) deferred income tax expense, (iv) interest in the adjusted EBITDA of Midstream Holdings prior to the EMH drop
downs (v) corporate goodwill impairment, and (vi) acquisition transaction costs attributable to its share of the EnLink Oklahoma T.O. acquisition, and less
ENLC’s interest in maintenance capital expenditures of Midstream Holdings prior to the EMH drop downs.
Adjusted EBITDA of EnLink Oklahoma T.O. is defined as EnLink Oklahoma T.O.’s net income plus depreciation and amortization. Adjusted EBITDA of
Midstream Holdings is defined as Midstream Holdings’ net income plus taxes, depreciation and amortization, and distributions from unconsolidated affiliate
investments, less income from non-consolidated affiliate investments.
EnLink Midstream believes these measures are useful to investors because they may provide users of this financial information with meaningful comparisons
between current results and prior-reported results and a meaningful measure of EnLink Midstream's cash flow after satisfaction of the capital and related
requirements of their respective operations. Adjusted EBITDA achievement is a primary metric used in ELNK’s credit facility and short-term incentive program
for compensating its employees.
Adjusted EBITDA, gross operating margin, distributable cash flow, and ENLC cash available for distribution, as defined above, are not measures of financial
performance or liquidity under GAAP. They should not be considered in isolation or as an indicator of EnLink Midstream’s performance. Furthermore, they
should not be seen as a substitute for metrics prepared in accordance with GAAP. Reconciliations of these measures to their most directly comparable GAAP
measures for the periods that are presented in this presentation are included the Appendix to this presentation. See ENLK’s and ENLC’s filings with the SEC
for more information.
EnLink Midstream does not provide GAAP financial measures, including reconciliations, on a forward-looking basis because the companies are unable to
predict with reasonable certainty impairments, depreciation and amortization, gains and losses on derivative activities, the ultimate outcome of legal
proceedings, unusual gains and losses and acquisition-related expenses without unreasonable effort. These items are uncertain, depend on various factors,
and could be material to EnLink Midstream's results computed in accordance with GAAP.
4. 3rd Quarter 2016 Highlights
Performance & momentum; determined to deliver
Financial Highlights
o Refined Consolidated Adjusted EBITDA 2016 guidance to $760–790MM, from $750–800MM
o Achieved ENLK milestone 3Q16 Adjusted EBITDA before non-controlling interest of ~$201MM
o ~3.75x Debt to Adjusted EBITDA, as defined by ENLK credit facility
o Distribution Coverage of 1.05x at ENLK1 and 1.07x at ENLC2, for the nine months ended 9/30/16
Operational Highlights
o Significant increase in Central Oklahoma, with volumes on the recently acquired assets up 85% in 3Q16
as compared 1Q16
o Integrated gathering, processing & transportation system in Oklahoma servicing the STACK, SCOOP, &
Cana Woodford
o Louisiana gas volumes of ~1.75 Bbtu/d (3Q16); represents near-record results for two consecutive
quarters
Execution of the Plan
o Producer rig plans support the core growth strategy in STACK, SCOOP, & Cana Woodford
o Expanding processing capacity at Chisholm in Central Oklahoma and at Lobo in the Delaware Basin
o Expanding crude services in Midland Basin, with construction of the Chickadee Gathering System
o Expanding NGL services in Louisiana with construction of the Ascension Pipeline
1 ENLK’s distribution coverage is defined as ENLK’s Distributable Cash Flow divided by ENLK’s total distributions declared.
2 ENLC’s distribution coverage is defined as ENLC’s Cash Available for Distribution divided by ENLC’s total distributions declared.
Adjusted EBITDA, ENLK’s Distributable Cash Flow, and ENLC’s Cash Available for Distribution are non-GAAP financial measures, which are explained on page 3 and are included in
reconciliations in the Appendix. 4
5. Positioned for Ongoing Success
Intentional business model, confident in growth
• Provide integrated midstream solutions across products, basins & services
• Grow and expand our strategic asset position in top basins
• Exit 2016 with strength and confidence, momentum growing into 2017+
• Strong producer sponsor in Devon; quality partners across our business
• ~95% fee-based gross operating margin1; ~75% of gross operating
margin in Texas & Oklahoma segments backed by MVCs or firm
contracts1
• ~90% of top 50 customers hold investment-grade credit ratings2
• Financial Tenets: (1) Remain Investment Grade; (2) Target Debt/Adj.
EBITDA of 3.0x - 4.0x3; (3) Target annual distribution coverage of at least
1.1x at ENLK and ENLC4
• ENLK – Investment Grade MLP with ~$1.4B of credit facility liquidity5
• ENLC – Liquidity of ~$225MM under credit facility5
TBD
TBD
TBD
EXECUTION
of the plan
PROVEN
business model
STRONG
financial position
1 For the nine months ended 9/30/2016. 2 Credit rating is defined by internal or external metrics. 3 As defined by the credit facility. 4 Distribution coverage is defined as distributable cash
flow divided by total distributions made. 5 As of 9/30/2016.
Adjusted EBITDA and gross operating margin are non-GAAP financial measures, which are explained on page 3.
5
6. Our Proven Business Model
Demonstrating stability & growth in the downturn
Balance sheet and distribution stability, while purposefully executing EnLink’s $6B growth program
3.7x
3.7x
3.8x
4.0x
3.8x
3.9x
3.75x
0.88x
1.05x
1.05x
1.05x
1.09x
1.03x
1.04x
$0.38
$0.385
$0.39
$0.39
$0.39
$0.39
$0.39
1Q15 2Q15 3Q15 4Q15 1Q16 2Q16 3Q16
ENLK Leverage (x) ENLK Coverage (x)
ENLK Distribution ($/unit)
15
40
65
90
Jan-15 Apr-15 Jul-15 Oct-15 Jan-16 Apr-16 Jul-16
Crude oil index
Note: Crude oil index represents daily WTI Crude Oil prices beginning 1/1/2015. Leverage as defined in the ENLK Credit Agreement. Distribution coverage is defined as Distributable Cash
Flow divided by total distributions declared. ENLK’s Distributable Cash Flow is a non-GAAP financial measure, which is explained on page 3 and is included in reconciliations in the
Appendix.
• EnLink performed well through
the commodity cycle and
volatility
• Leverage: Focus on balance
sheet strength and
investment-grade rating has
resulted in strong position
• Coverage: Strong distribution
coverage maintained to
support financial position
• Distributions are prudently
managed to ensure strong
financial position; committed to
long-term distribution growth
EnLink Model
6
7. TBD
Strategic Investing in Volatile Environment
Remaining active & focused on strategic growth
Note: Amounts are approximate and represent press release announcements at closing. Oil price index represents indexed value for WTI crude oil. Indexed to starting date of 6/6/2014
0
20
40
60
80
100
Jun-14 Sep-14 Dec-14 Mar-15 Jun-15 Sep-15 Dec-15 Mar-16 Jun-16 Sep-16
Oil price index
1/31/15
LPC
Permian
Basin
acquisition;
$100MM
3/16/2015
Coronado
Midstream
Midland Basin
acquisition;
$600MM
4/1/15
Victoria Express
Pipeline Drop
Down (VEX)
from Devon;
$215MM
5/27/15
Acquired
remaining 25%
interest in
EnLink
Midstream
Holdings;
$900MM
10/1/15
Delaware Basin
midstream asset
acquisition from
Matador;
$143MM
11/16/2015
Acquisition of
remaining
50% interest
in Deadwood;
$40MM
1/7/2016
Acquisition of Tall
Oak midstream
assets in
STACK/SCOOP;
$1.55B
6/8/2016
Announced Greater
Chickadee crude
oil gathering project
in the Midland
Basin; $70-80MM
Intentional execution of $6B in strategic growth despite the challenging environment
8/1/2016
Announced Delaware
Basin Joint Venture
with NGP; $525MM
remaining capital
commitment as of
9/30/16
2/17/15
Acquired
25% interest
in EnLink
Midstream
Holdings;
$925MM
Midland Basin
Delaware Basin
SCOOP/STACK
Midland & Delaware
Dropdowns
11/3/14
Acquired
Chevron Gulf
Coast Natural
Gas Pipeline
Assets; $235MM
Louisiana
7
8. The Right Asset Platform
Integrated across products, basins, & services
Note: Assets above include those with partial ownership.
4.4 Bcf/d
Processing capacity
21
Processing Facilities
7
Fractionators
260 Mbbl/d
Fractionation capacity
~11k Miles
of Pipeline
~1,450 Employees
Operating assets in 7 states
130 Mbbl/d
NGL pipeline capacity
8
9. Our Growth Basins
Rig activity today: significant momentum into 2017
Central Oklahoma
Dedicated Rig Count
1 Based on August 2016 EnLink Operations Report. 2 As of October 31, 2016 according to Drilling Info. 3 As reported in the November 1, 2016 EnLink Operations Report.
7
rigs
Aug
‘161
Oct
‘162
FYE
‘163
11
rigs
10-12
rigs
Aug
‘161
FYE
‘163
10-12
rigs
10
rigs
Oct
‘162
1
rig
2
rigs
2
rigs
Aug
‘161
FYE
‘163
Oct
‘162
10
rigs
Midland Basin
Dedicated Rig Count
Delaware Basin
Dedicated Rig Count
Growth Basin Rig
Overview
• Strong rig activity across our key growth
basins
• 22 operating rigs on our dedicated acreage in
Central Oklahoma, Midland Basin and
Delaware Basin at the end of October 2016
• Expectation of up to 26 rigs operating by
year-end 2016, carrying significant
momentum into 2017
9
10. A
B
C
D
Projects in Our Core Growth Areas
Extensive program of capital-efficient projects due to
strong activity in strategic footprint
Midland Basin
Chickadee Crude Oil Gathering: ~$90MM
• 3 rigs on Chickadee dedicated acreage
• Expanded scope for increased customers, volume &
acreage
• Expected operational date 1Q17
Delaware Basin
Lobo II Plant & Gathering Expansion: ~$150MM (100%)
• Joint Venture with NGP
• Incremental 120 MMcf/d, initially 60 MMcf/d
processing capacity operational as of late October
• Pipeline and additional infrastructure expected
operational by year end
Central Oklahoma
Chisholm II Plant & Gathering Expansion: ~$155MM
• Incremental 200 MMcf/d processing
• Brings total Central OK processing capacity to 795
MMcf/d
• Expected operational date 1H17
Louisiana
Ascension Pipeline Project: ~$85MM (100%)
• Joint Venture with Marathon
• 50,000 Bbl/d liquids pipeline
• Expected operational date 2Q17
155
150
90
85
480
Expected 2016-17 Capital Related to
Current Projects (~$MM)
Note: The Lobo II facilities and the Ascension Pipeline are not 100% owned by EnLink; information on this page is gross, not net to EnLink. As reported in the November 1, 2016 EnLink
Operations Report.
B
C
D
A
10
11. Near-Term Potential
Ascension pipeline in
operations, expected 2Q17
Latent capacity with annual
gross operating margin1 benefit:
$15-20MM: Gas business
$10-20MM: NGL business
Incremental contribution from
newly implemented:
Gas storage services
LPG exports
Increased market share of
existing and new demand
Accomplishments to Date
Expanded market presence:
Cajun Sibon completion
Chevron asset acquisition
Initiated:
Gas storage services
LPG exports
Diversified, improved supply
acquisition
Served incremental demand
markets:
LNG
Industrial
Power
Prospective in 2018 and Beyond
Synergies with Central OK
growth:
NGL expansion
Crude transportation
potential
Demand pull rising impact:
Gas to liquid conversion
opportunities
Latent capacity in franchise
position to serve increased
demand with minimal capital
LNG service opportunities
A B C
2016
A B C
2017
Significant demand markets on the verge of industrial, power, and LNG expansion
Louisiana: Leverage to the Upside
Execution of the plan - inventory of opportunities
2018+
1Gross operating margin is a non-GAAP financial measure, which is explained on page 3. Future information on this page is for illustrative purposes only.
11
12. Reconciliation of Net Cash Provided by
Operating Activities to Adjusted EBITDA
and Distributable Cash Flow of ENLK
12
(1) Net of amortization of debt issuance costs, discount and premium, and valuation adjustment for mandatorily redeemable non-controlling interest included in interest expense but not included in net cash provided
by operating activities.
(2) Distributions for the three months ended September 30, 2016 do not include $32.7 million of distributions received from Howard Energy Partners (HEP) during the third quarter 2016 attributable to the redemption
of preferred units. The preferred units were issued to us by HEP during the second and third quarters of 2016 for a contribution of $29.5 million and $3.2 million, respectively.
(3) Includes the following: reimbursed employee costs from Devon and LPC, which are costs reimbursed to us by previous employer pursuant to acquisition or merger; and successful acquisition transaction costs
which we do not consider in determining adjusted EBITDA because operating cash flows are not used to fund such costs. Net of payments under onerous performance obligation offset to other current and long-
term liabilities.
(4) Net of payments under onerous performance obligation offset to other current and long-term liabilities.
(5) Non-controlling interest share of adjusted EBITDA includes ENLC’s ~16% share of adjusted EBITDA from EnLink Oklahoma T.O., NGP’s 49.9% share of adjusted EBITDA from the Delaware Basin JV and the
minor NCI share of adjusted EBITDA from the E2 entities.
(6) Represents recast adjusted EBITDA from assets acquired from ENLC and Devon in drop down transactions during the first half of 2015 for the period prior to the date of the drop down transactions.
(7) Amortization of the Tall Oak installment payable discount is considered non-cash interest under our credit facility since the payment under the payable is consideration for the acquisition of the Tall Oak assets.
(8) During the second quarter of 2015 and third quarter of 2016, we entered into interest rate swap arrangements to mitigate our exposure to interest rate movements prior to our note issuances. The gain on
settlement of the interest rate swaps was considered excess proceeds for the note issuance and is therefore excluded from distributable cash flow.
All amounts in millions except ratios and per unit amount
1Q15 2Q15 3Q15 4Q15 1Q16 2Q16 3Q16
Net cash provided by operating activities 171.7$ 120.6$ 215.7$ 137.6$ 189.1$ 110.5$ 209.6$
Interest expense, net (1) 21.7 23.0 28.8 30.5 31.4 32.8 34.5
Current income tax 1.2 0.7 1.0 0.2 1.0 (2.0) 2.6
Distributions from unconsolidated affiliate investments in excess of earnings (2) 4.1 4.8 5.4 6.8 9.2 5.6 4.1
Other (3) 6.9 1.9 1.8 0.3 4.5 0.9 1.0
Changes in operating assets and liabilities which used (provided) cash:
Accounts receivable, accrued revenues, inventories and other (102.5) 61.5 (66.9) (95.7) (46.9) 61.3 (0.2)
Accounts payable, accrued gas and crude oil purchases and other (4) 67.1 (22.1) 1.2 107.4 7.5 (19.6) (50.8)
Adjusted EBITDA before non-controlling interest 170.2$ 190.4$ 187.0$ 187.1$ 195.8$ 189.5$ 200.8$
Non-controlling interest share of adjusted EBITDA (5) (0.1) 0.1 0.3 0.1 (0.8) (2.1) (3.3)
Transferred interest adjusted EBITDA (6) (40.2) (15.6) - (1.1) - - -
Adjusted EBITDA, net to EnLink Midstream Partners, LP 129.9$ 174.9$ 187.3$ 186.1$ 195.0$ 187.4$ 197.5$
Interest expense (18.9) (22.4) (30.2) (31.0) (43.7) (46.2) (48.0)
Amortization of Tall Oak installment payable discount included in interest expense (7) - - - - 12.4 13.3 13.3
Non-cash adjustment for mandatorily redeemable non-controlling interest (2.6) (0.7) 1.3 0.3 0.2 0.1 -
Interest Rate Swap (8) - (3.6) - - - - 0.4
Cash taxes and other (0.8) (0.6) (1.0) (0.3) (1.0) 2.0 (2.6)
Maintenance capital expenditured (8.9) (13.5) (9.6) (6.3) (7.5) (5.7) (6.2)
Distributable cash flow 98.7$ 134.1$ 147.8$ 148.8$ 155.4$ 150.9$ 154.4$
13. Reconciliation of Net Income of ENLC to
ENLC Cash Available for Distribution
13
(1) Represents quarterly distributions to be paid to ENLC by ENLK on November 11, 2016, and distributions paid to ENLC by ENLK on August 11, 2016, May 12, 2016, February 11, 2016, November 12, 2015,
August 13, 2015 and May 1, 2015.
(2) Represents ENLC’s stand-alone deferred taxes.
(3) There are no maintenance capital expenditures attributable to ENLC’s share of EnLink Oklahoma T.O. during 2016. All of EnLink Oklahoma T.O. capital expenditures during 2016 are growth related which are not
considered in determining cash flow available for distribution. The amounts represent ENLC’s interest in maintenance capital expenditures of EnLink Midstream Holdings, LP (“Midstream Holdings) prior to the drop
down transactions for ENLC’s Midstream Holdings’ interest to ENLK (“EMH Drop Downs”), which is netted against the monthly disbursement of Midstream Holdings' adjusted EBITDA.
(4) Represents ENLC’s interest in the adjusted EBITDA of Midstream Holdings prior to the EMH Drop Downs. Adjusted EBITDA of Midstream Holdings’ is defined as maintenance capital expenditures prior to the
EMH Drop Downs netted against the monthly disbursement of Midstream Holdings’ adjusted EBITDA.
(5) Represents acquisition transaction costs attributable to ENLC’s ~16% interest in EnLink Oklahoma T.O. and other non-cash items not included in cash available for distributions.
All amounts in millions except ratios and per unit amount
1Q15 2Q15 3Q15 4Q15 1Q16 2Q16 3Q16
Net income (loss) of ENLC 25.0$ 44.6$ (755.9)$ (723.4)$ (871.3)$ 1.2$ 11.1$
Less: Net income (loss) attributable to ENLK 35.6 55.5 (754.9) (714.0) (560.4) 5.0 18.8
Net loss of ENLC excluding ENLK (10.6)$ (10.9)$ (1.0)$ (9.4)$ (310.9)$ (3.8)$ (7.7)$
ENLC's share of distributions from ENLK (1) 21.7 36.2 47.6 48.9 48.9 49.2 49.4
ENLC's interest in EnLink Oklahoma T.O. depreciation - - - - 3.2 3.6 3.6
ENLC deferred income tax (benefit) expense (2) 5.4 12.4 0.5 7.9 (0.8) 0.5 5.0
Maintenance capital expenditures (3) (2.5) (1.6) - - - - -
Transferred interest EBITDA (4) 38.3 15.6 - - - - -
ENLC corporate goodwill impairment - - - - 307.0 - -
Other items (5) (0.2) 0.3 0.4 0.4 1.0 0.3 0.8
ENLC cash available for distribution 52.1$ 52.0$ 47.5$ 47.8$ 48.4$ 49.8$ 51.1$
14. Reconciliation of Net Income to
Adjusted EBITDA of ENLK
14
(1) Distributions for the three ended September 30, 2016 do not include $32.7 million of distributions received from HEP during the third quarter of 2016 attributable to the redemption of preferred units. The preferred
units were issued to us by HEP during the second and third quarters of 2016 for a contribution of $29.5 million and $3.2 million, respectively.
(2) Includes the following: accretion expense associated with asset retirement obligations; reimbursed employee costs from Devon and LPC, which are costs reimbursed to us by previous employer pursuant to
acquisition or merger; successful acquisition transaction costs which we do not consider in determining adjusted EBITDA because operating cash flows are not used to fund such costs; and non-cash rent which
relates to lease incentives pro-rated over the lease term.
(3) Non-controlling interest share of adjusted EBITDA includes ENLC’s ~16% share of adjusted EBITDA from EnLink Oklahoma T.O., NGP’s 49.9% share of adjusted EBITDA from the Delaware Basin JV and the
minor NCI share of adjusted EBITDA from the E2 entities.
(4) Represents recast adjusted EBITDA from assets acquired from ENLC and Devon in drop down transactions during the first half of 2015 for the period prior to the date of the drop down transactions.
All amounts in millions except ratios and per unit amount
1Q15 2Q15 3Q15 4Q15 1Q16 2Q16 3Q16
Net income (loss) 35.7$ 55.4$ (755.2)$ (714.1)$ (562.9)$ 3.2$ 17.5$
Interest expense 18.9 22.4 30.2 31.0 43.7 46.2 48.0
Depreciation and amortization 91.3 97.7 98.4 99.9 121.9 124.9 126.2
Impairments - - 799.2 764.2 566.3 - -
(Income) loss from unconsolidated affiliate investments (3.7) (5.9) (6.4) (4.3) 2.4 (0.8) (1.1)
Distribution from unconsolidated affiliate investments (1) 6.8 12.4 12.2 11.3 9.2 5.6 4.7
(Gain) loss on disposition of assets - - 3.2 (2.0) (0.2) 0.3 (3.0)
Unit-based compensation 13.8 7.6 7.3 7.1 7.9 7.3 7.3
Income taxes 1.2 0.7 1.0 (3.4) 1.0 (2.3) 2.6
(Gain) loss on non-cash derivatives 4.4 2.8 0.2 0.6 6.5 7.8 1.6
(4.5) (4.5) (4.5) (4.4) (4.4) (4.6) (4.5)
Other (2) 6.3 1.8 1.4 1.2 4.4 1.9 1.5
Adjusted EBITDA before non-controlling interest 170.2$ 190.4$ 187.0$ 187.1$ 195.8$ 189.5$ 200.8$
Non-controlling interest share of adjusted EBITDA (3) (0.1) 0.1 0.3 0.1 (0.8) (2.1) (3.3)
Transferred interest adjusted EBITDA (4) (40.2) (15.6) - (1.1) - - -
Adjusted EBITDA, net to EnLink Midstream Partners, LP 129.9$ 174.9$ 187.3$ 186.1$ 195.0$ 187.4$ 197.5$
Payments under onerous performance obligation offset to
other current and long-term liabilities