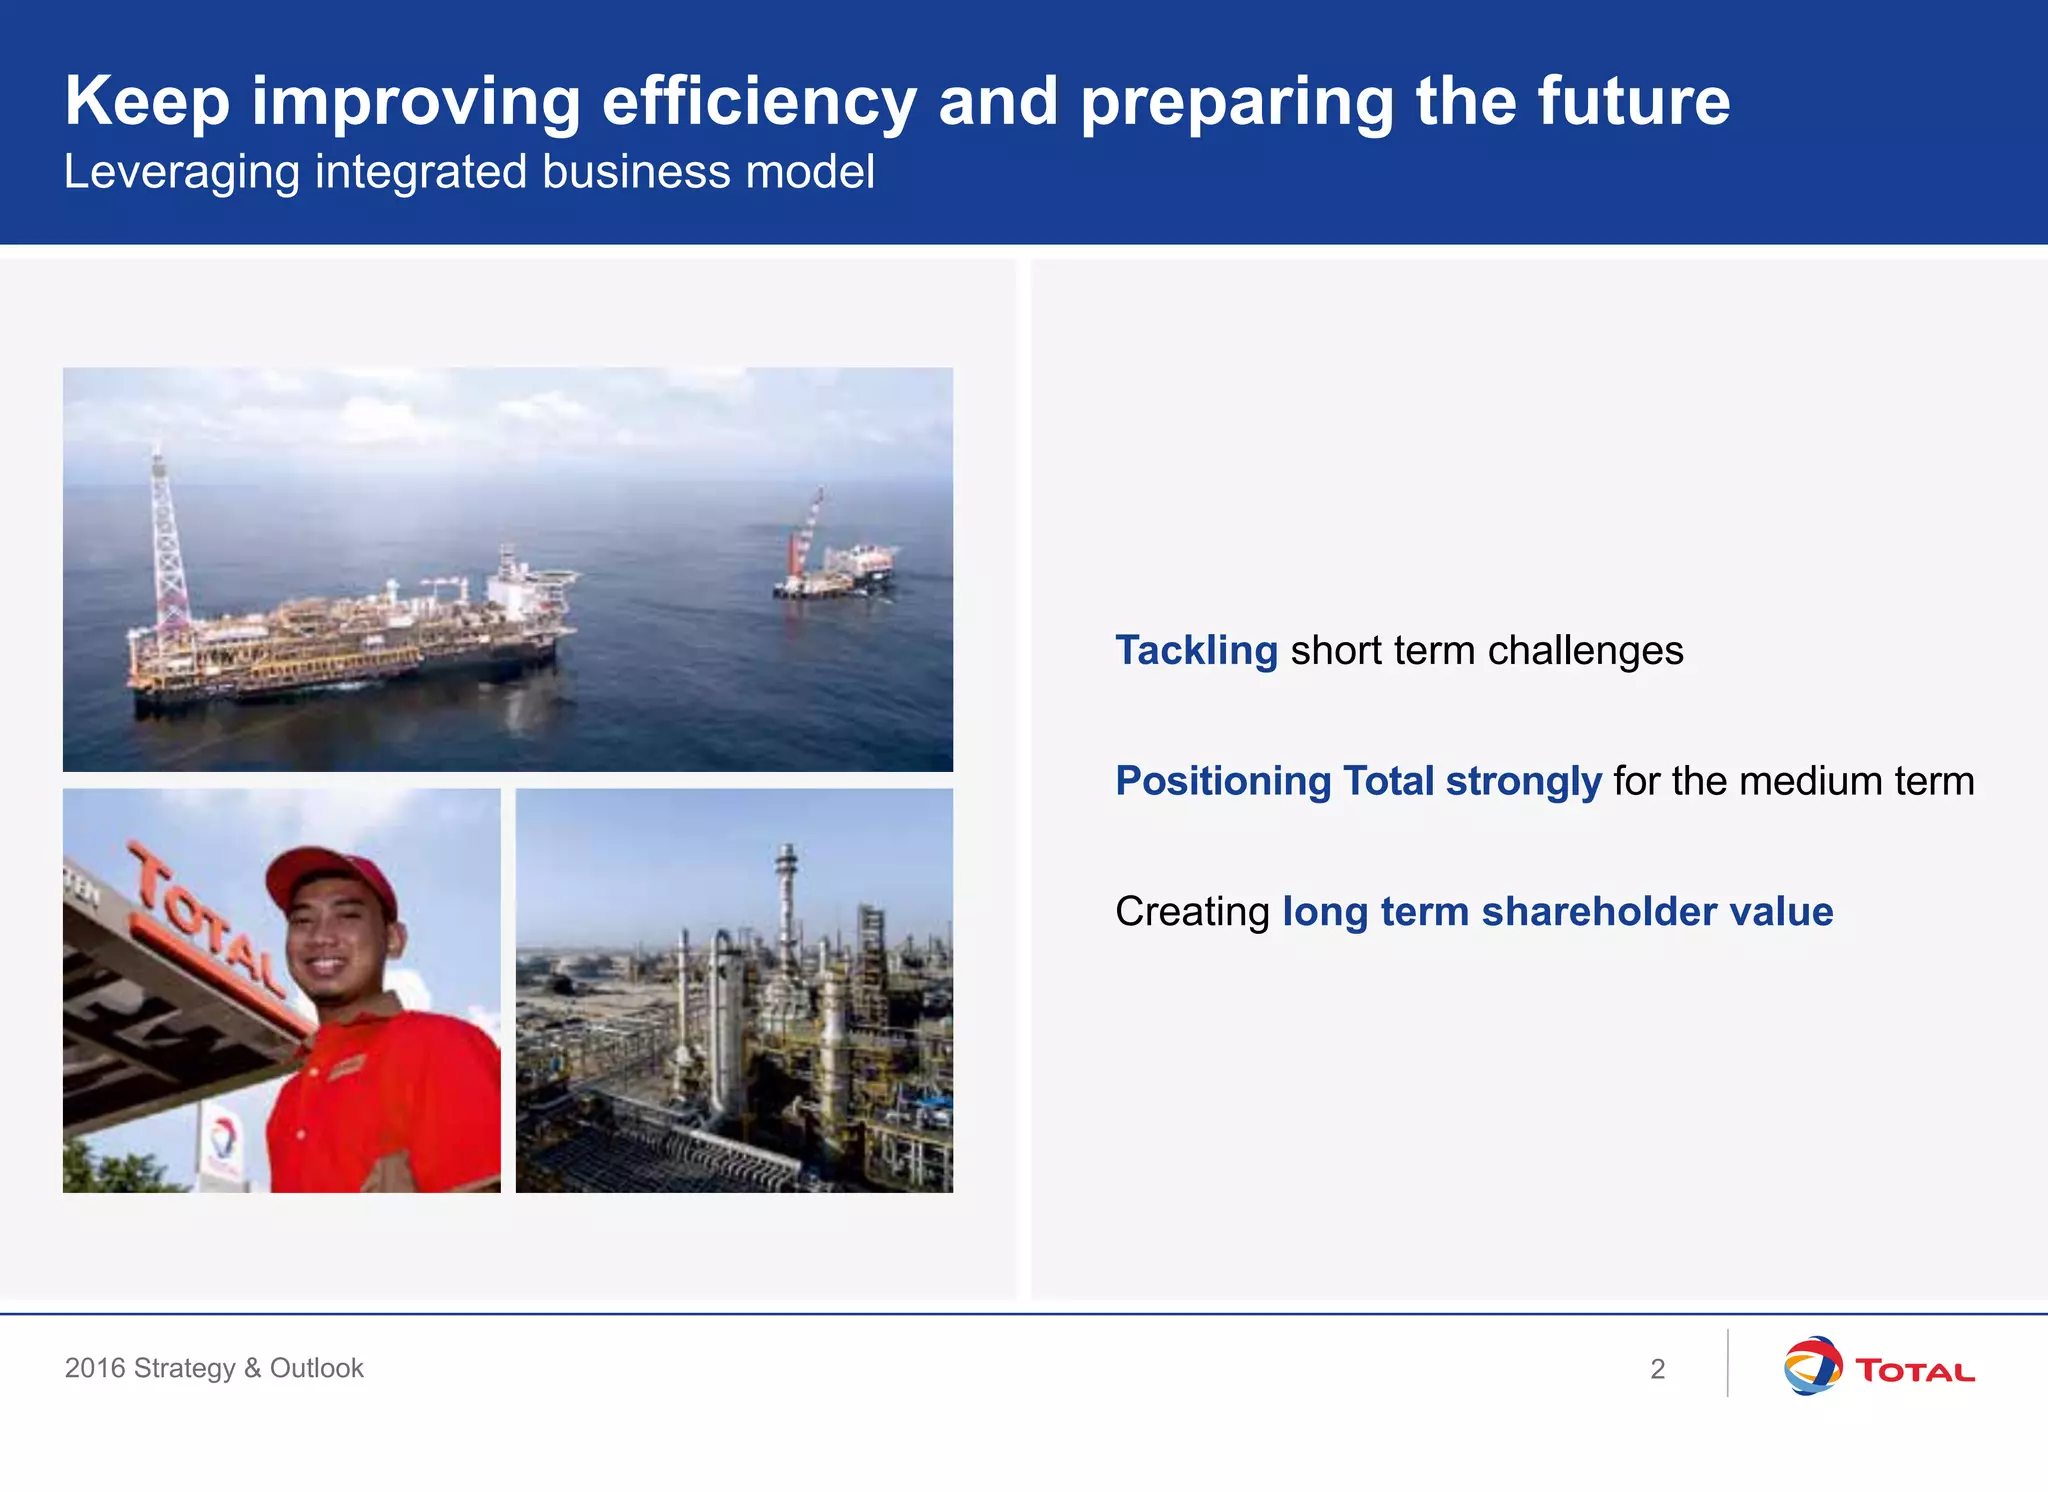
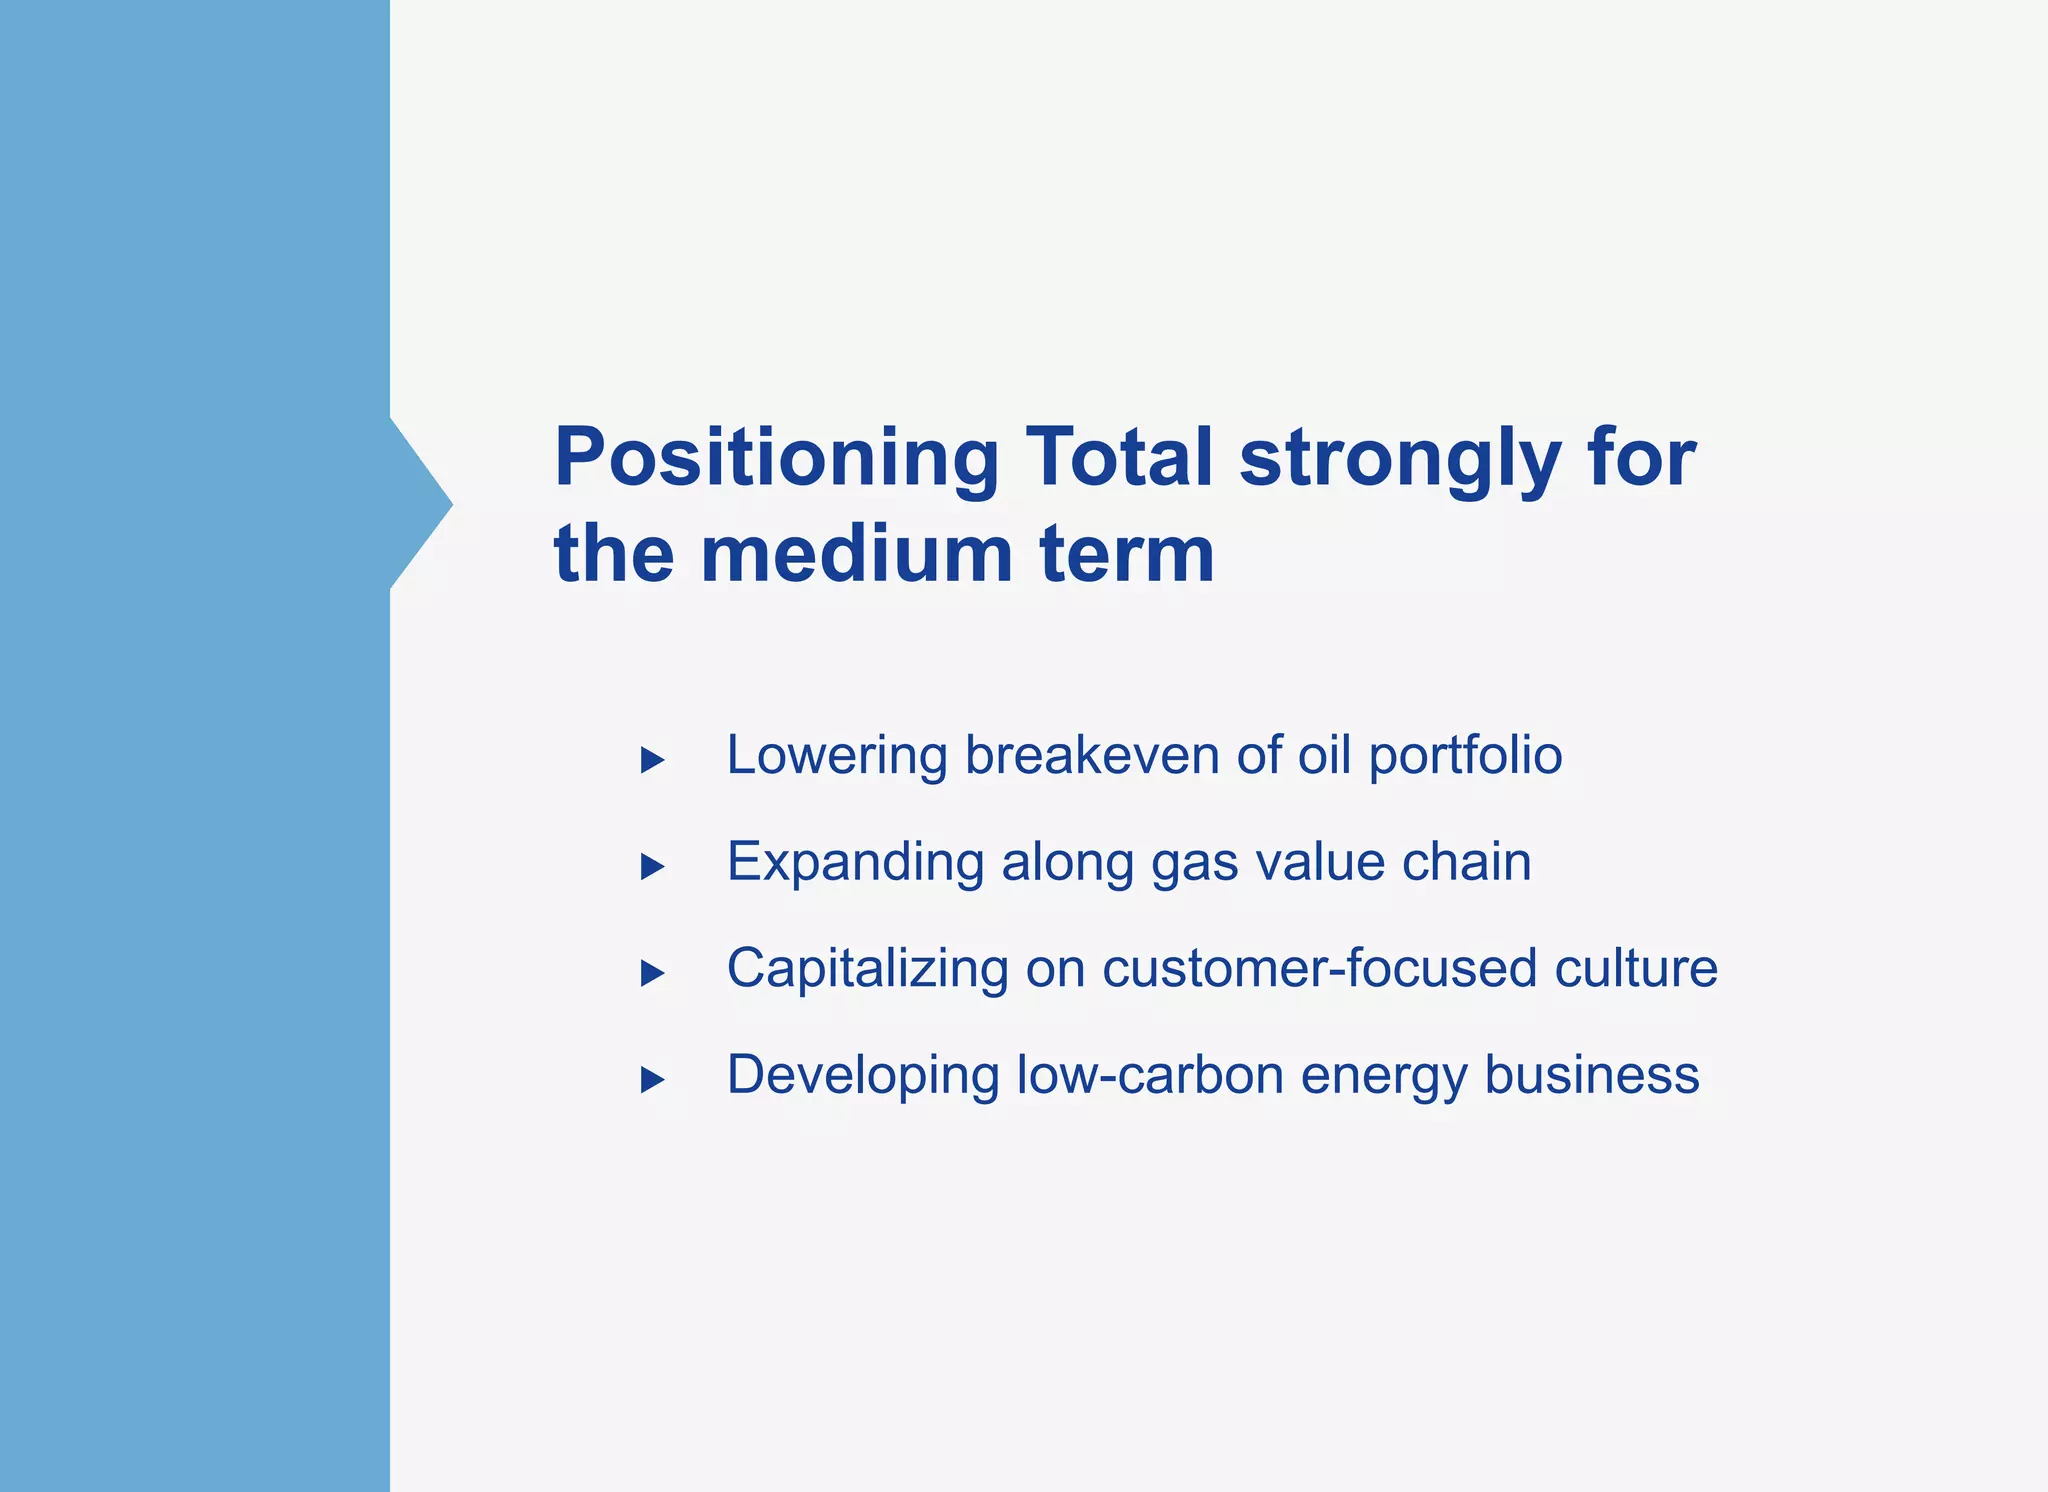
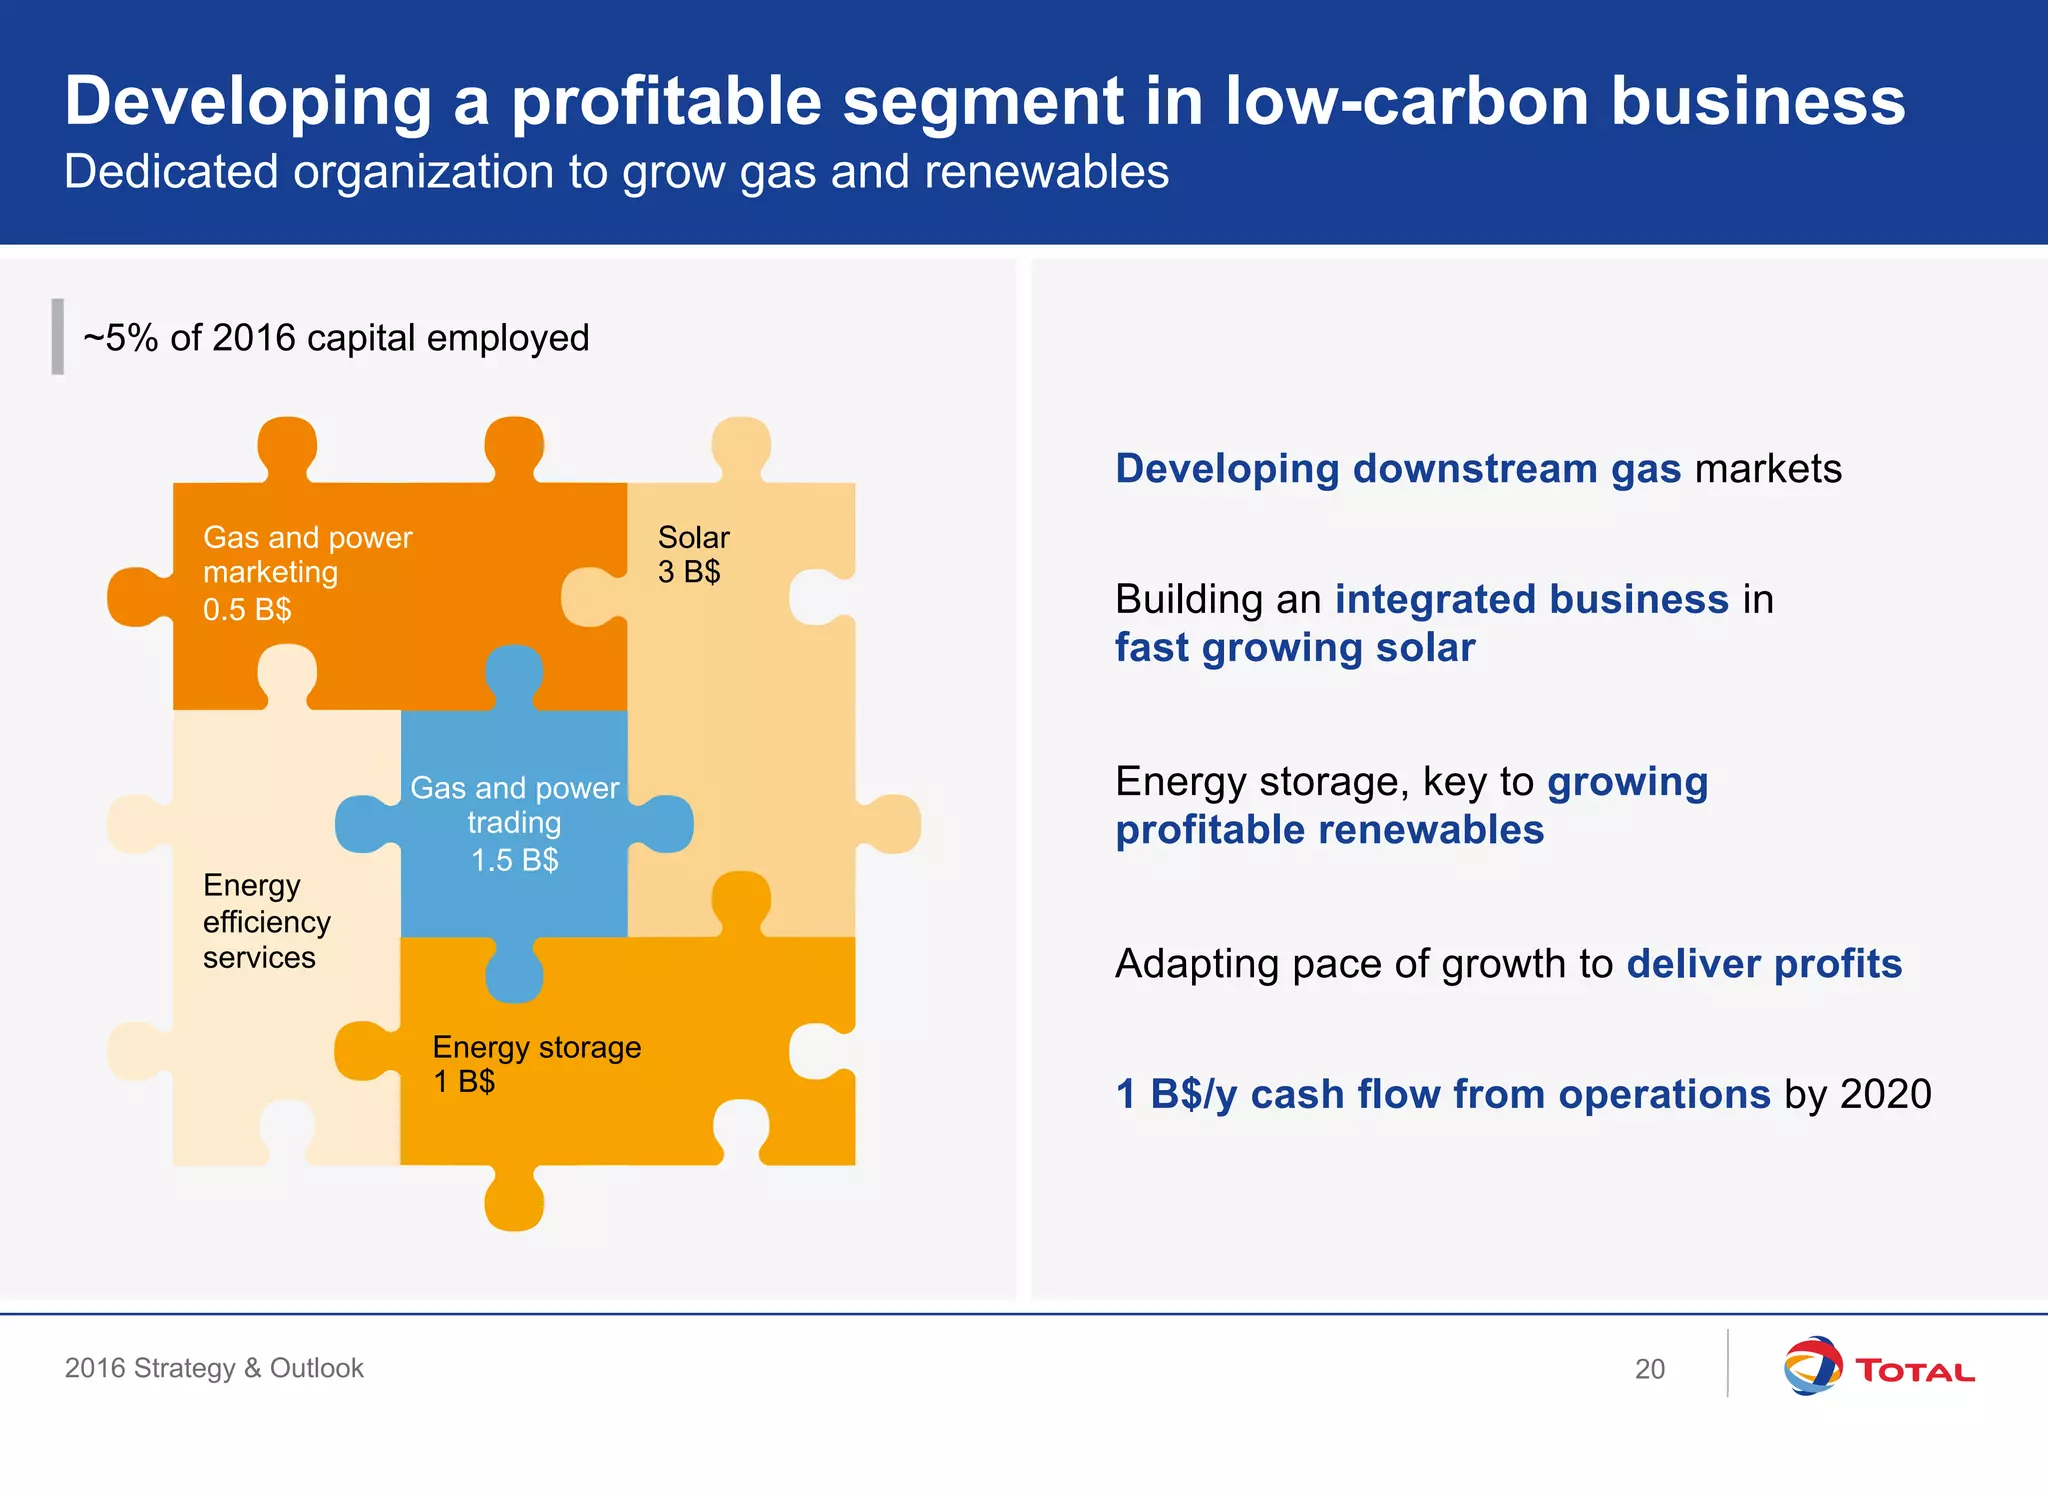
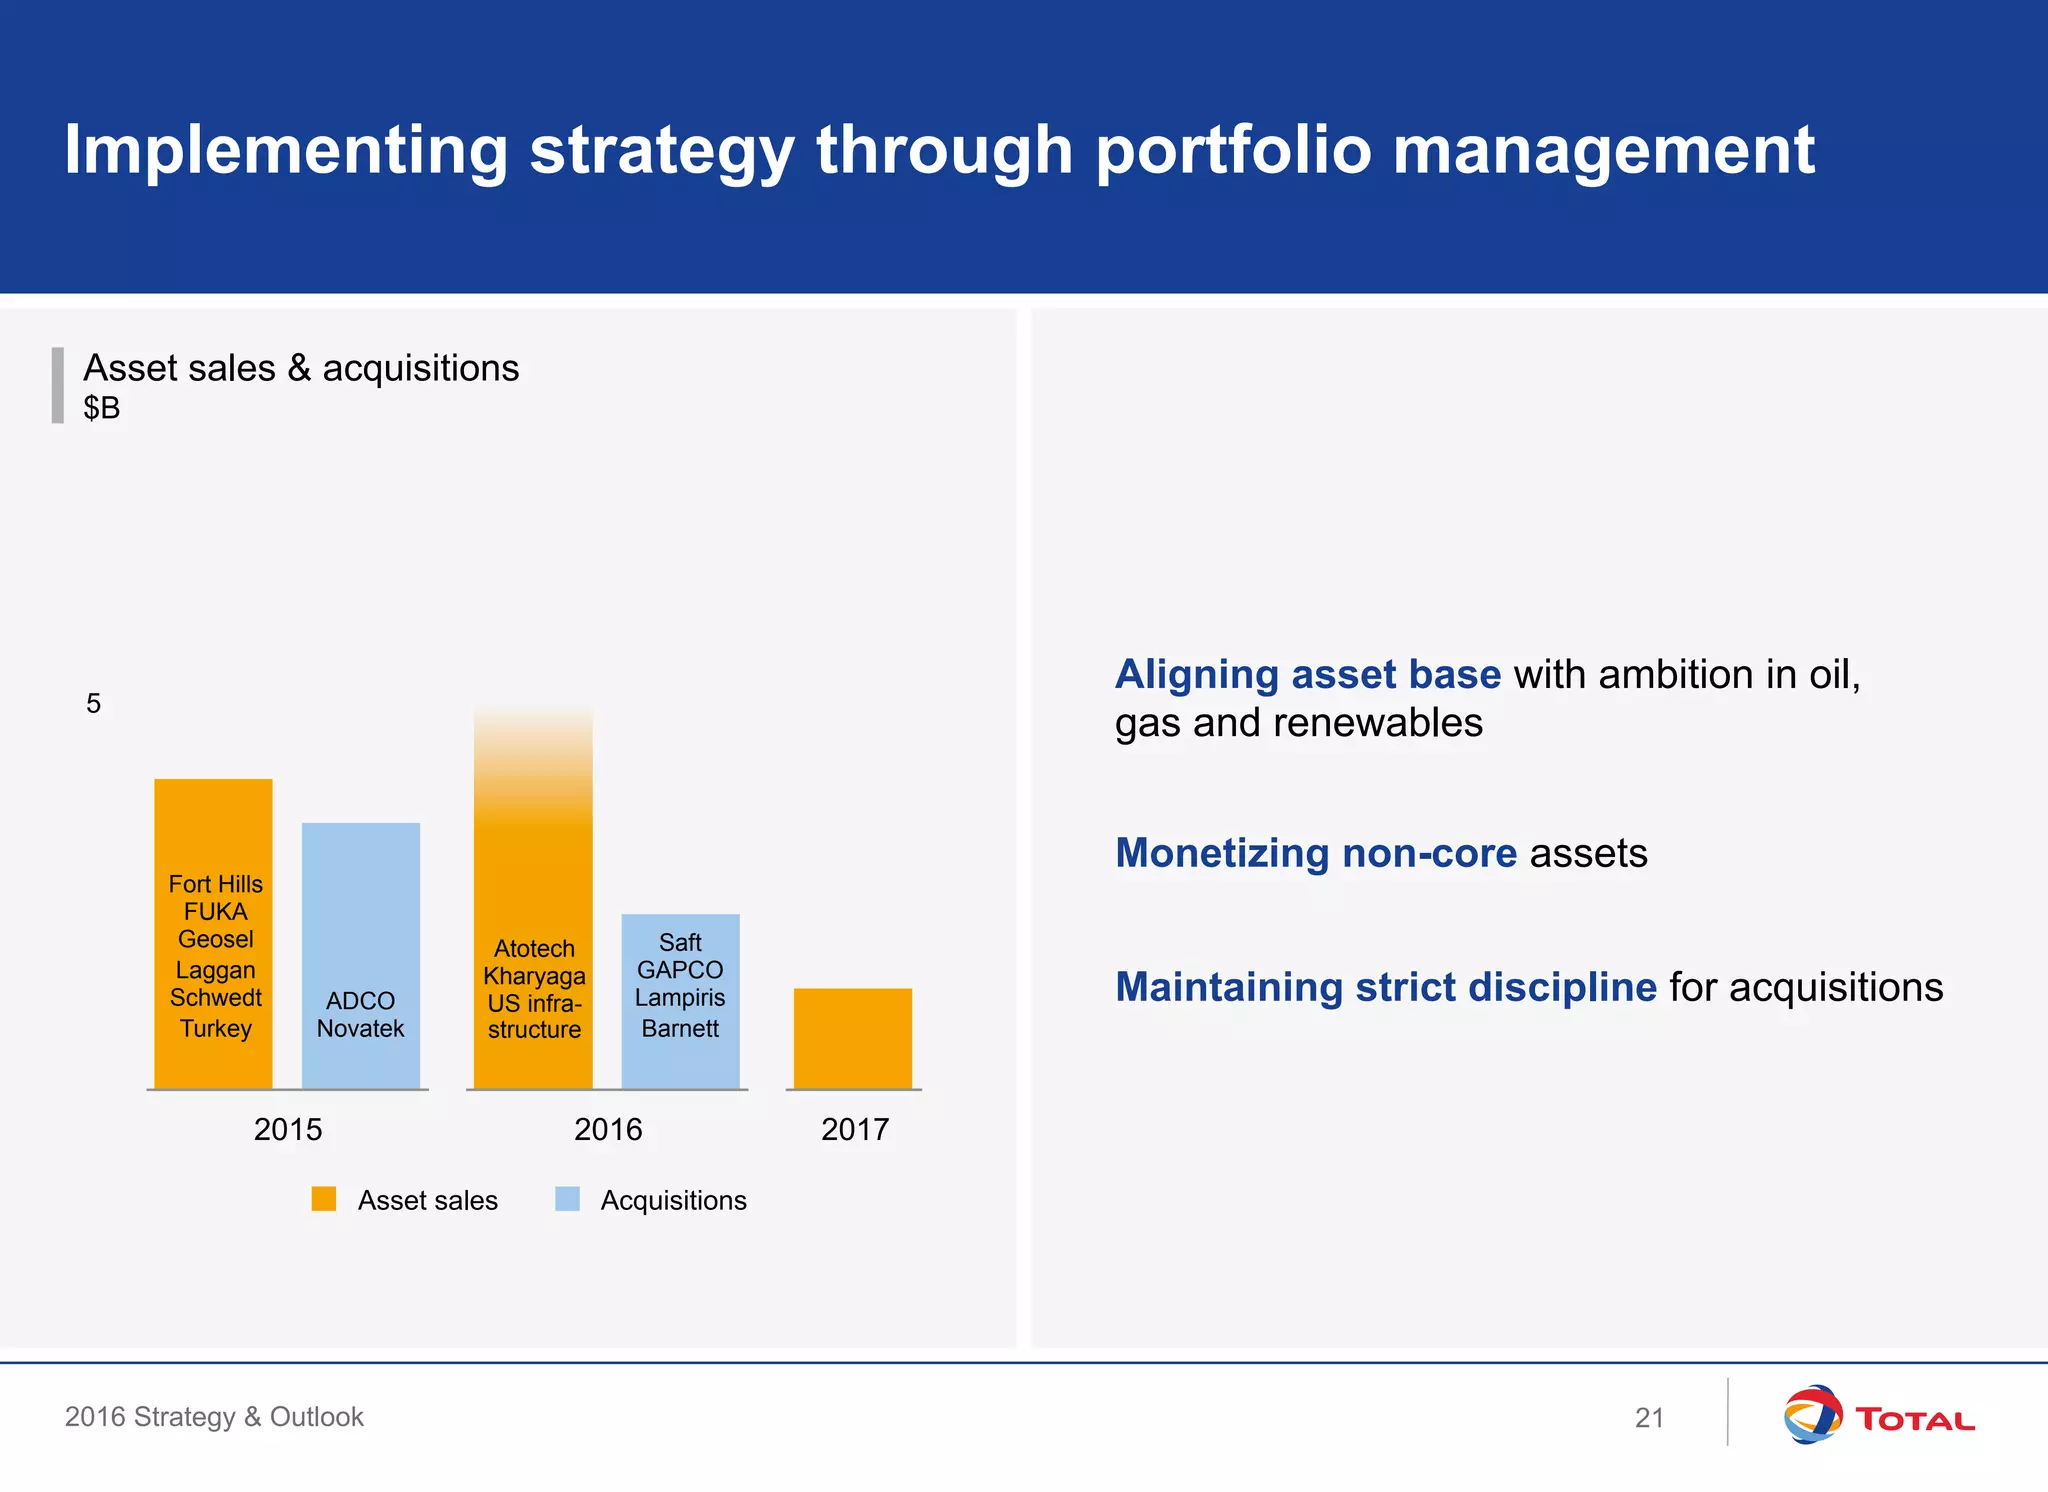
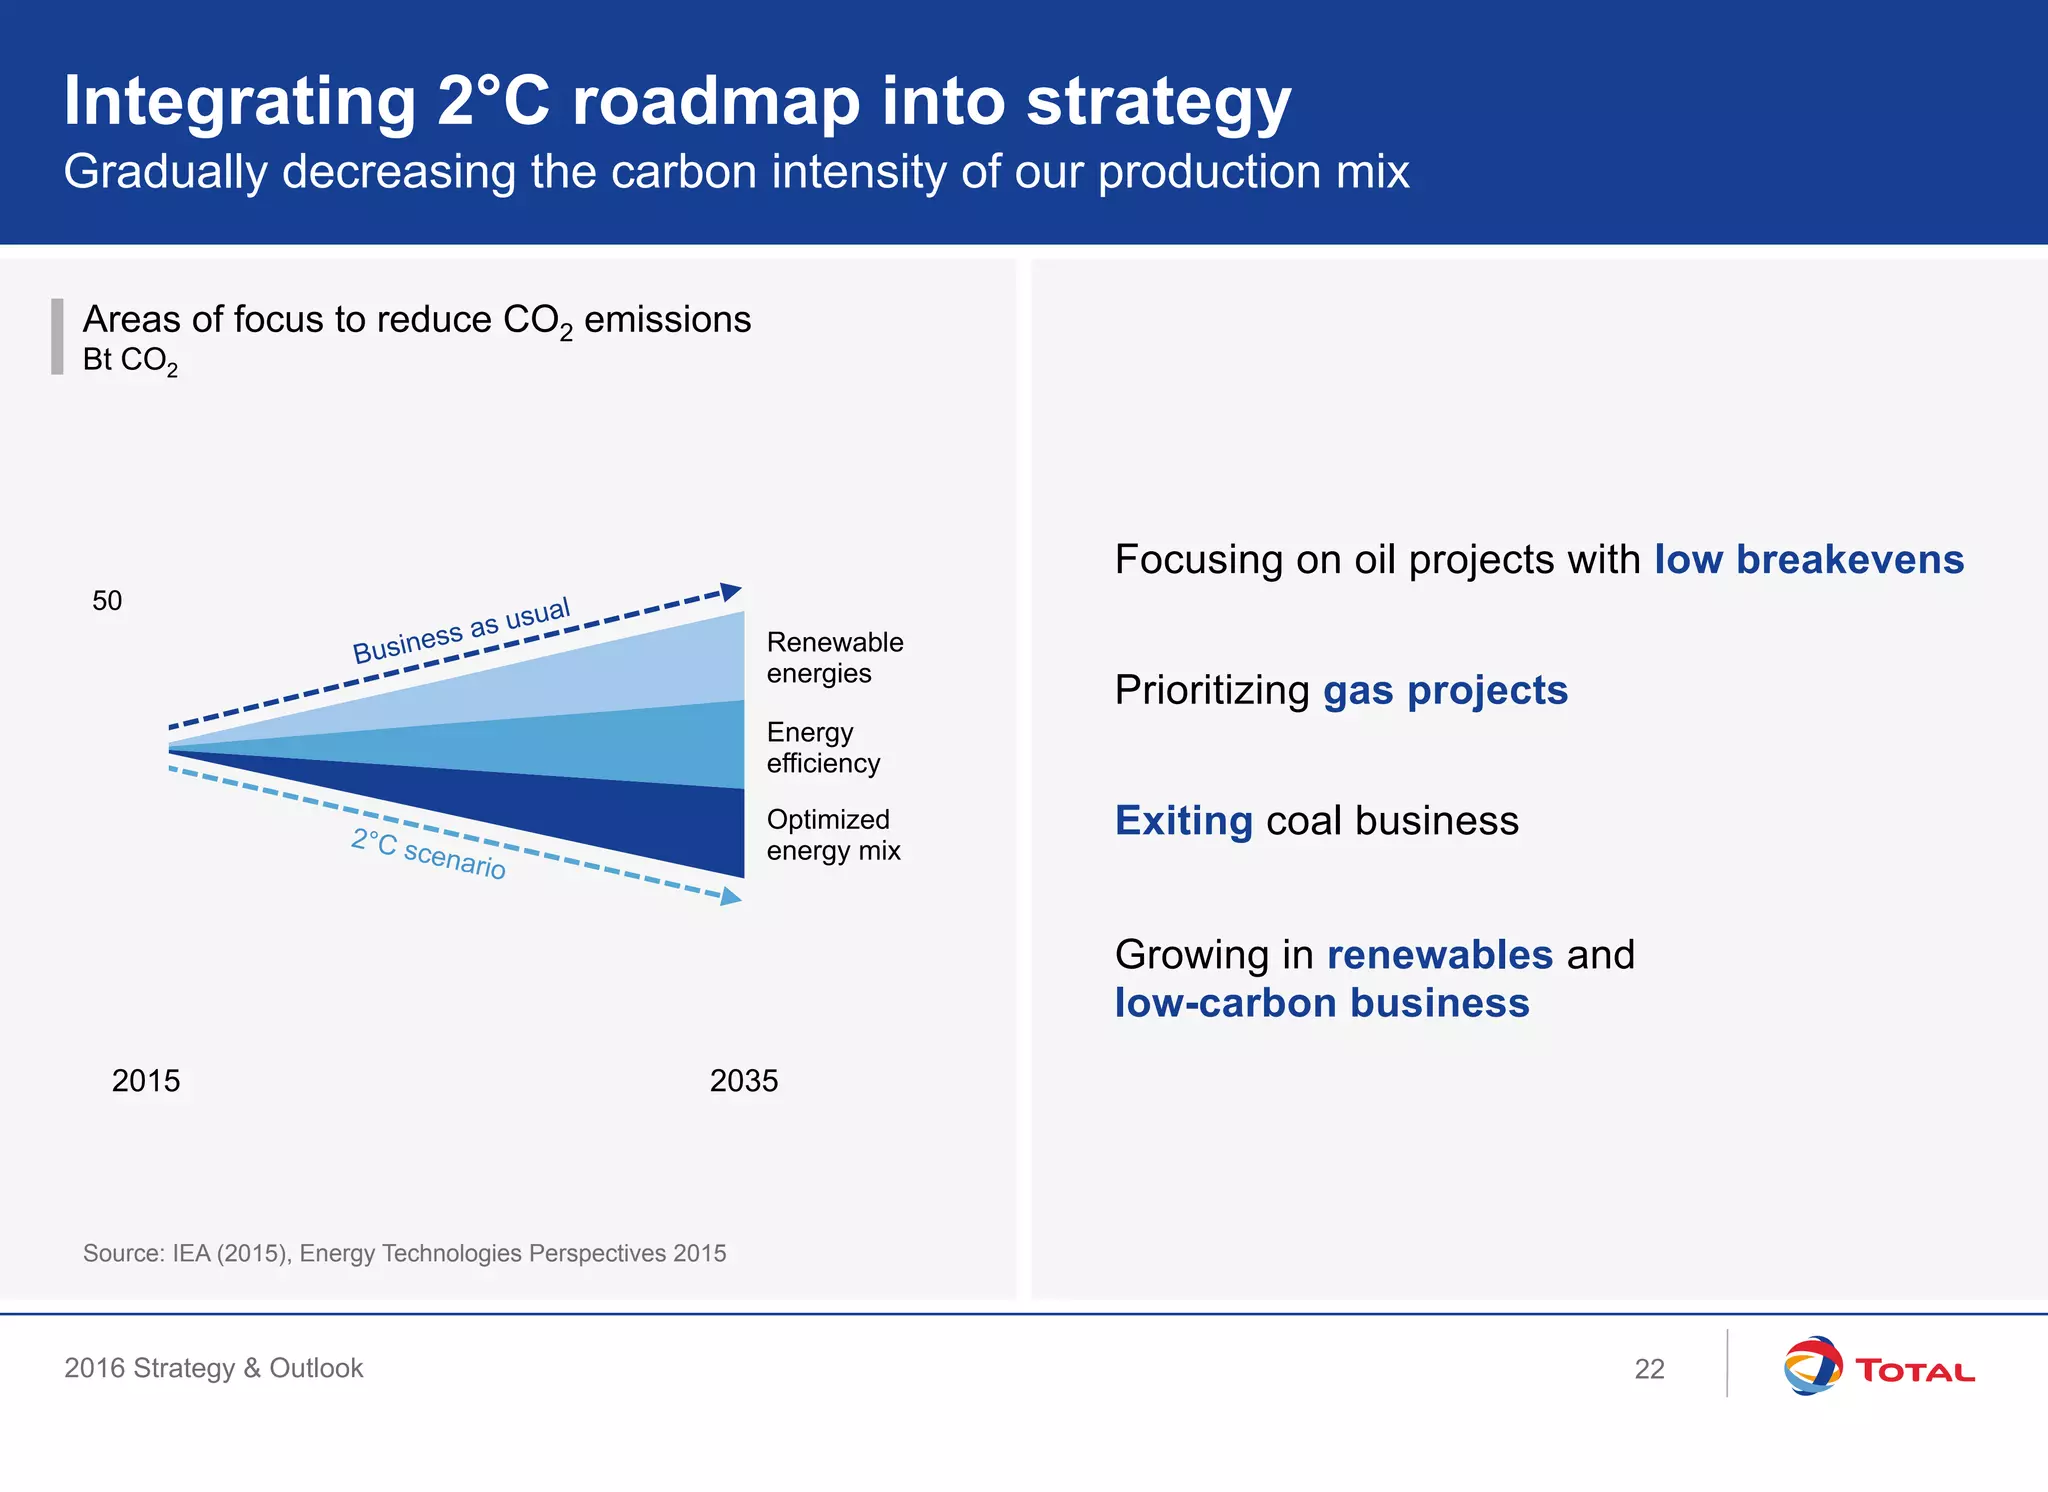
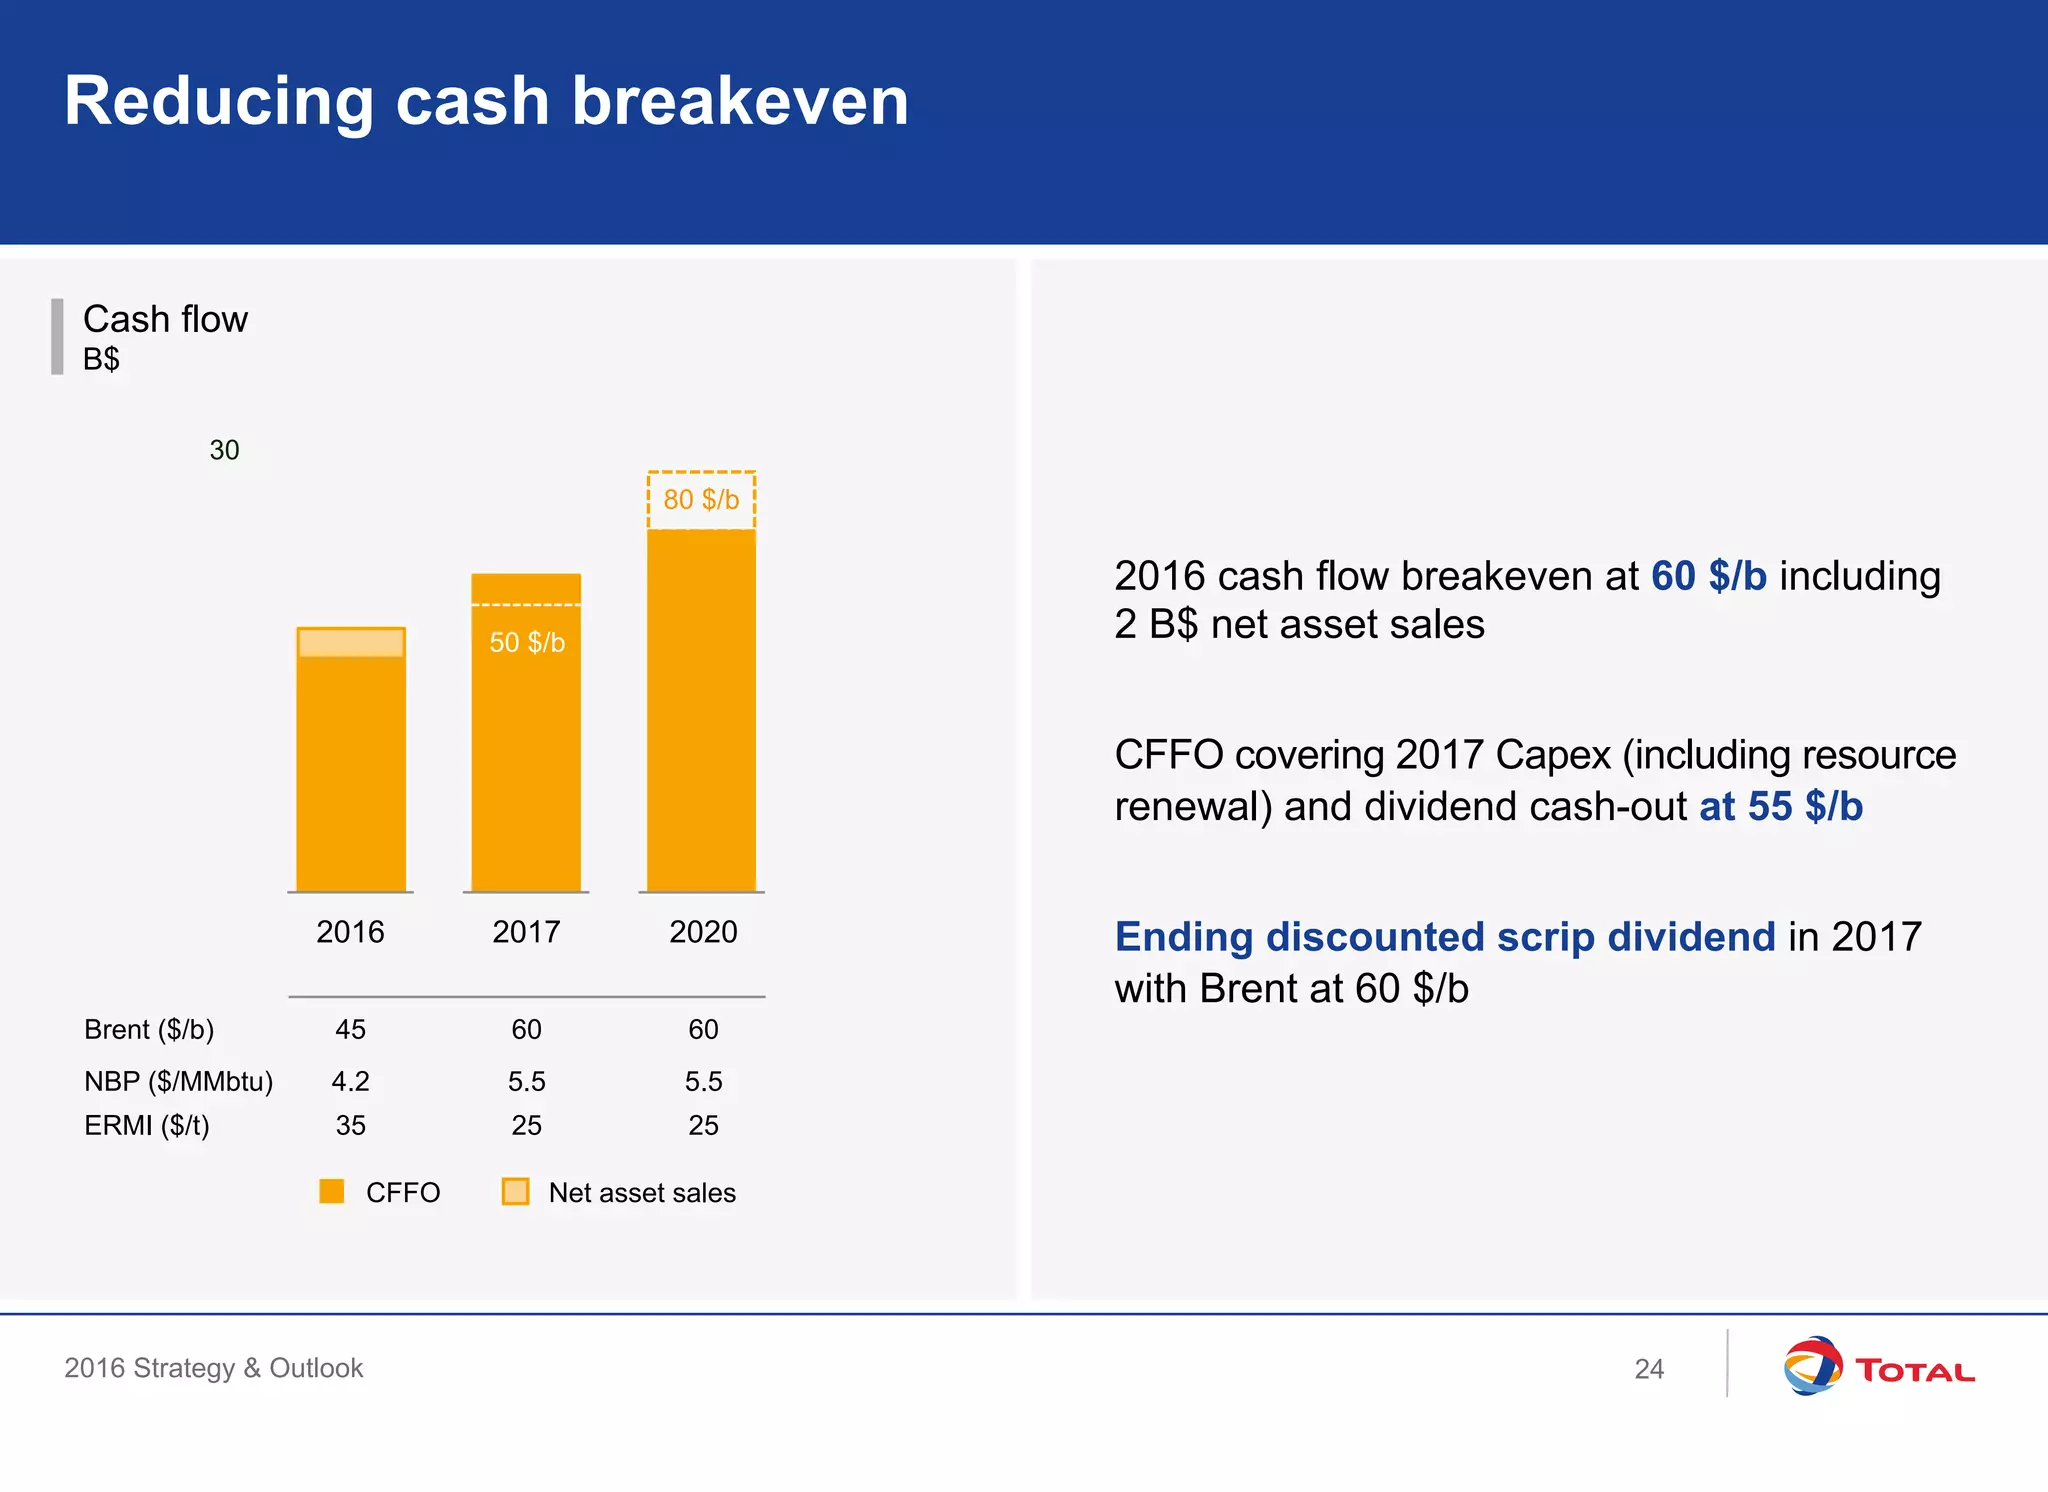
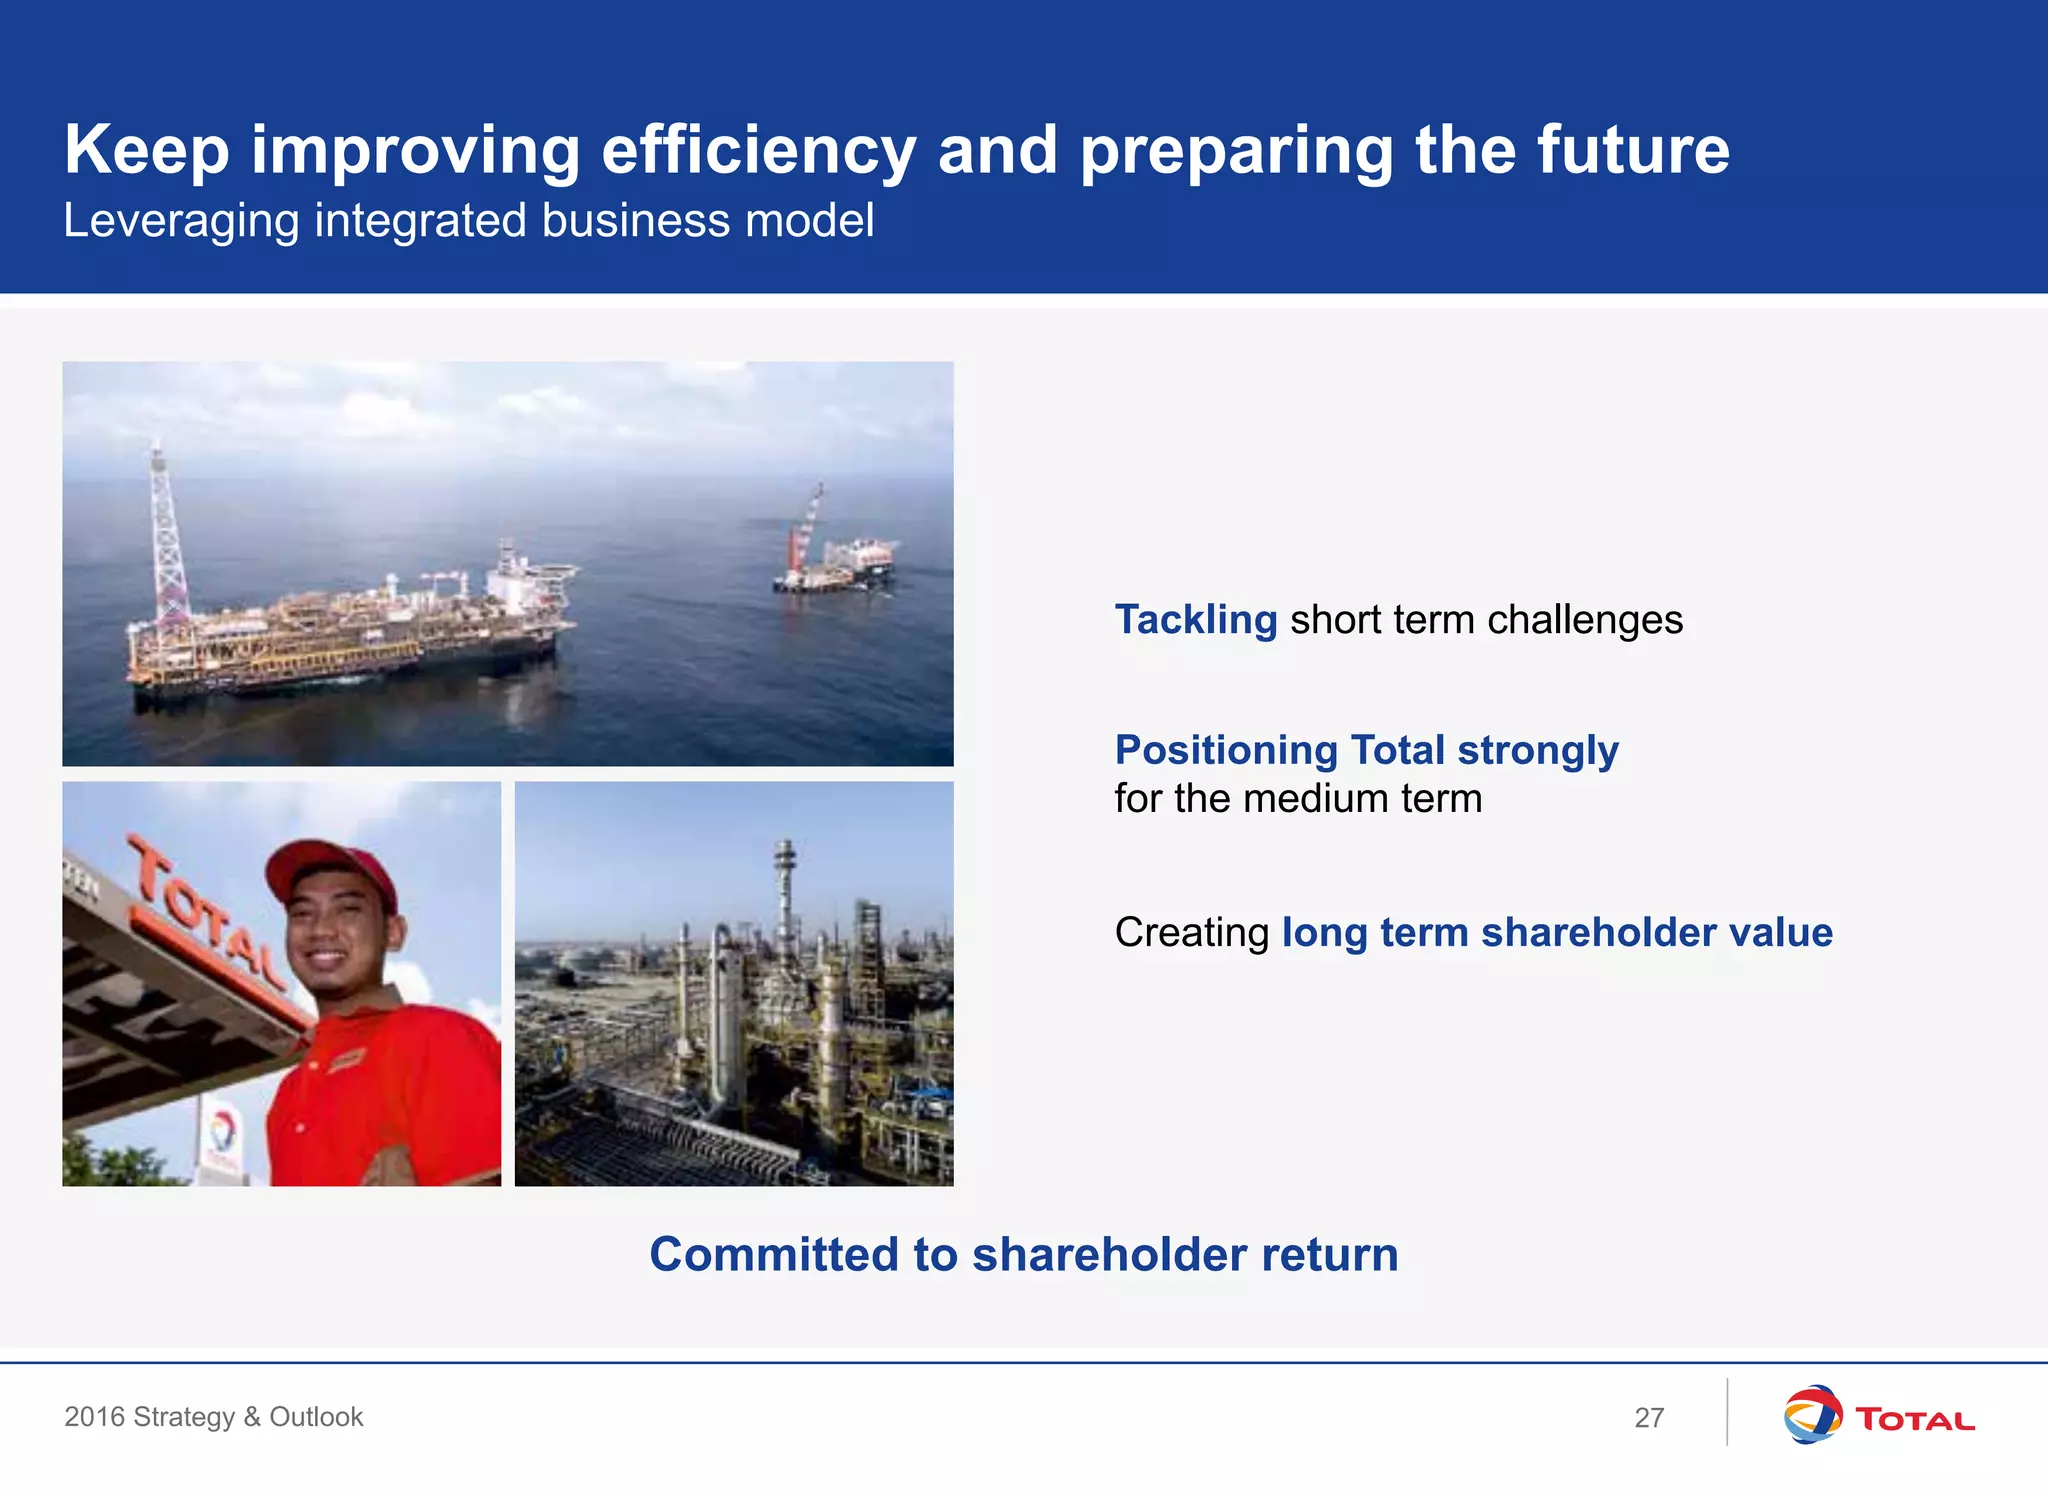
Total's strategy focuses on improving efficiency, preparing for the future, leveraging its integrated business model, tackling short-term challenges, positioning strongly for the medium-term, and creating long-term shareholder value. In the short-term, Total aims to improve safety and delivery, reduce costs, and generate cash flow. For the medium-term, Total seeks to lower its oil portfolio's breakeven, expand along the gas value chain, and capitalize on its customer-focused culture. Total also aims to develop a profitable low-carbon business to create value over the long-term.
The document provides Total's results and outlook for 2016. It summarizes their resilient 2015 performance despite lower oil prices, including production growth of 9.4% and $8 billion in downstream cash generation. For 2016, Total plans to decrease capex to around $19 billion, increase opex savings to $2.4 billion, and further lower their cash breakeven. They also discuss strong safety and operational performance, progress on asset sales, growing production from new projects starting up, and maintaining focus on shareholder returns.
Total 2018 Investor Day - Strategy and Outlook Total
The document provides an overview of Total's 2018 strategy and outlook. Key points include:
- Maintaining strong cost discipline while growing production consistently
- Managing the portfolio countercyclically to increase cash flow and profitability
- Building a responsible oil and gas company and expanding into low carbon electricity
- Increasing shareholder value through delivering production growth, reducing costs, and creating value through the cycle
- Leonardo delivered strong results in the first 9 months of 2016 despite challenging market conditions, with record new orders of €15.5 billion driven by the €7.95 billion Eurofighter contract for Kuwait.
- Profitability improved with net income more than doubling to €343 million, supported by lower financial expenses.
- The company expects continued good performance in the fourth quarter and remains on track to meet full-year guidance.
150825 2015 half year results 2 pp-1a82e52f-ff49-4a17-9cc5-e5f333a6d5a5-0absmartkarma
Oil Search Limited reported its 2015 Half Year Results. Key highlights included record half year production of 14.3 mmboe, nearly triple the production in 1H14. Net profit was up 49% to US$227.5 million due to the full period of LNG and condensate sales from the PNG LNG Project. The interim dividend was tripled to 6 US cents per share and the company maintained its full year production guidance despite lower oil prices.
The document provides forward-looking statements about the company's business and the LPG industry. It notes that forward-looking statements are based on opinions and forecasts which are subject to risks and uncertainties. The document also includes a disclaimer that financial projections cannot be used as reliable indicators of future performance, and no assurance is provided that assumptions underlying statements are error-free.
eni's strategy focuses on sustainable growth through distinctive partnerships with host communities. eni offers long-term approaches, better economic terms, participation in projects, and knowledge sharing. eni manages risks through diversification, focus on core hubs with strategic partnerships, and meeting countries' development needs through projects like power, agriculture, and petrochemicals. eni minimizes environmental impacts through initiatives like zero gas flaring and water usage optimization.
UGI Corporation is a distributor and marketer of energy products and services including natural gas, propane, butane, and electricity across 50 states and 16 European countries. It operates through several business units: UGI Utilities is Pennsylvania's largest gas utility serving over 600,000 customers; AmeriGas is the largest retail propane marketer in the US serving over 2 million customers; International operations distribute propane in Europe; and Midstream & Marketing sources and markets natural gas and electricity. UGI aims to generate steady growth and income through its diversified portfolio.
Finmeccanica First Quarter 2015 Result PresentationLeonardo
1) Finmeccanica reported a good start to 2015 with key metrics heading in the right direction, including revenues increasing above expectations and EBITA rising 11% with an improved ROS of 5.9%. (2) The company confirmed its FY2015 guidance and remains on track to execute its industrial plan and divisionalization process. (3) Focus remains on improving profitability and cash flow generation while reducing group net debt to below €3 billion by end of 2017.
Finmeccanica Full Year 2013 Results PresentationLeonardo
The document summarizes Finmeccanica's FY2013 results presentation. It reports strong order intake but lower revenues due to cuts in defense spending. While most business divisions grew orders and maintained profitability, AnsaldoBreda and some Selex ES sectors faced challenges. Restructuring initiatives improved profitability across many divisions. Overall, the group met guidance but free cash flow was negative due to legacy contracts. The outlook for 2014 is positive if restructuring delivers further efficiency gains.
This document provides a summary of ERG's 2015-2018 business plan, which focuses on expanding and diversifying the company's renewable energy portfolio. Key points include:
- ERG recently invested €950 million to acquire 527MW of hydroelectric capacity and €500 million to add 370MW of wind farms.
- The plan aims to further increase installed wind capacity to over 1,700MW by 2018 through 200MW of new organic growth projects internationally.
- Other strategic priorities include consolidating newly acquired hydro and wind assets, pursuing operational efficiencies, and developing an energy management business to control portfolio risks.
200215 Santos 2014 full year results presentationSantos Ltd
Santos today announced a 2014 underlying net profit of $533 million, up 6 per cent on the previous year.
Full-year highlights
•Production up 6% to 54.1 mmboe
•Sales revenue up 12% to $4 billion
•EBITDAX up 8% to $2,153 million
•Operating cash flow up 13% to $1,843 million
•PNG LNG start-up ahead of schedule with the project shipping 55 LNG cargoes in the year
•GLNG more than 90% complete and on track for first LNG in the second half of 2015, within budget
•Final dividend maintained at 15 cents per share, bringing the full-year dividend to 35 cents per share, up 5 cents
Royal Vopak - Capital Markets Day 2013 - Patrick Van Der VoortCompany Spotlight
The document discusses Vopak Asia's continued growth, noting increasing demand for storage services in Asia driven by rising populations, economies, and energy consumption in the region. It introduces Patrick van der Voort, President of Vopak Asia, and outlines Vopak's strategy to capitalize on growth opportunities through its existing terminal network and partnerships, as well as potential hub and terminal developments.
The document provides an overview of Dorian LPG and the LPG shipping industry. It notes that Dorian has the youngest and largest fleet of ECO VLGCs, which are more fuel efficient than traditional VLGCs. It also discusses trends in the global LPG market like increasing US exports due to shale production and growing demand in countries like China and India. Overall it presents Dorian as well positioned in a growing industry due to its fuel efficient fleet and experience in technical and commercial ship management.
Victrex reported a robust performance for the fiscal year ended 30 September 2013, with volume, revenue, and earnings per share ahead of the previous year. Gross margins remained strong despite adverse currency movements. The company continued investing to support future growth programs and achieved record cash generation. Both the VPS and Invibio business units reported stable or slightly improved performance. Looking forward, Victrex is well positioned for continued growth driven by focused market-led innovation and opportunities in key strategic markets like automotive, aerospace, and medical devices.
This document summarizes Eni's 2014-2016 strategy execution, which transformed the company into a fully integrated oil and gas company focused on profitable growth. Key aspects of the strategy included upstream enhancement increasing production 10% and cash flow per barrel 20%, midstream restructuring achieving break-even refining margins and positive chemicals EBIT, and cost optimization reducing capex and opex by over 30% each. Exploration successes like Zohr in Egypt were fast-tracked from discovery to production in under 3 years. The strategy halved Eni's cash neutrality price to $50 per barrel and positioned the company for structural free cash flow and self-financing.
Total delivered strong results in 2018, with production growth of 8% and adjusted net income of $13.6 billion. The company consistently delivered on its objectives, including capital discipline with investment of $15.6 billion. Total is well positioned for future growth, with major projects set to increase production by over 9% in 2019 and a portfolio of high return projects that can deliver over 700 kboe/d of new production by 2020. The company will continue to focus on cash flow growth, cost reductions, and returning cash to shareholders.
Using P/E basis, at the CMP the stock quotes at a FY16 P/E of 10.3. We think investors could buy the stock on dips to Rs.365 – Rs.384 band (~9.5-10.00x FY16E EPS and ~5.25-5.5xFY16 EV/EBITDA) for target of Rs.422 (~11.0x FY16E EPS and ~6x FY16 EV/EBITDA) over the next 1 quarter.
Leonardo's 1Q 2017 results presentation summarizes the company's financial performance for the first quarter of 2017. Key highlights include:
- New orders were in line with or above expectations across sectors such as helicopters, electronics, and aeronautics.
- Revenues were softer than the previous quarter due to expected lower volumes, though profitability continued to improve across sectors driven by efficiency improvements.
- Guidance for full-year 2017 is confirmed, with expectations for revenues to remain around 2016 levels and further improvements in profitability.
An updated PowerPoint from COG presented at the Barclays CEO Energy/Power Conference 2015 in New York City, September 2015. Cabot is one of (perhaps THE) most successful drillers in the Marcellus Shale.
Ilham Kadri at Solvay 2019 shareholders meetingSolvay Group
- Solvay is a global advanced materials and specialty chemicals company with over 24,500 employees across 61 countries.
- In 2018, Solvay achieved €10.3 billion in net sales, with 50% coming from sustainable solutions. Underlying EBITDA was €2.2 billion with a 22% margin.
- Solvay is making progress on its 2025 sustainability objectives around greenhouse gas intensity, employee engagement, sustainable solutions, safety, and societal actions.
We updated investors in London on our portfolio, with next generation mobility & resource efficiency as key markets and key levers that will enable us to deliver superior and #sustainable value growth. Our transformation and innovation-focused growth have delivered strong profits and cash in the past few years. Looking ahead, we will leverage on our differentiated technologies and our simpler organization to innovate and to better partner with our customers to generate superior growth. www.solvay.com/en/investors/solvay-event-calendar/capital-markets-day
HeidelbergCement held a Capital Markets Day in London on November 10, 2016 to discuss the company's growth strategy and performance. The presentation outlines HeidelbergCement's integration of Italcementi, which expanded its global footprint and added cement capacity. The integration is progressing faster than expected, with redundant headquarters closed and efficiency programs from HeidelbergCement applied. Synergies from the acquisition have been significantly increased to over €400 million. The presentation also highlights HeidelbergCement's continued improvement in financial metrics like EBITDA, free cash flow, and return on invested capital.
Vuyk Engineering Rotterdam was contracted by Smit Engineering to review a basic design for dynamically positioned anchor handling tug/supply vessels (AHTS) with 70-ton and 120-ton bollard pull capabilities. Smit ordered two 70-ton AHTS from a shipyard in Singapore, with an option for two 120-ton AHTS, which they later exercised. Vuyk assisted Smit by comparing shipyard offers, advising on propulsion and thruster configurations to obtain DP-2 dynamic positioning classification.
Development of the Commodity AHTS Market and introducing the 'Six Eighty’M3 Marine Group
Captain John Meade talks about development of the commodity AHTS market and introduced the “6-80” (6,000 BHP 80T AHTS) design at the Offshore Support Vessel Asia Pacific Conference in Kula Lumpur Malaysia (27-28 February 2013)
HR Tech Interactive 2016 - Keynote by Charles Hughley Sanna Lun
This document discusses the importance of an Employer Value Proposition (EVP) and engaging employees throughout their employment lifecycle. It outlines how an EVP communicates a company's values to attract the right talent and retain current employees. The document also describes lessons learned in developing an EVP campaign and key metrics for measuring its success, such as improved hiring times and quality, engagement, and retention. Finally, it discusses engaging employees at different stages including attraction, onboarding, development, and separation.
The document discusses improving the candidate experience for job applicants. It notes that few employers understand what the candidate experience entails from the applicant's perspective or properly measure it. The presentation outlines lessons learned for employers, including understanding an applicant's value, seeing the process from their viewpoint, listening to feedback, clear communication, honesty, and following through on promises made. Data shows candidates are less likely to refer or continue being customers of companies with poor candidate experiences. The goal is for employers to gain insights to enhance how they interact with and treat all applicants.
Gabriella has 29 years of experience at MM, including 20 years in HR in roles such as HRBP and coaching supervisor. She has a law degree, Master's in corporate coaching, and is a certified professional coach. Coaching is an effective management tool to help talents and managers grow through structured communication and feedback. As HR director, she led initiatives such as defining a new sales incentive plan and conducting 360 reviews for executives.
On April 20, 2016, Tom Haak of the HR Trend Institute/ Crunchr gave a presentation to the "HR Strategy" program ("HR Strateeg") of AOG, in Groningen. These are the slides he used as illustration.
This document discusses the use of predictive analytics and wearable technology in human resource management. It begins with an overview of predictive analytics and how it uses big data and statistics to predict future trends. It then discusses how predictive analytics can be applied to recruitment, talent development, retention, and detecting insider risks. The document also covers common legal issues around employee monitoring and data privacy, and provides tips for using wearable technology including obtaining employee consent and focusing on aggregate data. It emphasizes the importance of involving employees in predictive analysis decisions.
World Deepwater Market Forecast 2016-2020 Leaflet + ContentsDouglas-Westwood
Sustained Low Oil Price Sinks Deepwater Projects, with 2016-2020 Deepwater Spend to Total $137 Billion
Douglas-Westwood (DW) forecasts deepwater expenditure to total $137 billion (bn) between 2016 and 2020. This represents a 35% decline compared to DW’s previous edition of the deepwater forecast issued March 2015.
The Engagement Roadmap
4 Ways to Improve Engagement Scores Using Your Own HR Strategy & Technology
With all the buzz about engagement over the past few years, the reality is that most programs are not generating measurable, bottom-line results. But the problem is not necessarily what you are doing, but rather how you are doing it!
While many of these engagement ideas sound great on the surface, the reality is "bolting on" various engagement tools only creates a more complicated, expensive and ineffective approach. It's time to stop forcing engagement and start integrating it.
In this informative, new webinar we will share relevant and realistic ways to improve your engagement scores using the HR strategies and technology you already use every day! No more bolting on software - no more engagement plans of the month - these are real-life case studies, statistics and strategies you can use today to integrate and improve your engagement scores.
Learn 4 ways strategic HR departments are using integrating engagement including:
1. Engaging Applicants - how to increase the number of quality hires with less work
2. Engaging Employees - the guaranteed way to cut turnover 20% in your first year!
3. Engaging Line Managers - how to get managers to embrace your engagement program
4. Engaging the C-Suite - how to get buy-in for your engagement goals
Plus, get the template for creating your own Engagement Roadmap! If you have an employee engagement initiative this year – you won’t want to miss this webinar. This content-packed webinar is great for HR leaders and management of virtually any sized company.
To learn more, visit http://hrsoft.com
The spotlight is on the Chief HR Officer in 2016. Can you elevate HR above administrative task management to become a true strategic partner to the CEO?
How do you create an innovative HR operation that delivers exciting, consistently business-aligned results?
Anphabe is launching a new digital marketing strategy in Vietnam to connect professionals to career opportunities through knowledge sharing and valuable contacts. The strategy involves three phases: [1] Raising initial awareness of Anphabe through mass media and social media campaigns. [2] Highlighting Anphabe's leadership in connecting knowledge and jobs through on-site activations and events. [3] Establishing Anphabe as a place to affirm knowledge and career opportunities of "thousands of dollars" by continuously updating relevant content. The plan focuses on growing traffic, strengthening the brand, increasing user-generated content, and optimizing the website user experience across multiple online channels over the course of one year.
M&S aims to provide excellent customer service, product quality and value. Its mission is to inspire others through quality and accessibility. It focuses on sustainability through initiatives like Plan A. M&S has grown from a small partnership in 1894 to operating internationally with various retail formats and financial services. It faces competition but also benefits from its strong brand image and product variety.
The Uppsaala Model and Marks & SpencerMayank Beria
The document discusses the Uppsala model of internationalization and its application to Marks & Spencer's expansion into foreign markets. It describes the assumptions and stages of the Uppsala model, including the importance of psychic distance. It then provides an overview of Marks & Spencer's history and details its expansion into Asian markets like India and China, highlighting both successes and challenges faced.
Google was founded in 1998 by Larry Page and Sergey Brin and is headquartered in Mountain View, California. It recruits employees through referrals, colleges, and professional networks. Google offers flexible work hours and telecommuting when possible. It provides many amenities to employees like fitness facilities, snack rooms, cafes, games, and transportation benefits to promote work-life balance. Perks include unlimited sick leave, on-site healthcare, and daily free meals. Google also encourages employees to spend 20% of their time on self-directed projects to fuel innovation.
Symposium 2016 analytics on hr strategy using evidence Jon Ingham
Jon Ingham is a strategic HR consultant and technology analyst who focuses on using analytics to inform HR strategy. The document discusses different levels of analytics maturity from descriptive to predictive. It notes that predictive analytics may be limited by a lack of past data and cautions against extrapolating trends without understanding complexity. The document advocates using a combination of critical thinking and evidence from multiple sources to make management decisions. It provides Ingham's contact information for those seeking more information.
Recruitment leaders, marketers, recruiters and business owners need to plan ahead for 2016 and think about their social media strategy. Are you guilty of being a short-term junkie with no planning for the future? Stop it! Watch our webinar, follow our slides and get that monkey off your back...
In this webinar I’ll give ideas to help you leverage social media as a technology and a strategy that if used appropriately can significantly grow your business.
See on our blog too: http://www.barclayjones.com/blog/social-media-for-recruiters/you-need-a-social-media-strategy-for-2016-are-you-prepared/
The 2016 HR Technology Conference brought together industry leaders to share insights on engaging employees. Key insights included: (1) understanding how technology enables human connection leads to business success; (2) employees want purpose and growth opportunities, not just benefits; (3) engagement requires continuous measurement and action, not just annual surveys; (4) few companies feel they engage Millennials and other generations well; (5) content is the most powerful employer branding tool for hiring; (6) people trust other people, not just brands; and (7) while technology eliminates jobs, it creates new ones.
This document provides a complete guide to content marketing trends in 2016. It discusses that content marketing generates more leads at a lower cost than traditional marketing. Top trends include increased use of blogging, video, social media, and automation. Measurement of success focuses on website traffic, sales, SEO rankings, and time on site. Emerging trends include algorithms to generate content, new publishing on social platforms, influencer marketing, and interactive content to boost engagement. Virtual reality and knowledge graphs will also impact content creation.
Marks & Spencer is a British multinational retailer that started in 1884. After experiencing serious sales declines in the 1990s due to outdated strategies and leadership issues, Marks & Spencer launched initiatives like Plan A to improve its social and environmental impact, and Project 2020 to update its supply chain and IT systems. The human resources department supports these changes by promoting diversity and training. Marks & Spencer also uses strategies like decentralization and focusing on food offerings to address weaknesses identified in a SWOT analysis.
Presentation of the Strategy & Outlook by Patrick Pouyanné, Chairman and Chief Executive Officer and Patrick de La Chevardière, Chief Financial Officer.
September 2017
Total reported strong results for 2017 with adjusted net income of $10.6 billion, an increase of 28% over 2016. Safety performance improved with a total recordable injury rate of 0.9. Total is focusing on lower breakeven oil projects and expanding in gas, while growing its low-carbon businesses. Production grew 5% in 2017 and is expected to continue growing at a rate of around 5% through 2022.
- Total delivered strong 2016 results in a challenging environment, with adjusted net income of $8.3 billion and production growth of 4.5%.
- Safety remains a core value, with the Total Recordable Injury Rate improving to 0.9 per million man-hours worked.
- Total is focused on reducing costs, with upstream operating costs targeted to reach $5.5/boe in 2017 and $5/boe by 2018.
- Production is expected to continue growing in 2017 with ramp-ups of new projects and start-ups.
""Over the past three years, we have transformed Eni into a leaner and more resilient company. We have built a high margin portfolio consisting of a large number of mature projects, which will secure our production growth over the medium and long term, and a huge amount of reserves, which will give us flexibility and value."
This document summarizes eni's 2015-2018 strategy presentation. The key points are:
1) eni aims to transform the company by achieving 3.5% annual production growth, returning the mid-downstream businesses to profitability, increasing cash flow from operations by 40%, and creating a stronger and more resilient company.
2) The strategy focuses on cash generation, value growth, sustainability, and a robust balance sheet. Major elements include exploring for near and long term value, strict cost control, restructuring mid-downstream, and re-basing the dividend.
3) Key targets include reducing capex by 17%, lowering upstream costs by 7%, starting up over 650 thousand barrels per day of
Noble Energy is positioned for strong growth over the next five years from its portfolio of assets. Production is expected to more than double by 2017 through development of its core areas including the DJ Basin, Marcellus Shale, and offshore projects. Noble will invest $3.9 billion in 2013 to accelerate unconventional programs and complete major projects. This high level of investment is expected to deliver double-digit production and cash flow growth through 2017 and position the company for strong performance over the next decade.
Afrox investor & analyst presentation half-year results 2016 Simon Miller
Afrox held its investor and analysts presentation for half-year results to 30 June 2016 at its head office at Afrox House in Johannesburg on 8 September 2016.
Phillips 66 Partners reported $1.8 billion in adjusted EBITDA and $1.1 billion in capital expenditures for the first quarter of 2015. The company acquired interests in three pipeline assets for $1.1 billion, which are expected to generate $115 million in EBITDA for 2015. Phillips 66 Partners also announced $275 million in organic growth projects, focused on expanding its Bakken and Eagle Ford midstream infrastructure.
WSP Group is a global design, engineering and management consultancy. We work with clients to create built and natural environments for the future.
Introduce our new strategy plan
Meet our executive directors and hear about
their businesses:
Rikard Appelgren, European Managing
Director
Stuart McLachlan, Managing Director,
Environment & Energy
Paul Dollin, UK Managing Director
Insight into a major project: Crossrail,
Bond Street Station
Devon Energy is completing its transformation into a U.S. oil growth company by focusing on its world-class oil assets in the Delaware Basin, STACK, Eagle Ford, and Powder River Basin. It is pursuing strategic alternatives for its Barnett Shale and Canadian assets to be completed by the end of 2019. Devon is targeting $780 million in cost savings from its retained U.S. oil business and has increased its share buyback program to $5 billion.
Devon Energy is completing its transformation into a U.S. oil growth company by focusing on its world-class oil assets in the Delaware Basin, STACK, Eagle Ford, and Powder River. It is pursuing strategic alternatives for its Barnett Shale and Canadian assets. Devon is targeting $780 million in cost savings and increasing its share buyback program to $5 billion to reduce shares outstanding by nearly 30%. It is increasing its quarterly dividend by 13% and has a multi-decade inventory of high-return locations supporting long-term growth.
Royal Dutch Shell plc - Enhanced disclosures webcastShell plc
On Tuesday, May 4 Tjerk Huysinga, Executive Vice President Investor Relations, Sinead Gorman, Executive Vice President Finance Upstream, Brian Eggleston, Executive Vice President Finance Downstream, Frank Lemmink, Executive Vice President Finance Integrated Gas and Renewables and Energy Solutions and Roland Ilube, Senior Vice President Finance Mobility host an enhanced quarterly disclosures webcast.
Presentation of the CEO Dr. Bernd Scheifele, Annual General Meeting 2017HeidelbergCement
The document discusses HeidelbergCement's annual general meeting in 2017. It summarizes that in 2016, HeidelbergCement strengthened its position through acquiring Italcementi, achieved an investment grade rating, and increased results. Key financial figures for 2016 show revenue growth due to the acquisition and increased profits. An outlook expects further growth in 2017 despite challenging market conditions.
Capital Power April Investor PresentationCapital Power
Capital Power is an independent power producer with over 3,100 MW of generation capacity across Canada and the US. They have a well-positioned fleet mix including gas, wind and coal assets. Capital Power has a proven track record of operational excellence with high plant availability. They also have a strong financial position and investment grade credit ratings. Capital Power is well positioned to deliver consistent dividend growth going forward as they expand their contracted cash flows.
Leonardo presented its 3Q/9M 2017 financial results. Helicopter division results were weaker than expected due to ongoing market and execution challenges. While Aeronautics and Defense Electronics results were broadly in line with expectations, the overall 2017 guidance was made tougher reflecting issues in Helicopters. Actions have been taken to address Helicopter issues including management changes and optimizing production processes. Overall, the company remains confident in its medium-term growth opportunities across its three key pillars of Helicopters, Defense Electronics, and Aeronautics.
Challenges and opportunities for financial market globalisationRedington
This document summarizes an event discussing opportunities and challenges of financial market globalization. It presents examples from China and Japan showing how capital controls have limited China's contribution to global financial integration compared to its contributions to trade and GDP. It also discusses how financial institutions must innovate their business models to maintain growth as traditional sources of revenue decline. Overall, the document examines how globalization brings opportunities like expanded financing sources but also challenges like increased vulnerability to external shocks for financial markets and institutions.
Q2 2016 Earnings Presentation - Bruker CorporationInvestorBruker
- Bruker reported a 6% decline in Q2 revenue to $371.7M, driven primarily by delays in European academic funding and weaker industrial markets. With cost actions, non-GAAP gross profit margin expanded 250 bps to 47.6% and non-GAAP operating margin was flat at 10.8%.
- For H1 2016, revenue was essentially flat at $747.1M. Non-GAAP gross profit margin increased 110 bps to 47.2% and non-GAAP operating margin expanded 120 bps to 11.7%, resulting in 28% growth in non-GAAP EPS.
- Key priorities for 2016 include continuing margin expansion, strengthening business processes, and acceler
- CB&I held an investor day in February 2016 to provide an overview of the company's strategy and performance.
- In 2015, CB&I achieved strong safety and financial results, with adjusted EPS of $5.86 and over $13 billion in revenue.
- The company has a backlog of $23 billion providing visibility into future revenue and earnings. CB&I expects revenue of $11.4-$12.2 billion and EPS of $5.00-$5.50 in 2016.
- CB&I operates through four business groups: Technology, Fabrication Services, Capital Services, and Engineering & Construction. Leaders from each group discussed trends in their industries and initiatives to drive sustained growth.
Afrox reported on its 2015 year-end results with improved performance. Key highlights included a 23% increase in EBITDA to R1,004 million and a 560 basis point increase in ROCE to 16.7%. Safety performance improved with major incidents dropping 70% between 2013-2015. Restructuring efforts were finalized with efficiencies of R144 million realized and costs coming in R47 million lower than expected. The outlook remains positive with the benefits of the turnaround expected to be fully reflected in 2016 financial results through initiatives to complete the new go-to-market model, optimize supply chains and plants, and focus on growth areas.
This investor presentation summarizes Devon Energy's strategy and operations. It highlights Devon's high-quality U.S. oil portfolio, with multi-decade growth potential from key basins like the Delaware Basin, STACK, and Powder River. Devon plans to aggressively improve its cost structure, generate free cash flow above $46 WTI, and return capital to shareholders through stock buybacks and dividend increases. In the Delaware Basin, Devon is focusing on Bone Spring and Wolfcamp projects and achieving record well productivity, with average cumulative oil per well reaching over 300,000 barrels.
Recruiting in the Digital Age: A Social Media MasterclassLuanWise
In this masterclass, presented at the Global HR Summit on 5th June 2024, Luan Wise explored the essential features of social media platforms that support talent acquisition, including LinkedIn, Facebook, Instagram, X (formerly Twitter) and TikTok.
Best practices for project execution and deliveryCLIVE MINCHIN
A select set of project management best practices to keep your project on-track, on-cost and aligned to scope. Many firms have don't have the necessary skills, diligence, methods and oversight of their projects; this leads to slippage, higher costs and longer timeframes. Often firms have a history of projects that simply failed to move the needle. These best practices will help your firm avoid these pitfalls but they require fortitude to apply.
Top mailing list providers in the USA.pptxJeremyPeirce1
Discover the top mailing list providers in the USA, offering targeted lists, segmentation, and analytics to optimize your marketing campaigns and drive engagement.
SATTA MATKA SATTA FAST RESULT KALYAN TOP MATKA RESULT KALYAN SATTA MATKA FAST RESULT MILAN RATAN RAJDHANI MAIN BAZAR MATKA FAST TIPS RESULT MATKA CHART JODI CHART PANEL CHART FREE FIX GAME SATTAMATKA ! MATKA MOBI SATTA 143 spboss.in TOP NO1 RESULT FULL RATE MATKA ONLINE GAME PLAY BY APP SPBOSS
Industrial Tech SW: Category Renewal and CreationChristian Dahlen
Every industrial revolution has created a new set of categories and a new set of players.
Multiple new technologies have emerged, but Samsara and C3.ai are only two companies which have gone public so far.
Manufacturing startups constitute the largest pipeline share of unicorns and IPO candidates in the SF Bay Area, and software startups dominate in Germany.
Company Valuation webinar series - Tuesday, 4 June 2024FelixPerez547899
This session provided an update as to the latest valuation data in the UK and then delved into a discussion on the upcoming election and the impacts on valuation. We finished, as always with a Q&A
B2B payments are rapidly changing. Find out the 5 key questions you need to be asking yourself to be sure you are mastering B2B payments today. Learn more at www.BlueSnap.com.
Part 2 Deep Dive: Navigating the 2024 Slowdownjeffkluth1
Introduction
The global retail industry has weathered numerous storms, with the financial crisis of 2008 serving as a poignant reminder of the sector's resilience and adaptability. However, as we navigate the complex landscape of 2024, retailers face a unique set of challenges that demand innovative strategies and a fundamental shift in mindset. This white paper contrasts the impact of the 2008 recession on the retail sector with the current headwinds retailers are grappling with, while offering a comprehensive roadmap for success in this new paradigm.
Storytelling is an incredibly valuable tool to share data and information. To get the most impact from stories there are a number of key ingredients. These are based on science and human nature. Using these elements in a story you can deliver information impactfully, ensure action and drive change.
buy old yahoo accounts buy yahoo accountsSusan Laney
As a business owner, I understand the importance of having a strong online presence and leveraging various digital platforms to reach and engage with your target audience. One often overlooked yet highly valuable asset in this regard is the humble Yahoo account. While many may perceive Yahoo as a relic of the past, the truth is that these accounts still hold immense potential for businesses of all sizes.
Taurus Zodiac Sign: Unveiling the Traits, Dates, and Horoscope Insights of th...my Pandit
Dive into the steadfast world of the Taurus Zodiac Sign. Discover the grounded, stable, and logical nature of Taurus individuals, and explore their key personality traits, important dates, and horoscope insights. Learn how the determination and patience of the Taurus sign make them the rock-steady achievers and anchors of the zodiac.
Tata Group Dials Taiwan for Its Chipmaking Ambition in Gujarat’s DholeraAvirahi City Dholera
The Tata Group, a titan of Indian industry, is making waves with its advanced talks with Taiwanese chipmakers Powerchip Semiconductor Manufacturing Corporation (PSMC) and UMC Group. The goal? Establishing a cutting-edge semiconductor fabrication unit (fab) in Dholera, Gujarat. This isn’t just any project; it’s a potential game changer for India’s chipmaking aspirations and a boon for investors seeking promising residential projects in dholera sir.
Visit : https://www.avirahi.com/blog/tata-group-dials-taiwan-for-its-chipmaking-ambition-in-gujarats-dholera/
2. 2016 Strategy & Outlook
Keep improving efficiency and preparing the future
Leveraging integrated business model
Tackling short term challenges
Positioning Total strongly for the medium term
Creating long term shareholder value
2
3. 2016 Strategy & Outlook
Short term supply-demand and OECD inventories
Mb/d
Supply-demand outlook to 2020
Mb/d
Industry investments reduced from 700 B$ in 2014 to 400 B$ in 2016
Continued volatility as oil market rebalances
3
3
4
4
5
88
95
Demand
Supply
1H13 1H16
3.1 Bb
Commercial
stocks
50
100
5% decline New supply
5-10 Mb/d
unidentified
20202015
~20 ~25
2011-15 average: 2.7 Bb
3
Source IEA Source Total estimates
4. 2016 Strategy & Outlook
Gas supply-demand
Bcm
Gas prices
$/Mbtu
Overcapacity impacting short term gas prices
Long term outlook for gas and LNG remains favorable
2,000
4,000
5
10
15
20
2013 Aug 2016
Asian spot NBP HH
3% Decline New supply
+2%
per year
20252020
to be
sanctioned
~500 ~900
shale
sanctioned
4
Revising outlook with lower prices Opportunity for robust Gas & LNG projects post 2020
Source Total estimates
5. ► Being excellent at everything we can control
► Safety, Delivery, Cost and Cash
Tackling short-term challenges
6. 2016 Strategy & Outlook
345
Safety, a core value
Cornerstone of operational excellence
Establishing one central and global
HSE organization
A powerful tool with 230 experienced staff
to be even more effective across whole
organization
Continuing to improve safety and
environmental performance in all segments
consecutive days without
a fatal accident
6
7. 2016 Strategy & Outlook
2015-18 Opex reduction
B$
Increasing Opex savings from 3 B$ to 4 B$
Locking in sustainable efficiencies
Achieved
2015
2016 2017
Upstream
Downstream
Corporate
4 B$
2018
>3 B$
1.5 B$
>2.4 B$
7
8. 2016 Strategy & Outlook
Service provider to business units
Total Global Services, new source of efficiency
Creating new economies of scale
across the Group
IT savings of 100 M$ already secured
Increasing joint procurement from
2 B$ to 15 B$ per year
Total Global
Services
Accounting
Purchasing
Facility
management
HR
processes
Training
IT
(2013)
8
9. 2016 Strategy & Outlook
0
50
100
2006 2008 2010 2012 2014 20162016 2017-20
Capex, including resource renewal
B$
Upstream costs, Brent price
Base 100 in 2010, $/b
Sustainable Capex level from 2017
Committed to strong Capex discipline
<19 B$ 17-19 B$Previous guidance:
$/b
Source: IHS
-30%
Upstream Capital Cost Index (UCCI) Brent
18-19 B$
15-17 B$
9
10. 2016 Strategy & Outlook
2.8
Reducing costs on Zinia 2
B$
Zinia 2: marginal deep offshore field made profitable
Capturing deflation and simplifying design
Simplifying subsea layout
Taking advantage of market effect
Optimizing project execution and drilling
Improving fiscal terms ahead of FID
2016
Design
Market
effect
Execution
-50%
2014
2.8 B$
1.4 B$
10
11. 2016 Strategy & Outlook
2014 2015 2016 2017 2020 2021+
Production
Mboe/d
Average growth of 5% per year 2014-20
Strong production growth
9 start-ups in 2015
4 projects already started up in 2016
>10 projects under construction
~50% of production from long plateau in 2020
Including Yemen LNG restarted by 2020
+5%
per year
2014-20
>4%
+1-2%
per year
post-2020
+9%
2.15
2.35
11
12. 2016 Strategy & Outlook
CFFO from Upstream start ups from 2015
B$
CFFO Downstream
B$
Focusing on cash generation
Operational excellence and project delivery
10
2017 2020
10
2012 2016
Maximizing value of existing assets Project delivery fueling Upstream CFFO
ERMI ($/t) 36 35 60 60
+2.5 B$ >7 B$
Brent ($/b)
5.5 5.5NBP ($/Mbtu)
12
13. 2016 Strategy & Outlook
4
Outperforming peers in first half 2016
Strong performance across all segments
-50%
-20%
10%
-2.00%
5.00%
Adjusted net income - B$ Return on Equity
Cash flow from operations before working capital
changes*
Upstream production growth*
* % change first half 2016 / 2015 Total, BP, Chevron, ExxonMobil, Shell / BG pro forma,
based on public data
5%
-2%
13
14. Positioning Total strongly for
the medium term
► Lowering breakeven of oil portfolio
► Expanding along gas value chain
► Capitalizing on customer-focused culture
► Developing low-carbon energy business
15. 2016 Strategy & Outlook
Reducing exposure on high cost assetsAdding low cost assets
Oil, positioning Upstream on low cost assets
Managing the portfolio to reduce breakeven
Al-Shaheen, 90 kb/d*
Qatar, Total 30%
Giant conventional offshore oil field
ADCO, 160 kb/d*
UAE, Total 10%
Giant onshore oil fields
Libra, >100 kb/d*
Brazil, Total 20%
Giant deep offshore oil field
Fort Hills, 10% divested in 2015
Canada
Oil sands
Marginal fields
North Sea, Africa
Mature offshore oil fields
15
* Plateau production, Total share (SEC)
16. 2016 Strategy & Outlook
Restructuring Downstream baseBuilding on Downstream strength
Oil, focusing Downstream on best-in-class assets
Consolidating 7 B$ cash flow from operations and ROACE >20%
Satorp
Saudi Arabia, Total 37.5%
World-class, delivering as expected
Daesan
South Korea, Total 50%
New partnership enabling further
development
Egypt, Kenya, Tanzania, Uganda
M&S leadership in Africa
Highly accretive acquisitions in retail
-20% European R&C capacity
Achieved end-2016
Carling, La Mède, Lindsey restructuring
Refocusing M&S European portfolio
Developing in countries with strong
market share
Monetized Turkey, UK, Switzerland
16
17. 2016 Strategy & Outlook
Yamal LNG - Russia
Total 20%, 130 kboe/d*
Ichthys LNG - Australia
Total 30%, 110 kboe/d*
Growing integrated gas, Upstream
Diversified portfolio of gas developments
West of Shetlands - UK
Total 60%, 50 kboe/d*
Barnett - United States
Total 100%**, 80 kboe/d*
17
* Plateau production, Total share (SEC) ** subject to preemption close out
18. 2016 Strategy & Outlook
Launching 1 Mt/y ethane side cracker at Port ArthurMarketing efforts to access new customers
Growing integrated gas, Downstream
Capturing margin along full value chain
Developing LNG customer base
Expanding B2B and B2C marketing
18
Expansion opportunity with low-cost gas feedstock
19. 2016 Strategy & Outlook
M&S growing retail and lubricants at 4% per year
Capitalizing on customer-focused culture
#2 in retail outside North America
Number of retail stations, Total and peers*
Retail market share in Africa
Strong brand
awareness25%
2012 2015 2020
Retail network
Lubricants
30,000
>4 million clients
per day
>15,000 stations
>10,000 shops
Present in
130 countries
* Total, BP, Chevron, ExxonMobil, Shell
19
20. 2016 Strategy & Outlook
Dedicated organization to grow gas and renewables
~5% of 2016 capital employed
Developing a profitable segment in low-carbon business
Developing downstream gas markets
Building an integrated business in
fast growing solar
Energy storage, key to growing
profitable renewables
Adapting pace of growth to deliver profits
1 B$/y cash flow from operations by 2020
Gas and power
marketing
0.5 B$
Energy
efficiency
services
Solar
3 B$
Gas and power
trading
1.5 B$
Energy storage
1 B$
20
21. 2016 Strategy & Outlook
5
Asset sales & acquisitions
$B
Implementing strategy through portfolio management
Aligning asset base with ambition in oil,
gas and renewables
Monetizing non-core assets
Maintaining strict discipline for acquisitions
2015 2016 2017
ADCO
Novatek
Saft
GAPCO
Lampiris
Barnett
Fort Hills
FUKA
Geosel
Laggan
Schwedt
Turkey
Atotech
Kharyaga
US infra-
structure
AcquisitionsAsset sales
21
22. 2016 Strategy & Outlook
Areas of focus to reduce CO2 emissions
Bt CO2
Gradually decreasing the carbon intensity of our production mix
Integrating 2°C roadmap into strategy
Focusing on oil projects with low breakevens
Prioritizing gas projects
Exiting coal business
Growing in renewables and
low-carbon business
50
2015 2035
Renewable
energies
Energy
efficiency
Optimized
energy mix
Source: IEA (2015), Energy Technologies Perspectives 2015
Business as usual
2°C scenario
22
23. ► To be the most profitable European integrated major
Creating shareholder value
24. 2016 Strategy & Outlook
Cash flow
B$
Reducing cash breakeven
2016 cash flow breakeven at 60 $/b including
2 B$ net asset sales
CFFO covering 2017 Capex (including resource
renewal) and dividend cash-out at 55 $/b
Ending discounted scrip dividend in 2017
with Brent at 60 $/b
30
60 60
ERMI ($/t) 25 25
NBP ($/MMbtu) 5.5 5.5
45
35
4.2
Net asset salesCFFO
Brent ($/b)
50 $/b
2016 2017 2020
80 $/b
24
25. 2016 Strategy & Outlook
Net debt-to-equity ratio
%
Resilient to volatile price environment
Priority to profitability and strong balance sheet
Targeting ROE >10% at 60 $/b
Long term gearing guidance of 20%
Buyback scrip shares
2014 2015 June 2016
30%
99 $/bBrent 40 $/b52 $/b
25
26. 2016 Strategy & Outlook
100
Total and peers share price with dividend reinvested and Brent
Base 100, January 2013
Attractive return in a volatile market
5.8% dividend yield over past 12 months
Brent
Peers*
Jan 2013 Aug 2016Jan 2014 Jan 2015 Jan 2016
* BP, Chevron, ExxonMobil, Shell
26
27. 2016 Strategy & Outlook
Keep improving efficiency and preparing the future
Leveraging integrated business model
Tackling short term challenges
Positioning Total strongly
for the medium term
Creating long term shareholder value
Committed to shareholder return
27
29. 2016 Strategy & Outlook
Operational excellence Profitability & cash
Maximizing returns from existing assets
Growing Upstream value
Cost discipline
29
30. 2016 Strategy & Outlook
85%
90%
95%
2014 2015 YTD 2016 2017
Production efficiency* – operated assets
%
Sustained efficiency gains across our operations
Improving operational performance
10
West Africa deep offshore drilling
Non-productive time %
13.4
16.0
17.8
2014 2015 2016 YTD
-25%~4%
30
* Actual production divided by capacity
31. 2016 Strategy & Outlook
10
2014 2015 2016 2018
Operating costs (ASC932)
$/boe
Operating costs (ASC932) for Total and peers
$/boe
Reinforcing competitive advantage on costs
Further driving down E&P Opex
10
20
2010 2011 2012 2013 2014 2015
~6
9.9
7.4
~5
Shell
Chevron
BP
ExxonMobil
-50%
31
32. 2016 Strategy & Outlook
Consistently challenging our processes
2014-16 UK opex savings
Systematic and disciplined approach delivering sustainable results
Cementing a lean cost culture
Setting global best practices
• Angola FPSOs joint operating model: -100 M$
Streamlining maintenance processes
• Less works contracted out: -100 M$
Structure costs
• Reorganization in Nigeria: -150 M$
Logistics
• From 12 to 6 helicopters in West Africa: -100 M$
>300 M$ Savings
Field
OperationsStructure
Supply Chain
32
33. 2016 Strategy & Outlook
Examples of reductions achieved through renegotiation and new tenders
Capturing further cost deflation in 2016
Marine logistics
Seismic acquisition
Well services
Rigs
Rotating equipment
Subsea services
Tubulars
Operations & maintenance
Engineering
-60% -50% -40% -30% -20% -10% 0%
Sept 2015
Sept 2016
33
34. 2016 Strategy & Outlook
>900 kboe/d from start-ups and sanctioned projects
Delivering project start-ups
Incahuasi
Vega Pleyade
West of Shetlands Martin Linge
Kashagan
Moho
Tempa Rossa
Egina
Ofon Ph 2
Surmont 2
Yamal LNG
Termokarstovoye
Ichthys LNG
West Franklin 2
Lianzi
Libra EWT
Fort Hills
Angola LNG
Kaombo
50-100 kboe/d
<50 kboe/d
>100 kboe/d
2015-2016
2017+
Dalia Ph1a
Total share
34
Timimoun
Gladstone LNG
Eldfisk 2
35. 2016 Strategy & Outlook
Al Shaheen – redeveloping giant mature field
Total 30%, Qatar
25-year concession effective mid-2017
300 kb/d, long plateau
Low breakeven oil project, free cash flow
positive from year one
Maximizing oil recovery through reservoir
expertise and technical know-how
35
36. 2016 Strategy & Outlook
Yamal – delivering worldclass LNG project
Total 20%, Russia
16.5 Mt/y capacity, 3 LNG trains
>95% of LNG committed
Targeting start-up by end-2017
• First train ~80% complete
• >90% of wells drilled for start-up
>18 B$-equivalent project financing secured
36
37. 2016 Strategy & Outlook
Libra – unlocking deep offshore value
Total 20%, Brazil
3-4 Bb resources in North West panel alone
with excellent well productivity
Start-up of 50 kb/d EWT vessel in 2017
Phased development with FID of first
FPSO planned in 2017
37
38. 2016 Strategy & Outlook
Nairobi
Tanga
Lamu
Hoima
Kampala
Kenya
Uganda
Tanzania
Uganda – advancing giant onshore field
Total 33%
Agreement on export pipeline route
through Tanzania
25-year production license awarded
Moving toward FID, capturing deflation
38
40. 2016 Strategy & Outlook
Global power generation, source IEA
TWh
Gas, renewable and power markets becoming more integrated
From gas to power
30,000 Gas becoming largest primary source
of power
Renewables growing by >10% per year
New market trends
• Energy efficiency
• Distributed generation
• Smart energy
Coal
Oil
Wind
Nuclear
Hydro
Biofuels
Gas
Solar
2015 2030
2°C
1.5%
CAGR
40
41. 2016 Strategy & Outlook
Building on a base of quality assets
Developing a complementary portfolio
~5% of 2016 capital employed
Global trading for gas and LNG
Gas and power B2B marketing in Europe
and Lampiris platform for B2C
High quality SunPower platform
Saft leadership in high technology batteries
Energy
efficiency
services
Gas and power
marketing
0.5 B$
Solar
3 B$
41
Gas and power
trading
1.5 B$
Energy storage
1 B$
42. 2016 Strategy & Outlook
40
80
Integrated gas portfolio
Bcm/y
Capturing full value chain margin
Growing integrated gas portfolio
Gas representing half of Group reserves
Growing portfolio, developing new markets
• Signed 2 Mt/y long term LNG contracts in 2016
• Offering more flexibility to customers
• Providing long term visibility for Upstream
Expanding B2B and B2C marketing
x2
Regas
Gas
marketing
Gas
production
Liquefaction
+50%x2 +70%+20%
Gas & LNG
trading
20202015
42
43. 2016 Strategy & Outlook
LNG new markets
Mt/y
Floating Storage Regasification Units (FSRU)
World overview
Unlocking new LNG demand
Opening new markets
150
FSRUs enabling new LNG markets Successive waves of new demand
Under constructionExisting Proposed 2010 2015 2020 2025
Southeast Asia
Latin America
Middle East
Africa
43
Source Total estimates
44. 2016 Strategy & Outlook
Number of B2B sites suppliedGrowing presence in European B2B and B2C
Expanding gas and power marketing
Growing demand for combined offering
800,000
2012 2015 2020
>x7
DevelopingExisting B2C
44
45. 2016 Strategy & Outlook
Leading integrated player
SunPower, a high quality platform in solar
Solar cell and panel production
Decentralized power generation
Power plant design, construction
and operation
Wide range
of products
Supplying all
market segments
748 MWp Solar Star
World’s largest solar
power plant
12% market share
#2 in US
residential
Deploying
350-450 MW in 2016
Operating >1 GW
1.3 GW
Solar modules
produced in 2015
25%
World record
cell efficiency
>1 GW
in development
45
46. 2016 Strategy & Outlook
Saft 2015 cash flow allocation
M$
Solid cash generation to boost future growth
Energy storage, key to growing profitable renewables
100 years of history
850 M$ revenue in 2015
• Leadership on >75% of revenue base
• 9% invested in R&D, 3 main technologies
Free cash flow available to increase investment
Saft technology well positioned for
Energy Storage Solutions
110
Cash in Cash out
Capex
Dividend
and
buybacks
Other
CFFO
46
47. 2016 Strategy & Outlook
1
2016 2020
Cash flow from operations
B$
Leveraging integrated portfolio to maximize value
Adapting pace of growth to deliver profits
Expanding downstream gas
Building a profitable business in
fast growing renewables
1 B$ CFFO per year by 2020
47
48. 2016 Strategy & Outlook
Disclaimer
This document may contain forward-looking information on the Group (including objectives and
trends), as well as forward-looking statements within the meaning of the Private Securities
Litigation Reform Act of 1995, notably with respect to the financial condition, results of
operations, business, strategy and plans of TOTAL. These data do not represent forecasts
within the meaning of European Regulation No. 809/2004.
Such forward-looking information and statements included in this document are based on a
number of economic data and assumptions made in a given economic, competitive and
regulatory environment. They may prove to be inaccurate in the future, and are subject to a
number of risk factors that could lead to a significant difference between actual results and
those anticipated, including currency fluctuations, the price of petroleum products, the ability to
realize cost reductions and operating efficiencies without unduly disrupting business
operations, environmental regulatory considerations and general economic and business
conditions. Certain financial information is based on estimates particularly in the assessment of
the recoverable value of assets and potential impairments of assets relating thereto.
Neither TOTAL nor any of its subsidiaries assumes any obligation to update publicly any
forward-looking information or statement, objectives or trends contained in this document
whether as a result of new information, future events or otherwise. Further information on
factors, risks and uncertainties that could affect the Company’s financial results or the Group’s
activities is provided in the most recent Registration Document filed by the Company with the
French Autorité des Marchés Financiers and annual report on Form 20-F filed with the United
States Securities and Exchange Commission (“SEC”).
Financial information by business segment is reported in accordance with the internal reporting
system and shows internal segment information that is used to manage and measure the
performance of TOTAL. Performance indicators excluding the adjustment items, such as
adjusted operating income, adjusted net operating income, and adjusted net income are meant
to facilitate the analysis of the financial performance and the comparison of income between
periods. These adjustment items include:
(i) Special items
Due to their unusual nature or particular significance, certain transactions qualified as "special
items" are excluded from the business segment figures. In general, special items relate to
transactions that are significant, infrequent or unusual. However, in certain instances,
transactions such as restructuring costs or asset disposals, which are not considered to be
representative of the normal course of business, may be qualified as special items although
they may have occurred within prior years or are likely to occur again within the coming years.
(ii) Inventory valuation effect
The adjusted results of the Refining & Chemicals and Marketing & Services segments
are presented according to the replacement cost method. This method is used to assess
the segments’ performance and facilitate the comparability of the segments’ performance with
those of its competitors.
In the replacement cost method, which approximates the LIFO (Last-In, First-Out) method, the
variation of inventory values in the statement of income is, depending on the nature of the
inventory, determined using either the month-end price differentials between one period and
another or the average prices of the period rather than the historical value. The inventory
valuation effect is the difference between the results according to the FIFO (First-In, First-Out)
and the replacement cost.
(iii) Effect of changes in fair value
The effect of changes in fair value presented as an adjustment item reflects for some
transactions differences between internal measures of performance used by TOTAL’s
management and the accounting for these transactions under IFRS.
IFRS requires that trading inventories be recorded at their fair value using period-end spot
prices. In order to best reflect the management of economic exposure through derivative
transactions, internal indicators used to measure performance include valuations of trading
inventories based on forward prices.
Furthermore, TOTAL, in its trading activities, enters into storage contracts, which future effects
are recorded at fair value in Group’s internal economic performance. IFRS precludes
recognition of this fair value effect.
The adjusted results (adjusted operating income, adjusted net operating income, adjusted net
income) are defined as replacement cost results, adjusted for special items, excluding the effect
of changes in fair value.
Cautionary Note to U.S. Investors – The SEC permits oil and gas companies, in their filings with
the SEC, to separately disclose proved, probable and possible reserves that a company has
determined in accordance with SEC rules. We may use certain terms in this presentation, such
as resources, that the SEC’s guidelines strictly prohibit us from including in filings with the SEC.
U.S. investors are urged to consider closely the disclosure in our Form 20-F, File N° 1-10888,
available from us at 2, Place Jean Millier – Arche Nord Coupole/Regnault - 92078 Paris-La
Défense Cedex, France, or at our website: total.com. You can also obtain this form from the
SEC by calling 1-800-SEC-0330 or on the SEC’s website: sec.gov.
Slide 6: Safety figures as of September, 21, 2016.
48