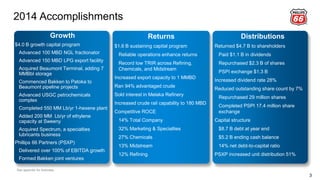
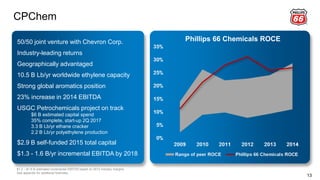
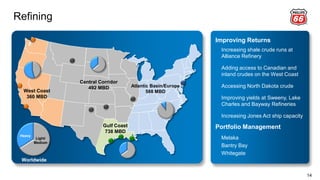
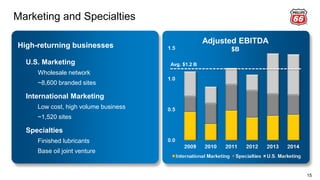
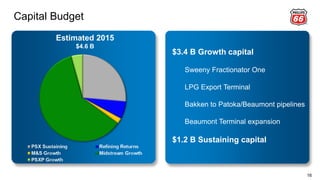
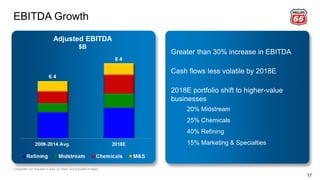
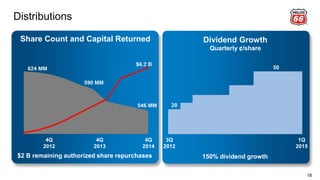
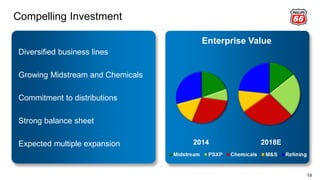
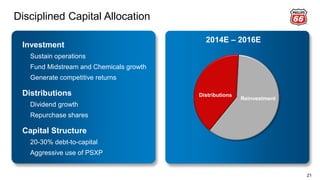
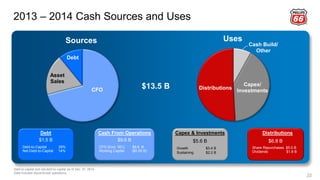
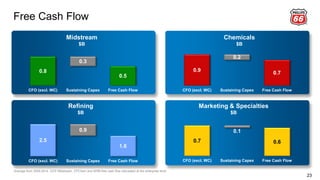
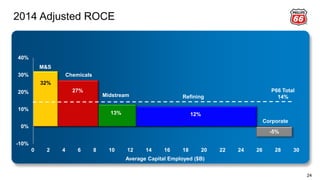
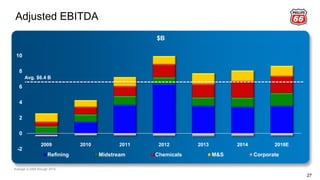
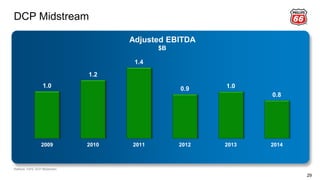
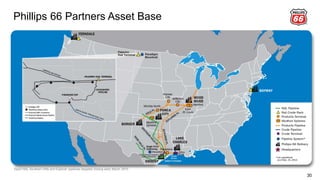
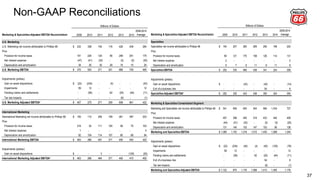
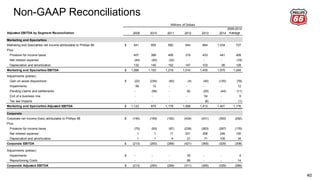
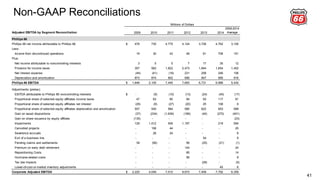
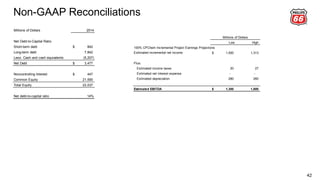
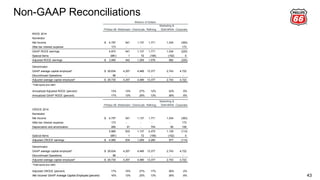
Greg Garland, Chairman and CEO of Phillips 66, discussed the company's accomplishments in 2014 and outlook. Key points included executing a $4 billion capital program, returning $4.7 billion to shareholders, and increasing the dividend rate by 28%. Garland projected over 30% growth in adjusted EBITDA by 2018 through expanding midstream and chemicals businesses. He emphasized Phillips 66's commitment to growing distributions and maintaining a strong balance sheet.
The document summarizes Greg Garland's presentation at the 2015 Credit Suisse Energy Summit. Some key points include:
- Phillips 66 achieved strong execution and returns in 2014 through growth projects, reliable operations, and returning $4.7 billion to shareholders.
- The company is well positioned for continued growth in midstream and chemicals through major projects coming online in 2015-2018.
- Refining will focus on improving yields and accessing advantaged crudes while chemicals benefits from low ethane prices and projects.
- The portfolio is expected to shift toward higher-value midstream, chemicals and marketing businesses by 2018 with over 30% EBITDA growth projected.
Phillips 66 executed on its growth strategy in 2014 through a $4 billion capital program. This included expanding midstream infrastructure and chemical plant capacity. The company also improved operating excellence across its businesses. Looking ahead, Phillips 66 plans additional growth investments in midstream and chemicals through 2018 expected to increase adjusted EBITDA. The company will continue returning capital to shareholders through dividends and share repurchases while maintaining a strong balance sheet.
Teekay Corporation presented its third quarter 2021 earnings. Key highlights included:
- Total adjusted EBITDA was $165 million, down slightly from $172 million last quarter.
- Consolidated adjusted net income was $95 thousand, up from $30 thousand last quarter.
- Teekay LNG's pending merger with Stonepeak was announced, valued at $6.2 billion including Teekay Parent receiving $640 million in proceeds.
- A new long-term contract was secured to provide marine services to Australian government vessels.
This document provides an overview of the Teekay Group's investor day presentation on November 14, 2019. It discusses Teekay Corporation's growing cash flows and improving profitability, strengthening balance sheets, simplifying and focusing on its core gas and tanker businesses. It highlights the stable and growing gas cash flows from long-term contracts and upside potential as the tanker market strengthens. The presentation outlines Teekay's strategic focus on gas shipping and oil shipping over time and the positive long-term outlook for energy shipping due to rising global energy demand and increasing dislocation between supply and demand areas, driving LNG and oil shipping growth.
This presentation from Phillips 66 discusses the company's strategy and outlook across its business segments. The key points are:
1) Phillips 66's strategy focuses on operating excellence, growth, returns and distributions through a high-performing organization.
2) The company sees opportunities for growth in its midstream business by expanding its transportation network and utilizing Phillips 66 Partners LP.
3) In chemicals, Phillips 66 aims to grow its joint venture CPChem and capitalize on the advantage of low-cost North American feedstocks for ethylene production.
4) The refining business will enhance returns by processing more advantaged crudes, expanding export capacity, and decreasing costs.
- Teekay Corporation reported financial results for the fourth quarter and full year of 2021. Q4 results were stronger than Q3 due to a modest improvement in spot tanker rates. However, full year 2021 results were lower than 2020 due to a weak tanker market.
- Teekay completed the sale of its interests in Teekay LNG to Stonepeak, generating $641 million in proceeds. Teekay is now largely debt free with a net cash position over $300 million.
- Looking ahead, Teekay expects a decrease in Q1 2022 adjusted net income versus Q4 2021 primarily due to fewer spot tanker days and the sale of its LNG interests. However, tanker
The document discusses EnLink Midstream Partners, LP, a master limited partnership focused on midstream energy services. It notes that EnLink has a stable cash flow due to 95% of contracts being fee-based and 50% from long-term Devon contracts. It also highlights EnLink's organic growth strategy through expansion projects in regions like South Louisiana, West Texas, and Ohio River Valley. Finally, it identifies four avenues for future growth: dropdowns from sponsor Devon Energy, organic expansion projects, third-party acquisitions, and potential new basin development with Devon.
The presentation provides an outlook for Teekay Tankers' Q1 2022 financial results. Net revenues are expected to decrease due to fewer available spot shipping days from vessel sales and more scheduled drydocking days. Time-charter hire expenses will increase slightly due to a new in-chartered vessel. Depreciation expenses will decrease as a result of vessel sales. General and administrative costs will be up modestly. Overall, financial results are forecasted to decline compared to Q4 2021 due to reduced spot shipping activity. However, the company maintains a strong liquidity position and outlook for tanker market recovery remains positive.
Teekay LNG Partners reported record-high 2020 results, with adjusted net income up 39% and total adjusted EBITDA up 11% from 2019. The company also announced a 15% increase to its common unit distribution commencing in Q1 2021. Teekay LNG's fleet has 97% of available days fixed for 2021 and 89% fixed for 2022, providing stable cash flow. Global demand for LNG is expected to grow substantially over the next decades, driven by Asia and the transition away from coal, supporting strong long-term LNG shipping dynamics.
Teekay Corporation Fourth Quarter and Fiscal 2013 Earnings PresentationTeekay Corporation
Teekay Corporation reported its financial results for the fourth quarter of 2013. Key highlights included:
- Teekay LNG and Teekay Offshore both increased their cash distributions by 2.5% in Q4.
- Teekay Parent agreed to sell its last four directly owned tankers to the new joint venture Tanker Investments Ltd.
- Construction of the Petrojarl Knarr FPSO project remains on schedule, with the unit expected to begin its charter in late Q4 2014.
- The company reported consolidated adjusted net income of $1.1 million, compared to $2.9 million in Q4 2012.
Teekay Tankers reported financial results for the first quarter of 2021 that showed an increase in adjusted EBITDA compared to the previous quarter. While spot tanker rates remained weak in Q1 2021, rates spiked in March due to bad weather and the Suez Canal blockage. Looking forward, several key indicators point to a tanker market recovery in the second half of 2021 as oil demand increases and inventories normalize. Teekay Tankers maintains a strong financial position with $372 million in liquidity to capitalize on an expected market recovery.
Teekay Corporation reported stronger financial results in the first quarter of 2021 compared to the previous quarter, despite ongoing weakness in tanker markets due to the COVID-19 pandemic's impact on oil demand. Total adjusted EBITDA was $202 million in Q1-21 compared to $201 million in Q4-20. Consolidated adjusted net income was $11 million, or $0.11 per share, in Q1-21 compared to $3 million, or $0.03 per share, in Q4-20. Teekay has made significant progress winding down its FPSO segment and expects to reduce accrued asset retirement obligations. Teekay LNG maintained a high fleet utilization rate and increased its
The document is a presentation by Teekay LNG Partners providing an overview of their recent financial and operational performance as well as outlook. Some key points:
- Teekay LNG reported adjusted net income of $58.9 million for Q3 2020 and their earnings are expected to increase in Q4 2020.
- Their liquidity was $431 million as of the end of Q3 2020 and their financial leverage continues to decrease.
- Over 96% of their LNG fleet is fixed for 2021 providing stable long-term cash flows.
- Natural gas is expected to remain a key part of the global energy transition and increasing demand for LNG is driving the need for LNG shipping.
This presentation by Barry Davis, President and CEO of NAPTP, provides an overview of NAPTP and forward-looking statements. It discusses non-GAAP financial measures used by EnLink Midstream such as adjusted EBITDA, gross operating margin, and segment cash flows. It then summarizes EnLink Midstream's assets including gas gathering pipelines, processing plants, NGL transportation and fractionation facilities. Finally, it provides brief biographies of members of EnLink Midstream's management team.
This document provides an overview of EnLink Midstream and its strategy for growth. It begins with forward-looking statements and definitions of non-GAAP terms. It then summarizes EnLink's assets and geographic footprint. The main points are:
1) EnLink's strategy is to provide midstream services to customers like Devon Energy, focus on fee-based contracts, leverage Devon sponsorship for growth opportunities, and pursue organic expansion projects.
2) Growth opportunities include potential dropdowns from Devon of $375 million in assets by 2017, expanding in areas where Devon is growing like the Permian Basin and Bearkat project, and organic projects like the Cajun-Sibon expansion.
3) The
Teekay Tankers presented its third quarter 2021 earnings. Key highlights included:
- Adjusted EBITDA of ($15.8) million, down from the previous quarter, due to weak spot tanker rates.
- Pro forma liquidity of $209 million providing financial resilience.
- Tanker market fundamentals remain positive with an expected recovery, supported by increasing oil demand and tight fleet supply.
- Spot tanker rates improved in early Q4 but remained weak in Q3 due to oil demand impacts from COVID variants and OPEC+ supply cuts.
Teekay Corporation held an earnings presentation for Q1-2016. It reported adjusted net loss of $6 million compared to adjusted net income of $16 million in Q1-2015. Teekay and its daughter companies Teekay Tankers, Teekay Offshore, and Teekay LNG are pursuing various financing initiatives to strengthen their balance sheets and address near-term debt maturities. These initiatives include refinancing existing debt facilities, obtaining new debt financing, selling assets, and issuing equity. Successful completion of the financing plans is expected to improve the companies' liquidity and financial positions.
A quarterly report from EQT Corporation updating investors and others on production and the company's financial postion. During 2Q13, EQT was the second company ever to hit 1 billion cubic feet per day of Marcellus Shale gas production. They also announced they will drill up 22 Upper Devonian Shale wells in 2013--a shale layer a few hundred feet above the Marcellus.
- Teekay Tankers reported an adjusted net loss of $40.7 million for Q4-2020, compared to an adjusted net income of $3.1 million in Q3-2020. This was primarily due to lower spot tanker rates in Q4-2020.
- The company reduced its net debt by $419 million in 2020 to $510 million through strong cash flows and asset sales. It had liquidity of $373 million as of December 31, 2020.
- Spot tanker rates remained weak in Q4-2020 due to the second wave of COVID-19 and oversupply of tankers returning from floating storage. Rates are expected to improve in the second half of 2021 as oil
The document summarizes a strategic partnership between Teekay Offshore Partners L.P. and Brookfield Asset Management. Brookfield will invest $640 million in TOO's equity, significantly strengthening TOO's balance sheet and improving liquidity. The investment will fully finance TOO's existing growth projects, extend debt maturities, and position TOO for future growth opportunities through Brookfield's operational expertise and access to capital. The partnership creates one of the world's strongest offshore infrastructure companies by combining TOO's operational platform with Brookfield's global business reach.
Teekay Offshore Partners reported its Q1-2016 earnings. Key highlights included generating $62 million in distributable cash flow and $166.1 million in cash flow from vessel operations. The company is nearing completion of financing initiatives to address its 2016-2017 funding requirements and fully finance $1.6 billion in growth projects through 2018. This includes refinancing debt, issuing equity, and potentially deferring deliveries of two new units. The company expects these initiatives to extend its debt maturity runway to late-2018 and significantly delever its balance sheet over time.
2014 RBC Capital Markets’ MLP Conferenceir_jpenergy
JP Energy Partners LP is a midstream MLP focused on infrastructure solutions for liquid petroleum products. It has an integrated and diversified platform with stable cash flows from fee-based and margin-based operations that have low commodity price sensitivity. The company has a proven ability to complete acquisitions and develop organic projects, and sees significant growth opportunities through potential drop-downs from its affiliates and organic projects.
This document summarizes Chevron's fourth quarter 2008 earnings conference call. It discusses Chevron's Q4 2008 earnings of $4.9 billion and earnings per share of $2.44. It also provides details on Chevron's 2008 return on capital employed, debt ratio, and share repurchases. The document reviews Chevron's Q4 2008 earnings performance across its upstream, downstream, and other segments and discusses its 2009 capital and exploratory budget and production outlook.
PVA is focused on increasing its oil and liquids exposure through continued development of its Eagle Ford acreage in Texas, where it is seeing excellent early results. It aims to add more Eagle Ford and other oily inventory to accelerate cash flow growth. PVA will retain its large gas assets as optionality given current gas prices. It maintains a solid financial position with ample liquidity to fund its capital expenditure plans through 2012 as it transitions to more oil-weighted production and cash flows.
TGI is the largest natural gas pipeline system in Colombia, transporting over 50% of the country's gas. It has a stable regulated business model and strong financial performance. Some key updates include credit rating upgrades, dividend payments, and the completion of a hedge restructuring. TGI has a solid operational track record with over 3,957 km of pipelines and growing demand for natural gas in Colombia supported by significant gas reserves.
TGI is the largest natural gas pipeline system in Colombia, with a network of nearly 4,000 km that transports over half of the country's gas consumption. It has experienced strong growth since its privatization in 2006. TGI has a stable and predictable cash flow due to regulated tariffs indexed to the US dollar. The document provides an overview of TGI, its history, financial and operating highlights including growing revenues, EBITDA and consistent financial performance with low leverage. It also discusses the positive Colombian economic environment and TGI's experienced management team and shareholders.
Teekay Corporation provides a Q3 2017 outlook for its consolidated financial results, expecting a net revenue increase of $2-4 million across its segments. Operating expenses are expected to increase $10-6 million primarily due to planned maintenance. Recent transactions have strengthened Teekay's financial position by fully financing growth projects and reducing debt. The outlook expects each daughter company to benefit from market recoveries in their respective sectors.
Phillips 66 reported adjusted earnings of $913 million for the fourth quarter of 2014, down from $1.14 billion in the third quarter. Refining adjusted earnings declined due to lower margins, while chemicals adjusted earnings increased as the Port Arthur plant resumed operations. Marketing and specialties continued strong performance. For the full year, adjusted earnings were $3.78 billion, up 4% from 2013, driven by improved results in midstream and chemicals. The company continued its balanced capital program and shareholder distributions in the fourth quarter.
- Phillips 66 provides an investor update on its strategy, operations, and financial results. It aims to enhance safety, reliability and environmental stewardship while protecting shareholder value.
- The company is reshaping its portfolio by capturing growth opportunities in midstream and chemicals and enhancing returns from existing assets through efficiency improvements. It is committed to growing distributions and maintaining financial strength.
- Phillips 66 plans $3.9 billion in capital investments in 2016, including $2.6 billion for growth projects focused on its expanding midstream business and fee-based assets suitable for dropdown to Phillips 66 Partners. It expects adjusted EBITDA to grow 45% to $9.3 billion by 2018 driven by its midstream, chemicals and marketing
Phillips 66 reported adjusted earnings of $1.6 billion for the third quarter of 2015. The company's adjusted earnings per share were $3.02. Operating cash flow excluding working capital was $1.5 billion for the quarter. Capital expenditures and investments totaled $1 billion. The company's adjusted net debt-to-capital ratio was 12% at the end of the third quarter.
Phillips 66 reported adjusted earnings of $710 million for the fourth quarter of 2015. Refining adjusted earnings declined from the previous quarter due to lower realized margins. Midstream earnings increased due to higher volumes on transportation pipelines and contributions from PSXP. Chemicals earnings decreased because of planned turnaround impacts and lower cash chain margins. Marketing and Specialties earnings declined slightly from favorable global margins in the previous quarter.
- Phillips 66 Partners announced a $314 million 2016 organic growth plan including projects to expand its Bayou Bridge Pipeline and build the Sacagawea Pipeline.
- The Bayou Bridge Pipeline expansion will increase crude oil transport from Nederland, Texas to refineries in Lake Charles and St. James, Louisiana.
- The Sacagawea Pipeline will connect Bakken crude oil production to a rail facility in North Dakota, providing additional logistics options for shippers.
- Phillips 66 is a diversified energy manufacturing and logistics company with refining, midstream, chemicals, and marketing and specialties businesses.
- It has a portfolio of leading downstream businesses that generate resilient cash flow through the commodity cycle.
- The company pursues growth in its midstream and chemicals businesses while maintaining financial flexibility and returning capital to shareholders.
The document provides an investor update on Phillips 66's second quarter of 2015. It discusses the company's diversified portfolio of downstream businesses, resilient cash flow, disciplined capital allocation, and growth in chemicals and midstream. It highlights financial results for the second quarter including adjusted EBITDA of $2.1 billion, capital expenditures of $1.2 billion, and distributions of $0.6 billion. The document also summarizes strategies and growth opportunities across Phillips 66's various business segments.
- The presentation discusses Phillips 66's strategy of pursuing operating excellence, growth, and returns through 2018. It outlines plans for growing earnings in midstream, chemicals, and refining by $2.5 billion through capital projects and acquisitions. Phillips 66 expects to enhance shareholder value by increasing dividends and share repurchases with strong free cash flow.
- CB&I held an investor day in February 2016 to provide an overview of the company's strategy and performance.
- In 2015, CB&I achieved strong safety and financial results, with adjusted EPS of $5.86 and over $13 billion in revenue.
- The company has a backlog of $23 billion providing visibility into future revenue and earnings. CB&I expects revenue of $11.4-$12.2 billion and EPS of $5.00-$5.50 in 2016.
- CB&I operates through four business groups: Technology, Fabrication Services, Capital Services, and Engineering & Construction. Leaders from each group discussed trends in their industries and initiatives to drive sustained growth.
1) Phillips 66 reported adjusted earnings of $834 million for the first quarter of 2015 compared to $913 million in the previous quarter. Lower results were seen in the company's Midstream, Chemicals, and Refining segments.
2) Marketing and Specialties earnings remained relatively stable, while Corporate and Other costs increased compared to the previous quarter.
3) Phillips 66 generated $880 million in operating cash flow excluding working capital changes and spent $1.1 billion on capital expenditures and investments during the first quarter.
This document provides an overview of Phillips 66's strategy and growth plans across its various business segments, including refining, midstream, chemicals, and marketing and specialties. Key points include growing adjusted EBITDA in midstream and refining logistics to $2.3 billion by 2018 through organic projects and acquisitions, expanding chemicals capacity through CPChem's $6.5-7 billion growth program, and allocating capital to sustain operations, fund growth, generate returns, and increase distributions.
The document summarizes Clayton Reasor's presentation at the UBS Global Oil and Gas Conference on Phillips 66's corporate strategy, operations, and financial performance. Key points include growing through infrastructure projects and USGC petrochemical expansion, maintaining cost discipline, increasing returns through advantaged crude and export growth, and growing distributions through rising dividends. Phillips 66 aims to create value through operational excellence, growth, high returns, and distributions to shareholders.
Phillips 66 Partners reported $1.8 billion in adjusted EBITDA and $1.1 billion in capital expenditures for the first quarter of 2015. The company acquired interests in three pipeline assets for $1.1 billion, which are expected to generate $115 million in EBITDA for 2015. Phillips 66 Partners also announced $275 million in organic growth projects, focused on expanding its Bakken and Eagle Ford midstream infrastructure.
This investor presentation provides an update on Phillips 66's strategy and growth opportunities through 2018. Key points include plans to enhance returns across refining, midstream, chemicals and marketing businesses for $2.5 billion in EBITDA growth. Major midstream projects include expanding the Sweeny hub and building pipelines. Chemical projects include expanding US Gulf Coast facilities. Refining improvements aim to increase margins. Marketing will focus on fuel brands and high-value exports.
This document provides an overview and summary of The AES Corporation's presentation at the Wolfe Research Power & Gas Leaders Conference on September 18, 2014. The presentation discusses AES' diversified portfolio of generation and utility businesses, its strategy to reduce risk, drive growth and enhance returns, and its outlook for 2014-2018 which includes adjusted EPS growth of 4-6% through 2015 and 6-8% in 2017-2018.
ET April 2023 Investor Presentation_Final.pdfssuser6f254f1
Energy Transfer held an investor presentation in April 2023 to provide operational and financial updates. The presentation contained forward-looking statements about future performance and discussed recent record volumes in midstream operations. It also highlighted strategic acquisitions that expanded the company's Permian Basin footprint and provided an overview of Energy Transfer's integrated national asset portfolio.
Victory Energy (VYEY) Investor PresentationDerek Gradwell
Victory Energy Corporation is a public oil and gas exploration company focused on development in the Permian Basin. The company owns interests in several producing properties in the basin. Victory plans to deploy $15 million in 2014 for drilling, completions, and acquisitions to increase production and proved reserves. The goal is to achieve over 30 million barrels of proved reserves by year-end and increase revenue to over $1 million. A key focus is the recently acquired 4,050 acre Fairway project, which Victory expects can generate a 60% internal rate of return over three years of planned drilling.
1) SandRidge Energy presented at the Howard Weil Energy Conference on March 24, 2015. The presentation provided an overview of the company, its assets and operations, capital expenditure plans for 2015, and strategies for adapting to lower oil prices.
2) Key points included outlining a $700 million capital expenditure budget for 2015, a plan to reduce the rig count from 19 to 7 rigs, and targeting $200 million in proceeds from asset sales. The presentation also highlighted efficiency gains and expanded use of multilaterals to reduce well costs.
3) SandRidge demonstrated success in 2014 by growing reserves 37% and type curves 27%, with 47% production growth in the Midcontinent. The presentation emphasized preserving value
This document provides an overview and executive summary of The AES Corporation's business operations and strategy. It discusses AES' diversified portfolio of generation and utility businesses, 80% of which are contracted or regulated utilities. The presentation outlines AES' strategic pillars of reducing risk and complexity while driving growth and enhancing returns. It also provides financial projections, showing expected adjusted EPS growth of 4-6% through 2015 and 6-8% in 2017-2018, as well as proportional free cash flow growth of 10-15% annually from 2014-2018.
02 24-16 fourth quarter & fy 2015 financial review finalAES_BigSky
This document provides a summary of AES Corporation's financial results for the fourth quarter and full year of 2015. Some key points:
- Adjusted EPS decreased to $1.22 from $1.30 in 2014 due to negative impacts from foreign exchange rate changes and certain business units, partially offset by positive impacts from other business units and a reduction in shares outstanding.
- In 2015, AES brought online 1,484 MW of new generation projects and has an additional 5,620 MW currently under construction globally.
- AES returned $757 million to shareholders in 2015 through share repurchases and dividends, representing 62% of discretionary cash. An additional $345 million was used to reduce corporate debt.
The document discusses EnLink Midstream's strategy and growth opportunities. It outlines four avenues for growth: 1) drop downs of assets from Devon Energy, EnLink's largest customer, which could provide an additional $375 million in adjusted EBITDA through 2017; 2) growing with Devon in new areas; 3) organic expansion projects; and 4) mergers and acquisitions. Recent progress includes completing a drop down of assets in the Ohio River Valley from Devon and announcing several new expansion projects in Louisiana and West Texas.
- Phillips 66 Partners LP owns, operates, develops and acquires primarily fee-based crude oil, refined petroleum products and natural gas liquids pipelines and terminals and other midstream assets.
- PSXP has a balanced portfolio of assets with long-term, fee-based contracts providing stable cash flows. Recent acquisitions and organic growth projects will further expand the portfolio.
- PSXP is targeting 30% annual distribution growth through 2018 while maintaining investment grade credit ratings and annual distribution coverage of at least 1.1x.
The Shell LNG Outlook, launched in London on February 20th, is an assessment of the global liquefied natural gas (LNG) market. It finds that China and India were two of the fastest growing buyers, with the number of LNG importers worldwide up to 35, from 10 at the start of the century.
Read the Shell LNG Outlook in full at http://www.shell.com/lngoutlook
The document provides a summary of Energy Transfer LP's (ET) fourth quarter 2022 earnings conference call. Some key points:
- ET achieved record NGL fractionation and transportation volumes in Q4 2022. Midstream gathered volumes also reached a new record.
- ET announced 2023 guidance of expected Adjusted EBITDA between $12.9-13.3 billion and expected growth capital between $1.6-1.8 billion.
- For Q4 2022, ET reported Adjusted EBITDA of $3.4 billion and Distributable Cash Flow of $1.9 billion. For full year 2022, Adjusted EBITDA was a partnership record of $
This document provides contact information for Devon Energy's investor relations team. It also contains standard legal disclaimers about forward-looking statements and the use of non-GAAP financial measures in company presentations. The rest of the document summarizes Devon's operations and financial position, highlighting its high-quality asset portfolio including top positions in the STACK and Delaware Basin plays, significant financial strength following asset sales, and a focus on capital discipline and returns.
This document provides contact information for Devon Energy's investor relations team. It also contains standard legal disclaimers about forward-looking statements and the use of non-GAAP financial measures in company presentations. The rest of the document summarizes Devon's operations, highlighting its high-quality asset portfolio, strong financial position, and focus on capital discipline and returns. It provides details on key growth opportunities in the STACK and Delaware Basin plays.
The document provides an overview of AES Corporation's fourth quarter and full year 2016 financial results. Some key points:
- AES delivered on its 2016 guidance and made progress reducing costs and exiting non-core assets.
- It expects to complete $3.4 billion worth of power projects under construction by 2019.
- AES aims to achieve $350 million in annual cost savings by 2018 and an additional $50 million by 2020 through its Performance Excellence program.
- For 2017, AES expects to deliver 8-10% average annual growth in free cash flow, adjusted EPS, and shareholder dividends through 2020.
This document provides contact information for Devon Energy's investor relations team. It also includes standard legal disclaimers about forward-looking statements, non-GAAP financial measures, and SEC definitions. The rest of the document summarizes Devon's asset portfolio and operating strategy, highlights successful well results and cost savings, and discusses two of Devon's key resource plays, STACK and the Meramec, in more detail.
This document provides contact information for Devon Energy's investor relations team. It also contains standard legal disclaimers about forward-looking statements and the use of non-GAAP financial measures in company presentations. The rest of the document summarizes Devon's operations and financial position, highlighting its high-quality asset portfolio, significant financial strength, and track record of strong well results and cost reductions. It focuses on Devon's leading positions in the STACK and Delaware Basin plays and provides details on recent well performance and significant resource potential across the company's key areas.
The document discusses Morgan Stanley's MLP Bus Tour and provides an overview of EnLink Midstream. It notes that EnLink has stable cash flows from long-term fee-based contracts, including a significant portion from its sponsor Devon Energy. It is focused on executing in its core areas of Oklahoma, Permian Basin, and Louisiana. EnLink has a strong financial position as an investment grade company with a $1.5 billion credit facility and high-quality customers.
Gran Tierra Energy placed 3rd in an investment pitch competition. The document provides an overview and analysis of Gran Tierra Energy, an independent international oil and gas acquisition, exploration, development and production company operating in Colombia, Peru and Brazil. It finds that Gran Tierra has the highest netbacks within its peer group, is positioned for production and reserve growth through drilling and pipeline repairs, and is undervalued relative to peers based on valuation metrics like P/E and EV/EBITDA multiples. Upcoming catalysts include growth from key oil fields in Colombia and Peru and maintaining low costs through research and development.
Similar to 2015 credit-suisse-final v001-h4mb7r (20)
Phillips 66 reported adjusted earnings of $569 million for the second quarter of 2017. Operating cash flow was $1.865 billion for the quarter. Midstream earnings decreased due to planned maintenance and the startup of the Bakken Pipeline. Refining earnings fell as realized margins declined compared to markets. Marketing and Specialties earnings rose on stronger global margins and higher volumes.
Phillips 66 reported adjusted earnings of $294 million for the first quarter of 2017. Operating cash flow excluding working capital was $748 million. Capital expenditures and investments totaled $470 million. The company's net debt to capital ratio was 27% and annualized adjusted return on capital employed was 5%. Refining realized $8.55 per barrel in margins, capturing 70% of market margins. Chemicals earnings increased due to higher olefin and polyethylene margins. Midstream earnings rose with the first full quarter of operations at the Freeport LPG export terminal.
Tim G. Taylor, President of Bank of America Merrill Lynch, gave a presentation at the Refining Conference on March 2, 2017. The presentation focused on Phillips 66's strategy of operating excellence, growth, returns, and distributions. It highlighted achievements in safety and environmental performance improvements. It also discussed opportunities for expanding midstream infrastructure and growing various business segments such as chemicals and marketing. The presentation emphasized Phillips 66's commitment to capital allocation priorities of maintaining financial strength, funding sustaining and growth investments, and delivering shareholder returns through dividends and share repurchases.
This presentation discusses Phillips 66's strategy of focusing on returns, operating excellence, and growth. It provides the following key points:
1. In 2016, Phillips 66 achieved its safest year and highest refining utilization on record. Its CPChem petrochemical project in the US Gulf Coast is over 90% complete.
2. Phillips 66 is growing its midstream business through investments in infrastructure as US oil and gas production increases. Its MLP Phillips 66 Partners is expected to have $1.1 billion in EBITDA by 2018.
3. Phillips 66 maintains financial strength through disciplined capital allocation. It funds sustaining and growth capital while growing dividends and ongoing share repurchases.
Phillips 66 reported adjusted earnings of $83 million for the fourth quarter of 2016. Operating cash flow was $667 million for the quarter. Capital expenditures and investments totaled $813 million. For the full year 2016, adjusted earnings were $1.5 billion and operating cash flow was $3 billion. The company provided an outlook for 2017 including global olefins and polyolefins utilization in the high 80% range and refining crude utilization in the low 80% range.
- Phillips 66 reported adjusted earnings of $556 million for Q3 2016 compared to $499 million in Q2 2016.
- Refining earnings decreased from $134 million to $142 million due to higher turnaround costs and lower margins.
- Midstream earnings increased from $39 million to $75 million due to higher volumes and natural gas prices.
- Chemicals earnings remained flat at $190 million despite higher margins as downtime offset gains.
Phillips 66 reported adjusted earnings of $499 million for the second quarter of 2016. The company generated $1.2 billion in operating cash flow and spent $620 million on capital expenditures and investments. For the quarter, midstream earnings increased 16% while refining earnings fell due to planned maintenance. Marketing and specialties earnings grew due to strong global margins.
This document provides information about Phillips 66's 2016 Annual Meeting of Shareholders held on May 4, 2016 in Houston, TX. It includes highlights from 2015 such as donating over $22 million to education and charities and hiring 25% of new refining employees as veterans. The presentation discusses Phillips 66's strategy of operational excellence, growth, returns, and having a high-performing organization. Financial details are provided on adjusted EBITDA, capital expenditures, returns on capital employed, and shareholder distributions through dividends and share repurchases.
Recruiting in the Digital Age: A Social Media MasterclassLuanWise
In this masterclass, presented at the Global HR Summit on 5th June 2024, Luan Wise explored the essential features of social media platforms that support talent acquisition, including LinkedIn, Facebook, Instagram, X (formerly Twitter) and TikTok.
Storytelling is an incredibly valuable tool to share data and information. To get the most impact from stories there are a number of key ingredients. These are based on science and human nature. Using these elements in a story you can deliver information impactfully, ensure action and drive change.
Part 2 Deep Dive: Navigating the 2024 Slowdownjeffkluth1
Introduction
The global retail industry has weathered numerous storms, with the financial crisis of 2008 serving as a poignant reminder of the sector's resilience and adaptability. However, as we navigate the complex landscape of 2024, retailers face a unique set of challenges that demand innovative strategies and a fundamental shift in mindset. This white paper contrasts the impact of the 2008 recession on the retail sector with the current headwinds retailers are grappling with, while offering a comprehensive roadmap for success in this new paradigm.
At Techbox Square, in Singapore, we're not just creative web designers and developers, we're the driving force behind your brand identity. Contact us today.
SATTA MATKA SATTA FAST RESULT KALYAN TOP MATKA RESULT KALYAN SATTA MATKA FAST RESULT MILAN RATAN RAJDHANI MAIN BAZAR MATKA FAST TIPS RESULT MATKA CHART JODI CHART PANEL CHART FREE FIX GAME SATTAMATKA ! MATKA MOBI SATTA 143 spboss.in TOP NO1 RESULT FULL RATE MATKA ONLINE GAME PLAY BY APP SPBOSS
Company Valuation webinar series - Tuesday, 4 June 2024FelixPerez547899
This session provided an update as to the latest valuation data in the UK and then delved into a discussion on the upcoming election and the impacts on valuation. We finished, as always with a Q&A
Taurus Zodiac Sign: Unveiling the Traits, Dates, and Horoscope Insights of th...my Pandit
Dive into the steadfast world of the Taurus Zodiac Sign. Discover the grounded, stable, and logical nature of Taurus individuals, and explore their key personality traits, important dates, and horoscope insights. Learn how the determination and patience of the Taurus sign make them the rock-steady achievers and anchors of the zodiac.
Best practices for project execution and deliveryCLIVE MINCHIN
A select set of project management best practices to keep your project on-track, on-cost and aligned to scope. Many firms have don't have the necessary skills, diligence, methods and oversight of their projects; this leads to slippage, higher costs and longer timeframes. Often firms have a history of projects that simply failed to move the needle. These best practices will help your firm avoid these pitfalls but they require fortitude to apply.
Event Report - SAP Sapphire 2024 Orlando - lots of innovation and old challengesHolger Mueller
Holger Mueller of Constellation Research shares his key takeaways from SAP's Sapphire confernece, held in Orlando, June 3rd till 5th 2024, in the Orange Convention Center.
Implicitly or explicitly all competing businesses employ a strategy to select a mix
of marketing resources. Formulating such competitive strategies fundamentally
involves recognizing relationships between elements of the marketing mix (e.g.,
price and product quality), as well as assessing competitive and market conditions
(i.e., industry structure in the language of economics).
Structural Design Process: Step-by-Step Guide for BuildingsChandresh Chudasama
The structural design process is explained: Follow our step-by-step guide to understand building design intricacies and ensure structural integrity. Learn how to build wonderful buildings with the help of our detailed information. Learn how to create structures with durability and reliability and also gain insights on ways of managing structures.
Top mailing list providers in the USA.pptxJeremyPeirce1
Discover the top mailing list providers in the USA, offering targeted lists, segmentation, and analytics to optimize your marketing campaigns and drive engagement.
Zodiac Signs and Food Preferences_ What Your Sign Says About Your Tastemy Pandit
Know what your zodiac sign says about your taste in food! Explore how the 12 zodiac signs influence your culinary preferences with insights from MyPandit. Dive into astrology and flavors!
Zodiac Signs and Food Preferences_ What Your Sign Says About Your Taste
2015 credit-suisse-final v001-h4mb7r
1. 2015 Credit Suisse Energy Summit
Greg Garland, Chairman and CEO
February 24, 2015
Vail, CO
Execution
2. Cautionary Statement
2
This presentation contains certain forward-looking statements within the meaning of Section 27A of the Securities Act of 1933, as amended, and
Section 21E of the Securities Exchange Act of 1934, as amended, which are intended to be covered by the safe harbors created thereby. Words
and phrases such as “is anticipated,” “is estimated,” “is expected,” “is planned,” “is scheduled,” “is targeted,” “believes,” “intends,” “objectives,”
“projects,” “strategies” and similar expressions are used to identify such forward-looking statements. However, the absence of these words does
not mean that a statement is not forward-looking. Forward-looking statements relating to Phillips 66’s operations (including joint venture
operations) are based on management’s expectations, estimates and projections about the company, its interests and the energy industry in
general on the date this presentation was prepared. These statements are not guarantees of future performance and involve certain risks,
uncertainties and assumptions that are difficult to predict. Therefore, actual outcomes and results may differ materially from what is expressed or
forecast in such forward-looking statements. Factors that could cause actual results or events to differ materially from those described in the
forward-looking statements include fluctuations in crude oil, NGL, and natural gas prices, and refining and petrochemical margins; unexpected
changes in costs for constructing, modifying or operating our facilities; unexpected difficulties in manufacturing, refining or transporting our
products; lack of, or disruptions in, adequate and reliable transportation for our crude oil, natural gas, NGL, and refined products; potential liability
from litigation or for remedial actions, including removal and reclamation obligations, under environmental regulations; limited access to capital or
significantly higher cost of capital related to illiquidity or uncertainty in the domestic or international financial markets; and other economic,
business, competitive and/or regulatory factors affecting Phillips 66’s businesses generally as set forth in our filings with the Securities and
Exchange Commission. Phillips 66 is under no obligation (and expressly disclaims any such obligation) to update or alter its forward-looking
statements, whether as a result of new information, future events or otherwise.
This presentation includes non-GAAP financial measures. You can find the reconciliations to comparable GAAP financial measures at the end of
the presentation materials or in the “Investors” section of our website.
3. 2014 Accomplishments
3
Growth
$4.0 B growth capital program
Advanced 100 MBD NGL fractionator
Advanced 150 MBD LPG export facility
Acquired Beaumont Terminal, adding 7
MMBbl storage
Commenced Bakken to Patoka to
Beaumont pipeline projects
Advanced USGC petrochemicals
complex
Completed 550 MM Lb/yr 1-hexene plant
Added 200 MM Lb/yr of ethylene
capacity at Sweeny
Acquired Spectrum, a specialties
lubricants business
Phillips 66 Partners (PSXP)
Delivered over 100% of EBITDA growth
Formed Bakken joint ventures
Returns
$1.6 B sustaining capital program
Reliable operations enhance returns
Record low TRIR across Refining,
Chemicals, and Midstream
Increased export capacity to 1 MMBD
Ran 94% advantaged crude
Sold interest in Melaka Refinery
Increased crude rail capability to 180 MBD
Competitive ROCE
14% Total Company
32% Marketing & Specialties
27% Chemicals
13% Midstream
12% Refining
Distributions
Returned $4.7 B to shareholders
Paid $1.1 B in dividends
Repurchased $2.3 B of shares
PSPI exchange $1.3 B
Increased dividend rate 28%
Reduced outstanding share count by 7%
Repurchased 29 million shares
Completed PSPI 17.4 million share
exchange
Capital structure
$8.7 B debt at year end
$5.2 B ending cash balance
14% net debt-to-capital ratio
PSXP increased unit distribution 51%
See appendix for footnotes.
4. Operating Excellence
4
Industry Average
Total Recordable Rates
Incidents per 200,000 Hours Worked
’08 ’10 ’12 ’14
Refining Environmental Metrics
Refining Capacity Utilization
%
Operating Costs and SG&A
$B
Phillips 66 CPChem DCP
See appendix for footnotes.
5. Energy Landscape
5
Historical and Forward Crude Oil Prices
$/bbl
Supply outpacing demand
Weaker global demand growth
E&P production forecasts uncertain
U.S. infrastructure growth slowing
Source: Bloomberg
6. A Diversified Downstream Company
6
RefiningMidstream Chemicals
Marketing and
Specialties
G&P, pipelines,
fractionation, storage and
export facilities
M&A and organic
opportunities
Free cash flow yield 5-10%*
CPChem, primarily Olefins &
Polyolefins in North America
and Middle East
Advantaged ethane based
feedstock cost structures
Free cash flow yield 20-25%*
Operate in all five U.S.
PADDs with 2.2 MBD of
refining capacity
Improving yields, accessing
advantaged crudes
Free cash flow yield 5-15%*
U.S. Marketing,
International Marketing and
Lubricants
High return and stable
earnings business
Free cash flow yield 15-25%
*DCP Midstream, CPChem and WRB free cash flow yield calculated at the enterprise level. See appendix for footnotes.
7. Midstream
7
NGL
NGL fractionation capacity growing to 200 MBD
Fractionator One start up 3Q 2015
LPG export facility start up 4Q 2016
Sand Hills/Southern Hills expansion
Transportation
Beaumont crude/products hub
Bakken to Patoka/Beaumont pipelines
PSXP
Bakken joint ventures
Eagle Ford Gathering System
Cross-Channel Connector Pipeline
Organic and M&A opportunities
DCP EBITDA excluded. See appendix for additional footnotes.
8. PSXP 1Q 2015 Acquisition
8
Drop down assets
33.3% interest in Sand Hills NGL pipeline
33.3% interest in Southern Hills NGL pipeline
19.5% interest in Explorer refined products pipeline
Public equity issuance of $456 MM
$200 MM consideration for drop
$256 MM used for growth and revolver paydown
Public debt issuance of $1.1 B
$680 MM in cash used for drop
$412 MM repayment of sponsor loans
Investment grade credit rating
Total consideration to PSX of $1.1 B
9.5x multiple on 2015E EBITDA of $115 MM
$130 MM in take-back units
Net cash to PSX $1.3 B includes loan repayment
See appendix for footnotes.
9. Strong PSXP Growth
9
$MM
800
100
Focused on top-tier distribution growth
5-year 30% LP distribution per unit CAGR from 4Q 2013
Provides significant growth in total distributions
$230 MM organic growth project capital
Bakken joint ventures
Eagle Ford Gathering System
Cross-Channel Connector Pipeline
MLP-qualifying EBITDA in excess of $1 B post 2018
See appendix for footnotes.
Run-Rate EBITDA Distributions
10. PSX Value Uplift
10
2018E PSXP Value to PSX
Growing GP key value lever
Fee-based business model
Growing cash flows
Incentivized to grow value at PSXP
$10-13 B
$5-7 B
$25-35/share
$545 MM
Distributions Enterprise Value
See appendix for footnotes.
$15-20 B
11. DCP Midstream
11
Historical Commodity Prices
$/bbl One of the largest G&P, NGL producers
and NGL pipeline operators in North
America
Reduce capital and costs, as well as
increase capital efficiency
Focus on maintaining strong position in key
basins
Zia II, Lucerne 2, and Keathley Canyon in
service in 2015
Source: Bloomberg & EIA
12. Chemicals Environment
12
Source: IHS Chemical Data & Bloomberg
N.A. HDPE Chain Cash Margin v. Brent
2009 2010 2014
YTD
20152012 20132011
Ethane remains preferred feedstock
Naphtha disadvantage narrows with
low oil prices
Record 2014 ethane chain margins,
expect good chain margins to
continue
Expect high operating rates
cpp$/bbl
13. CPChem
13
50/50 joint venture with Chevron Corp.
Industry-leading returns
Geographically advantaged
10.5 B Lb/yr worldwide ethylene capacity
Strong global aromatics position
23% increase in 2014 EBITDA
USGC Petrochemicals project on track
$6 B estimated capital spend
35% complete, start-up 2Q 2017
3.3 B Lb/yr ethane cracker
2.2 B Lb/yr polyethylene production
$2.9 B self-funded 2015 total capital
$1.3 - 1.6 B/yr incremental EBITDA by 2018
Phillips 66 Chemicals ROCE
$1.3 – $1.6 B estimated incremental EBITDA based on 2012 industry margins.
See appendix for additional footnotes.
14. Refining
14
Atlantic Basin/Europe
588 MBD
Gulf Coast
738 MBD
Central Corridor
492 MBD
West Coast
360 MBD
Light/
Medium
Heavy
Worldwide
Improving Returns
Increasing shale crude runs at
Alliance Refinery
Adding access to Canadian and
inland crudes on the West Coast
Accessing North Dakota crude
Improving yields at Sweeny, Lake
Charles and Bayway Refineries
Increasing Jones Act ship capacity
Portfolio Management
Melaka
Bantry Bay
Whitegate
15. Marketing and Specialties
15
High-returning businesses
U.S. Marketing
Wholesale network
~8,600 branded sites
International Marketing
Low cost, high volume business
~1,520 sites
Specialties
Finished lubricants
Base oil joint venture
Adjusted EBITDA
$B
Avg. $1.2 B
16. Capital Budget
16
Estimated 2015
$4.6 B
$3.4 B Growth capital
Sweeny Fractionator One
LPG Export Terminal
Bakken to Patoka/Beaumont pipelines
Beaumont Terminal expansion
$1.2 B Sustaining capital
17. EBITDA Growth
17
Adjusted EBITDA
$B
Corporate not included in bars on chart, but included in totals.
Greater than 30% increase in EBITDA
Cash flows less volatile by 2018E
2018E portfolio shift to higher-value
businesses
20% Midstream
25% Chemicals
40% Refining
15% Marketing & Specialties
21. Investment
Sustain operations
Fund Midstream and Chemicals growth
Generate competitive returns
Distributions
Dividend growth
Repurchase shares
Capital Structure
20-30% debt-to-capital
Aggressive use of PSXP
Disciplined Capital Allocation
21
Distributions
Reinvestment
2014E – 2016E
22. Cash Build/
Other
Capex/
InvestmentsDistributions
Uses
22
$1.5 B
Debt-to-Capital 28%
Net-Debt-to-Capital 14%
$6.8 B
Share Repurchases $5.0 B
Dividends $1.8 B
$5.6 B
Growth $3.4 B
Sustaining $2.2 B
Debt
$9.6 B
CFO (Excl. WC) $9.6 B
Working Capital ($0.05 B)
Cash From Operations Capex & Investments Distributions
2013 – 2014 Cash Sources and Uses
Debt-to-capital and net-debt-to-capital as of Dec. 31, 2014.
Data includes discontinued operations.
CFO
Asset
Sales
Debt
Sources
$13.5 B
30. Phillips 66 Partners Asset Base
30
Sand Hills, Southern Hills and Explorer pipelines targeted closing early March 2015.
31. Footnotes
31
Slide 3
Capital program includes selected joint ventures. ROCE numbers are all on an adjusted basis.
Slide 4
Injury statistics do not include major projects.
Industry Averages are from: Phillips 66 – American Fuel & Petrochemical Manufacturers (AFPM) refining
data, CPChem – American Chemistry Council (ACC), DCP – Gas Processors Association (GPA).
Slide 6
Free cash flow yield based on 2009 – 2014 average
Slide 7
EBITDA excludes DCP but includes 100% PSXP EBITDA. PSX’s equity ownership of Sand Hills and
Southern Hills pipelines to be acquired by PSXP, targeted closing date early March 2015.
Slide 8
Debt and equity issuance amounts are gross of fees. Transaction between PSX and PSXP eliminate in
consolidation. The net impact of PSXP’s 1Q 2015 public offerings to PSX’s consolidated balance sheet is
an estimated $1.6 billion increase in cash, an estimated $0.5 billion increase in non-controlling interests
and an estimated $1.1 billion increase in long-term debt.
32. Footnotes
32
Slide 9
$230 MM organic growth capital includes 2014 and 2015 spending.
Slide 10
2014 ending PSX share count used in $/share calculation. Distributions from PSXP to PSX eliminate in
consolidation and thus do not impact PSX’s consolidated cash balance. Enterprise Value calculated by
multiplying distributions to average industry multiples.
Slide 13
Current Peer Set: Dow, ExxonMobil Chemical, LyondellBasell, Westlake
Growth capital reflects 100% CPChem growth capital. Growth EBITDA includes: 1-hexene, 10th Sweeny
furnace, NAO expansion project and USGC petrochemical project.
33. 2015 Sensitivities
33
Sensitivities shown above are independent and are only valid within a limited price range.
Midstream
Net Income
$MM
10¢/Gal Increase in NGL price 35
$1/MMBtu Increase in Natural Gas price 30
$10/BBL Increase in WTI price 15
Chemicals
1¢/Lb Increase in Chain Margin (Ethylene, Polyethylene, NAO) 35
Worldwide Refining (assuming 91% refining utilization)
For a $1/BBL Increase in Gasoline Margin 220
For a $1/BBL Increase in Distillate Margin 200
Impacts due to Actual Crude Feedstocks Differing from Feedstock Assumed
in Market Indicators:
$1/BBL Widening LLS / Maya Differential (LLS less Maya) 50
$1/BBL Widening WTI / WCS Differential (WTI less WCS) 40
$1/BBL Widening WTI / WTS Differential (WTI less WTS) 15
$1/BBL Widening LLS / Medium Sour Differential (LLS less Medium Sour) 10
$1/BBL Widening ANS / WCS Differential (ANS less WCS) 10
$0.10/MMBtu Increase in Natural Gas price (10)
34. Capital Program
34
Sustaining Growth Total
Capital Expenditures and Investments
Consolidated
Midstream(1)
Transportation 148 1,084 1,232
NGL 19 1,912 1,931
167 2,996 3,163
Chemicals - - -
Refining(2)
813 299 1,112
Marketing and Specialties 78 92 170
Corporate(2)
155 - 155
1,213 3,387 4,600
Selected Equity Affiliates
DCP 175 375 550
CPChem 188 1,261 1,449
WRB 150 53 203
513 1,689 2,202
Capital Program(3)
Midstream
Transportation 148 1,084 1,232
DCP 175 375 550
NGL 19 1,912 1,931
342 3,371 3,713
Chemicals 188 1,261 1,449
Refining 963 352 1,315
Marketing and Specialties 78 92 170
Corporate 155 - 155
1,726 5,076 6,802
(1)
Includes 100% of Phillips 66 Partners.
(2)
Includes non-cash capitalized leases of $11 million in Refining and $21 million in Corporate and Other.
Millions of Dollars
2015 Budget
(3)
Includes Phillips 66's share of capital spending by DCP, CPChem and WRB, which are expected to be self-
funded.
35. Non-GAAP Reconciliations
35
Adjusted EBITDA forecasts were derived on an EBITDA-only basis. Accordingly, elements of net income including tax
and depreciation information are not available. Together, these items generally result in a significant uplift in EBITDA
over net income.
2018E Adjusted EBITDA/ EBITDA project backlog post 2018
PSXP Run Rate EBITDA
PSXP 2014 and 2018 run rate EBITDA estimates were derived on an EBITDA-only basis. Accordingly, elements of net
income including tax and depreciation information are not available. Together, these items generally result in a
significant uplift in EBITDA over net income. Run rate EBITDA reflects annualized EBITDA projections of assets
immediately upon acquisition.
Millions
of Dollars
Year ending February 29 2016
Reconciliation of PSXP Estimated EBITDA to Estimated Net Income*
Estimated net income 82$
Plus:
Depreciation 20
Interest expense 4
Income taxes 9
Estimated EBITDA 115$
*Amounts reflect the sum of EBITDA and net income forecasts within each joint venture, multiplied
by PSXP's expected ownership interest.
PSXP Run Rate EBITDA
PSXP 2014 and 2018 run rate EBITDA estimates were derived on an EBITDA-only basis. Accordingly, elements of net
income including tax and depreciation information are not available. Together, these items generally result in a
significant uplift in EBITDA over net income. Run rate EBITDA reflects annualized EBITDA projections of assets
immediately upon acquisition.
36. 36
Non-GAAP Reconciliations
2009 2010 2011 2012 2013 2014
Chemicals Segment ROCE
Numerator
Net Income 228$ 486 716 823 987 1,137
After-tax interest expense - - - - - -
GAAP ROCE earnings 228 486 716 823 987 1,137
Special Items - - - 157 - 72
Adjusted ROCE earnings 228$ 486 716 980 987 1,209
Denominator
GAAP average capital employed* 2,024$ 2,275 2,563 3,142 3,825 4,489
*Total equity plus debt.
Annualized Adjusted ROCE (percent) 11% 21% 28% 31% 26% 27%
Annualized GAAP ROCE (percent) 11% 21% 28% 26% 26% 25%
Millions of Dollars
37. Non-GAAP Reconciliations
37
Marketing & Specialties Adjusted EBITDA Reconciliation 2009 2010 2011 2012 2013 2014
2009-2014
Average
U.S. Marketing
U.S. Marketing net income attributable to Phillips 66 232$ 338 154 116 426 439 284
Plus:
Provision for income taxes 151 225 120 56 248 251 175
Net interest expense (47) (41) (32) - (0) (0) (20)
Depreciation and amortization 34 30 30 29 15 15 25
U.S. Marketing EBITDA 370$ 553 271 201 689 705 465
Adjustments (pretax):
Gain on asset dispositions (22)$ (234) - (4) - - (43)
Impairments 59 12 - - - - 12
Pending claims and settlements - (56) - 62 (25) (44) (11)
Tax law impacts - - - - (6) - (1)
U.S. Marketing Adjusted EBITDA* 407$ 275 271 259 658 661 422
International Marketing
International Marketing net income attributable to Phillips 66 155$ 110 256 159 261 397 223
Plus:
Provision for income taxes 216 52 111 105 59 75 103
Net interest expense 1 - - - - - 0
Depreciation and amortization 92 104 114 107 80 68 94
International Marketing EBITDA 463$ 266 481 371 400 540 420
Adjustments (pretax):
Gain on asset dispositions -$ - 3 - - (125) (20)
International Marketing Adjusted EBITDA* 463$ 266 484 371 400 415 400
Millions of Dollars
Marketing & Specialties Adjusted EBITDA Reconciliation 2009 2010 2011 2012 2013 2014
2009-2014
Average
Specialties
Specialties net income attributable to Phillips 66 154$ 207 283 269 206 199 220
Plus:
Provision for income taxes 90 121 175 158 126 114 131
Net interest expense 2 - - - - - 0
Depreciation and amortization 6 7 8 11 8 11 9
Specialties EBITDA 252$ 335 466 438 341 324 359
Adjustments (pretax):
Gain on asset dispositions -$ - (43) - (40) - (14)
Exit of a business line - - - - 54 - 9
Specialties Adjusted EBITDA* 252$ 335 423 438 355 324 354
Marketing & Specialties Consolidated Segment
Marketing and Specialties net income attributable to Phillips 66 541$ 656 693 544 894 1,034 727
Plus:
Provision for income taxes 457 398 405 319 433 440 409
Net interest expense (44) (41) (32) - (0) (0) (20)
Depreciation and amortization 131 140 153 147 103 95 128
Marketing and Specialties EBITDA 1,085$ 1,153 1,218 1,010 1,430 1,569 1,244
Adjustments (pretax):
Gain on asset dispositions (22)$ (234) (40) (4) (40) (125) (78)
Impairments 59 12 - - - - 12
Pending claims and settlements - (56) - 62 (25) (44) (11)
Exit of a business line - - - - 54 - 9
Tax law impacts - - - - (6) - (1)
Marketing and Specialties Adjusted EBITDA 1,122$ 875 1,178 1,068 1,413 1,400 1,176
Millions of Dollars
38. Non-GAAP Reconciliations
38
Adjusted EBITDA by Segment Reconciliation 2009 2010 2011 2012 2013 2014
2009-2014
Average
Midstream
Midstream net income attributable to Phillips 66 384$ 384 2,147 52 469 507 657
Plus:
Net income attributable to noncontrolling interests 3 5 5 7 17 35 12
Provision for income taxes 204 184 453 29 264 309 241
Depreciation and amortization 99 74 82 83 88 91 86
Midstream EBITDA 690$ 647 2,687 171 838 942 996
Adjustments (pretax):
EBITDA attributable to Phillips 66 noncontrolling interests -$ (9) (10) (13) (24) (45) (17)
Proportional share of selected equity affiliates income taxes 9 3 1 - 4 3 3
Proportional share of selected equity affiliates net interest 119 119 97 85 110 118 108
Proportional share of selected equity affiliates depreciation and amortization 187 188 202 131 139 150 166
Lower-of-cost-or-market inventory adjustments - - - - - 2 0
Gain on asset dispositions (15) - (1,830) - - - (308)
Gain on share issuance by equity affiliate (135) - - - - - (23)
Impairments 70 - 6 523 - - 100
Pending Claims and settlements - - - (37) - - (6)
Hurricane-related costs - - - 2 - - 0
Midstream Adjusted EBITDA* 925$ 948 1,153 862 1,067 1,170 1,021
* Proportional share of selected equity affiliates is net of noncontrolling interests.
Chemicals
Chemicals net income attributable to Phillips 66 228$ 486 716 823 986 1,137 729
Plus:
Provision for income taxes 67 194 252 366 375 495 292
Chemicals EBITDA 295$ 680 968 1,189 1,361 1,632 1,021
Adjustments (pretax):
Proportional share of selected equity affiliates income taxes 37$ 59 75 79 93 111 76
Proportional share of selected equity affiliates net interest 34 35 16 13 10 9 20
Proportional share of selected equity affiliates depreciation and amortization 192 183 198 213 246 258 215
Impairments - - - 43 - 88 22
Premium on early debt retirement - - - 144 - - 24
Lower-of-cost-or-market inventory adjustments - - - - - 3 1
Chemicals Adjusted EBITDA 558$ 957 1,257 1,681 1,710 2,101 1,377
Millions of Dollars
39. Non-GAAP Reconciliations
39
Adjusted EBITDA by Segment Reconciliation 2009 2010 2011 2012 2013 2014
2009-2014
Average
Refining
Refining net income (loss) attributable to Phillips 66 (556)$ (661) 1,369 3,091 1,747 1,771 1,127
Plus:
Provision for income taxes (296) (121) 808 1,998 1,035 696 687
Net interest expense (1) (2) (1) - - - (1)
Depreciation and amortization 641 659 664 655 685 704 668
Refining EBITDA (212)$ (125) 2,840 5,744 3,467 3,171 2,481
Adjustments (pretax):
Proportional share of selected equity affiliates income taxes 1$ 1 4 5 (4) 3 2
Proportional share of selected equity affiliates net interest (179) (160) (140) (118) (95) (19) (119)
Proportional share of selected equity affiliates depreciation and amortization 178 169 184 236 237 245 208
Net (gain) loss on asset dispositions - - 234 (185) - (145) (16)
Impairments - 1,500 500 606 - 131 456
Canceled projects - 106 44 - - - 25
Pending claims and settlements 39 - - 31 - 23 16
Severence accruals - 28 24 - - - 9
Hurrican-related costs - - - 54 - - 9
Tax law impacts - - - - (22) - (4)
Lower-of-cost-or-market inventory adjustments - - - - - 40 7
Refining Adjusted EBITDA (173)$ 1,519 3,690 6,373 3,583 3,449 3,074
Millions of Dollars
40. Non-GAAP Reconciliations
40
Adjusted EBITDA by Segment Reconciliation 2009 2010 2011 2012 2013 2014
2009-2014
Average
Marketing and Specialties
Marketing and Specialties net income attributable to Phillips 66 541$ 655 692 544 894 1,034 727
Plus:
Provision for income taxes 457 398 406 319 433 441 409
Net interest expense (44) (40) (32) - - - (19)
Depreciation and amortization 132 140 152 147 103 95 128
Marketing and Specialties EBITDA 1,086$ 1,153 1,218 1,010 1,430 1,570 1,245
Adjustments (pretax):
Gain on asset dispositions (22)$ (234) (40) (4) (40) (125) (78)
Impairments 59 12 - - - - 12
Pending claims and settlements - (56) - 62 (25) (44) (11)
Exit of a business line - - - - 54 - 9
Tax law impacts - - - - (6) - (1)
Marketing and Specialties Adjusted EBITDA 1,123$ 875 1,178 1,068 1,413 1,401 1,176
Corporate
Corporate net income (loss) attributable to Phillips 66 (140)$ (159) (192) (434) (431) (393) (292)
Plus:
Provision for income taxes (75) (93) (97) (239) (263) (287) (176)
Net interest expense 1 1 17 231 258 246 126
Depreciation and amortization 1 1 4 21 71 105 34
Corporate EBITDA (213)$ (250) (268) (421) (365) (329) (308)
Adjustments (pretax):
Impairments -$ - - 25 - - 4
Repositioning Costs - - - 85 - - 14
Corporate Adjusted EBITDA (213)$ (250) (268) (311) (365) (329) (289)
Millions of Dollars
41. Non-GAAP Reconciliations
41
Adjusted EBITDA by Segment Reconciliation 2009 2010 2011 2012 2013 2014
2009-2014
Average
Phillips 66
Phillips 66 net income attributable to Phillips 66 476$ 735 4,775 4,124 3,726 4,762 3,100
Less:
Income from discontinued operations 19 30 43 48 61 706 151
Plus:
Net income attributable to noncontrolling interests 3 5 5 7 17 35 12
Provision for income taxes 357 562 1,822 2,473 1,844 1,654 1,452
Net interest expense (44) (41) (16) 231 258 246 106
Depreciation and amortization 873 874 902 906 947 995 916
Phillips 66 EBITDA 1,646$ 2,105 7,445 7,693 6,731 6,986 5,434
Adjustments (pretax):
EBITDA attributable to Phillips 66 noncontrolling interests -$ (9) (10) (13) (24) (45) (17)
Proportional share of selected equity affiliates income taxes 47 63 80 84 93 117 81
Proportional share of selected equity affiliates net interest (26) (6) (27) (20) 25 108 9
Proportional share of selected equity affiliates depreciation and amortization 557 540 584 580 622 653 589
Gain on asset dispositions (37) (234) (1,636) (189) (40) (270) (401)
Gain on share issuance by equity affiliate (135) - - - - - (23)
Impairments 129 1,512 506 1,197 - 219 594
Cancelled projects - 106 44 - - - 25
Severence accruals - 28 24 - - - 9
Exit of a business line - - - - 54 - 9
Pending claims and settlements 39 (56) - 56 (25) (21) (1)
Premium on early debt retirement - - - 144 - - 24
Repositioning Costs - - - 85 - - 14
Hurricane-related costs - - - 56 - - 9
Tax law impacts - - - - (28) - (5)
Lower-of-cost-or-market inventory adjustments - - - - - 45 8
Corporate Adjusted EBITDA 2,220$ 4,049 7,010 9,673 7,408 7,792 6,359
Millions of Dollars
42. Non-GAAP Reconciliations
42
Millions of Dollars 2014
Net Debt-to-Capital Ratio
Short-term debt 842$
Long-term debt 7,842
Less: Cash and cash equivalents (5,207)
Net Debt 3,477$
Noncontrolling Interest 447$
Common Equity 21,590
Total Equity 22,037
Net debt-to-capital ratio 14%
Low High
100% CPChem Incremental Project Earnings Projections
Estimated incremental net income 1,000$ 1,313
Plus:
Estimated income taxes 20 27
Estimated net interest expense - -
Estimated depreciation 280 260
Estimated EBITDA 1,300$ 1,600
Millions of Dollars
43. Non-GAAP Reconciliations
43
Phillips 66 Midstream Chemicals Refining
Marketing &
Specialties Corporate
ROCE 2014
Numerator
Net Income 4,797$ 541 1,137 1,771 1,034 (393)
After-tax interest expense 173 - - - - 173
GAAP ROCE earnings 4,970 541 1,137 1,771 1,034 (220)
Special Items (981) 1 72 (195) (152) 0
Adjusted ROCE earnings 3,990$ 542 1,209 1,576 882 (220)
Denominator
GAAP average capital employed* 29,634$ 4,207 4,489 13,377 2,743 4,722
Discontinued Operations 96 - - - - -
Adjusted average capital employed* 29,730$ 4,207 4,489 13,377 2,743 4,722
*Total equity plus debt.
Annualized Adjusted ROCE (percent) 13% 13% 27% 12% 32% -5%
Annualized GAAP ROCE (percent) 17% 13% 25% 13% 38% -5%
Phillips 66 Midstream Chemicals Refining
Marketing &
Specialties Corporate
CROCE 2014
Numerator
Net Income 4,797$ 541 1,137 1,771 1,034 (393)
After-tax interest expense 173 - - - - 173
Depreciation and amortization 995 91 - 704 95 106
5,966 633 1,137 2,475 1,129 (114)
Special Items (981) 1 72 (195) (152) 0
Adjusted CROCE earnings 4,985$ 634 1,209 2,280 977 (114)
Denominator
GAAP average capital employed* 29,634$ 4,207 4,489 13,377 2,743 4,722
Discontinued Operations 96 - - - - -
Adjusted average capital employed* 29,730$ 4,207 4,489 13,377 2,743 4,722
*Total equity plus debt.
Adjusted CROCE (percent) 17% 15% 27% 17% 36% -2%
Net Income/ GAAP Average Capital Employed (percent) 16% 13% 25% 13% 38% -8%
Millions of Dollars
44. Non-GAAP Reconciliations
44
Midstream Chemicals Refining
Marketing &
Specialties
FCF Yield
Numerator
Cash From Operations GAAP 559$ 230 2,615 563
Less: Change in Non-Cash Working Cap. (13) (0) 152 (127)
Cash From Operations (excluding WC) 572 230 2,463 690
Less: P66 Equity affiliate cash from ops 205 230 584 -
Add: Equity look through cash from ops 431 856 573 -
Adjusted FCF (excl WC) 798$ 856 2,452 690
Total Capex GAAP 2,173 - 1,038 439
Less: Growth Capex 2,058 - 287 388
Sustaining Capex 115 - 751 52
Less: P66 Equity affiliate sustaining capex - - - -
Add: Equity look through sustaining capex 148 150 134 -
Adjusted Sustaining Capex 263$ 150 885 52
Free Cash Flow 535$ 706 1,567 639
Denominator
GAAP average capital employed* 3,346$ 3,053 15,052 3,382
Less: P66 Equity affiliate capital employed 512 3,053 2,507 -
Add: Equity look through capital employed 3,667 3,515 5,231 -
Adjusted average capital employed* 6,501$ 3,515$ 17,776$ 3,382$
*Total equity plus debt.
Adjusted FCFY (percent) 8% 20% 9% 19%
GAAP CFO/ GAAP Capital Employed (percent) 17% 8% 17% 17%
Millions of Dollars
Average 2009-2014
45. Non-GAAP Reconciliations
45
2009 2010 2011 2012 2013 2014
100% CPChem
Net Income $ 615 1,388 1,970 2,403 2,743 3,288
Plus:
Income taxes 26 42 57 67 71 86
Net interest expense 58 63 18 8 (3) (2)
Depreciation and amortization 285 255 258 265 278 296
EBITDA $ 984 1,748 2,303 2,743 3,089 3,668
Adjustments (pre-tax):
Proportional share of equity affiliates income taxes 48 76 93 91 115 136
Proportional share of equity affiliates net interest expense 10 8 14 17 24 19
Proportional share of equity affiliates depreciation and amortization 98 112 138 157 214 220
Impairments - - - 91 - 175
Premium on early debt retirement - - - 287 - -
Lower-of-cost-or-market inventory adjustments - - - - - 6
Adjusted EBITDA $ 1,140 1,944 2,548 3,386 3,442 4,224
Millions of Dollars
2009 2010 2011 2012 2013 2014
100% DCP Midstream
Net Income $ 339 592 863 486 491 288
Plus:
Income taxes 18 5 3 2 10 11
Net interest expense 254 253 213 193 249 287
Depreciation and amortization 405 413 449 291 314 348
EBITDA $ 1,016 1,263 1,528 972 1,064 934
Adjustments (pre-tax):
Proportional share of equity affiliates income taxes (1) - - (1) (3) (6)
Proportional share of equity affiliates net interest expense (18) (20) (25) (32) (40) (67)
Proportional share of equity affiliates depreciation and amortization (41) (50) (59) (43) (67) (86)
Adjusted EBITDA $ 956 1,193 1,444 896 954 775
Millions of Dollars