Download as PDF, PPTX


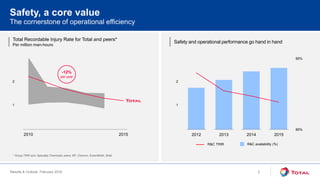
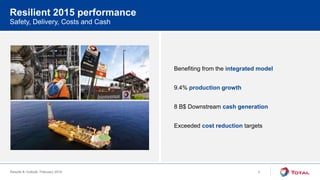

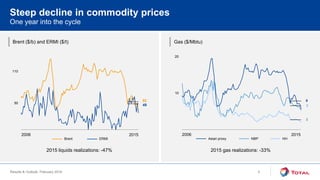
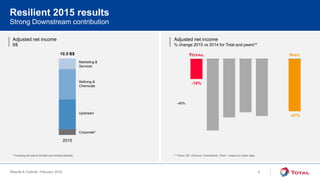
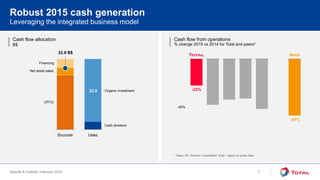
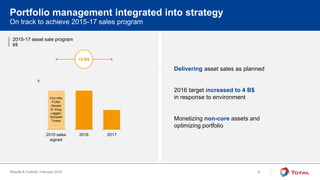
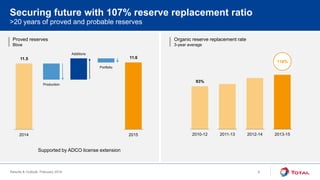
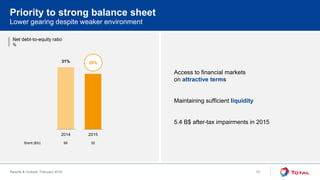
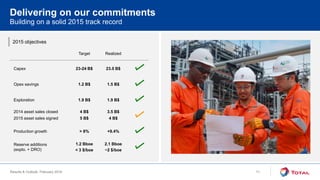
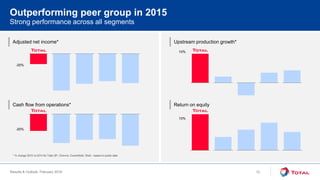

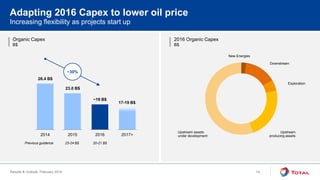
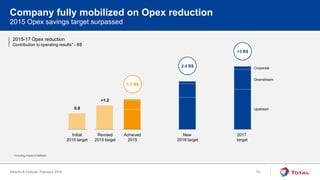
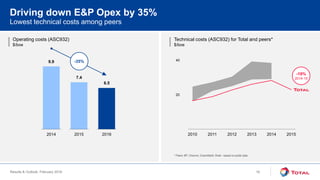
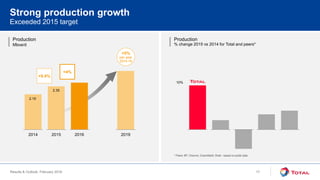
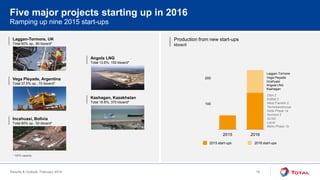
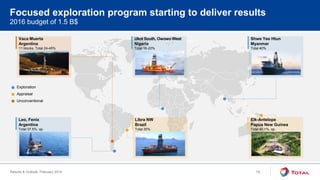
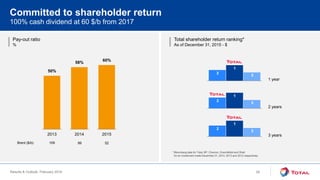
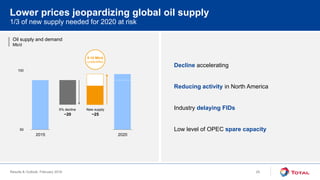
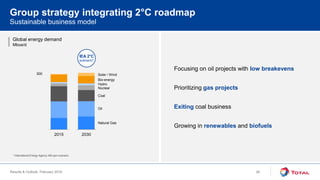
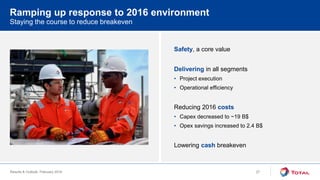


The document provides Total's results and outlook for 2016. It summarizes their resilient 2015 performance despite lower oil prices, including production growth of 9.4% and $8 billion in downstream cash generation. For 2016, Total plans to decrease capex to around $19 billion, increase opex savings to $2.4 billion, and further lower their cash breakeven. They also discuss strong safety and operational performance, progress on asset sales, growing production from new projects starting up, and maintaining focus on shareholder returns.


