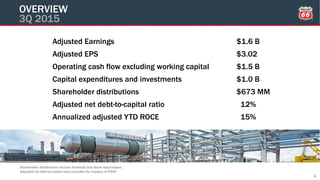
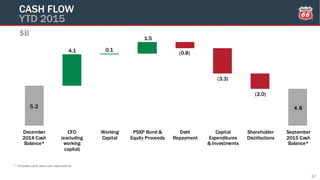
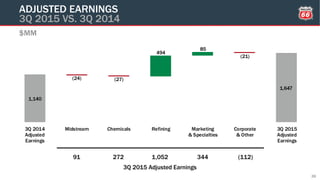
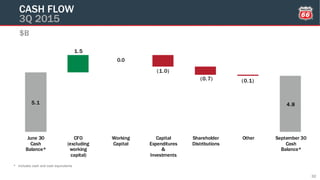
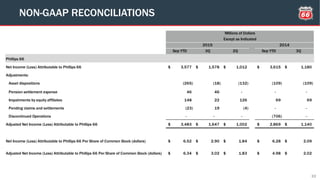
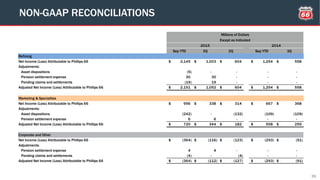
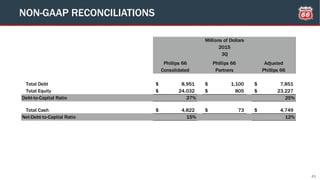
SlideShare a Scribd company logo
1 of 42
Download to read offline
PHILLIPS 66
THIRD QUARTER CONFERENCE CALL
October 30, 2015
This presentation contains certain forward-looking statements within the meaning of Section 27A of the Securities Act of 1933, as amended, and
Section 21E of the Securities Exchange Act of 1934, as amended, which are intended to be covered by the safe harbors created thereby. Words and
phrases such as “is anticipated,” “is estimated,” “is expected,” “is planned,” “is scheduled,” “is targeted,” “believes,” “intends,” “objectives,” “projects,”
“strategies” and similar expressions are used to identify such forward-looking statements. However, the absence of these words does not mean that a
statement is not forward-looking. Forward-looking statements relating to Phillips 66’s operations (including joint venture operations) are based on
management’s expectations, estimates and projections about the company, its interests and the energy industry in general on the date this
presentation was prepared. These statements are not guarantees of future performance and involve certain risks, uncertainties and assumptions that
are difficult to predict. Therefore, actual outcomes and results may differ materially from what is expressed or forecast in such forward-looking
statements. Factors that could cause actual results or events to differ materially from those described in the forward-looking statements include
fluctuations in NGL, crude oil and natural gas prices, and petrochemical and refining margins; unexpected changes in costs for constructing, modifying
or operating our facilities; unexpected difficulties in manufacturing, refining or transporting our products; lack of, or disruptions in, adequate and
reliable transportation for our NGL, crude oil, natural gas and refined products; potential liability from litigation or for remedial actions, including
removal and reclamation obligations, under environmental regulations; limited access to capital or significantly higher cost of capital related to
illiquidity or uncertainty in the domestic or international financial markets; and other economic, business, competitive and/or regulatory factors
affecting Phillips 66’s businesses generally as set forth in our filings with the Securities and Exchange Commission. Phillips 66 is under no obligation
(and expressly disclaims any such obligation) to update or alter its forward-looking statements, whether as a result of new information, future events or
otherwise.
This presentation includes non-GAAP financial measures. You can find the reconciliations to comparable GAAP financial measures at the end of the
presentation materials or in the “Investors” section of our website.
CAUTIONARY STATEMENT
2
3
EXECUTING STRATEGY
4
OVERVIEW
3Q 2015
Adjusted Earnings $1.6 B
Adjusted EPS $3.02
Operating cash flow excluding working capital $1.5 B
Capital expenditures and investments $1.0 B
Shareholder distributions $673 MM
Adjusted net debt-to-capital ratio 12%
Annualized adjusted YTD ROCE 15%
Shareholder distributions include dividends and share repurchases
Adjusted net debt-to-capital ratio excludes the impacts of PSXP
1,002
1,647
43
(23)
448
162 15
2Q 2015
Adjusted
Earnings
Midstream Chemicals Refining Marketing
& Specialties
Corporate
& Other
3Q 2015
Adjusted
Earnings
3Q 2015 Adjusted Earnings
$MM
91 (112)1,052272 344
ADJUSTED EARNINGS
3Q 2015 VS. 2Q 2015
5
6
MIDSTREAM OVERVIEW
3Q 2015
Transportation Higher volumes, lower operating costs
NGL Strong margins
PSXP Distributions up 7%
DCP Midstream Improved marketing margins
ROCE 5%
ROCE is annualized adjusted YTD
48
91
12
24
7
2Q 2015
Adjusted
Earnings
Transportation NGL DCP
Midstream
3Q 2015
Adjusted
Earnings
$MM
MIDSTREAM
3Q 2015 VS. 2Q 2015
77 32 (18)
3Q 2015 Adjusted Earnings
7
8
CHEMICALS OVERVIEW
3Q 2015
Olefins & Polyolefins Higher volumes and lower costs
Specialties, Aromatics & Styrenics Lower margins and volumes
ROCE 21%
ROCE is annualized adjusted YTD
295
272
(6)
(21)
4
2Q 2015
Adjusted
Earnings
Olefins &
Polyolefins
Specialties,
Aromatics &
Styrenics
Other 3Q 2015
Adjusted
Earnings
$MM
CHEMICALS
3Q 2015 VS. 2Q 2015
9
3Q 2015 Adjusted Earnings
261 (6)17
10
REFINING OVERVIEW
3Q 2015
Realized refining margin $13.96/BBL
Worldwide market capture 72%
Refining crude utilization 96%
Clean product yield 84%
ROCE 21%
ROCE is annualized adjusted YTD
604
1,052
103
202
156
(13)
2Q 2015
Adjusted
Earnings
Atlantic
Basin /
Europe
Gulf Coast Central
Corridor
Western /
Pacific
3Q 2015
Adjusted
Earnings
$MM
REFINING
3Q 2015 VS. 2Q 2015
11
193 372285 202
3Q 2015 Adjusted Earnings
19.51
13.96
(4.14)
(2.47)
0.75 0.31
Market
3:2:1
Configuration Secondary
Products
Feedstock Other Realized
Margin
WORLDWIDE REFINING $/BBL
REFINING MARGINS – MARKET VS. REALIZED
3Q 2015
12
Avg Market Crude: $49.54/BBL 96% Crude Capacity Utilization 72% Market Capture
13
MARKETING AND SPECIALTIES OVERVIEW
3Q 2015
Marketing Higher global margins and volumes
Specialties Strong lubricants margins
ROCE 33%
ROCE is annualized adjusted YTD
182
344
157 5
2Q 2015
Adjusted
Earnings
Marketing
& Other
Specialties 3Q 2015
Adjusted
Earnings
$MM
MARKETING AND SPECIALTIES
3Q 2015 VS. 2Q 2015
14
291 53
3Q 2015 Adjusted Earnings
(127)
(112)
6 3
6
2Q 2015
Adjusted
Net Loss
Net Interest
Expense
Corporate
Overhead Other
3Q 2015
Adjusted
Net Loss
$MM
CORPORATE AND OTHER
3Q 2015 VS. 2Q 2015
15
22.4 22.0
22.6
23.2
24.0
22.0
21.6 21.8
22.4
23.2
6.2
8.7 8.9 9.0 9.0
6.2
8.7 7.8 7.9 7.9
5.4 5.2 5.4 5.1 4.8 5.0 5.2 5.3 5.0 4.7
22%
28% 28% 28%
27%
22%
29%
26% 26% 25%
2013 2014 1Q 2015 2Q 2015 3Q 2015 2013 2014 1Q 2015 2Q 2015 3Q 2015
Equity $B Debt $B Cash & Cash Equivalents $B Debt-to-Capital
20%-30%
CAPITAL STRUCTURE
2013 – 3Q 2015
16
Consolidated PSX Excluding PSXP
5.2 4.8
4.1 0.1
1.5
(0.8)
(3.3)
(2.0)
December
2014 Cash
Balance*
CFO
(excluding
working
capital)
Working
Capital
PSXP Bond &
Equity Proceeds
Debt
Repayment
Capital
Expenditures
& Investments
Shareholder
Distributions
September
2015 Cash
Balance*
$B
CASH FLOW
YTD 2015
17
* Includes cash and cash equivalents
18
Global Olefins & Polyolefins utilization Mid-90%
Refining crude utilization Mid-90%
2015 full year consolidated capital expenditures $4.3 B
Effective income tax rate Mid-30%
Corporate & Other costs (after-tax) $110 MM - $120 MM
OUTLOOK
4Q 2015
Refining turnaround expenses (pre-tax) ~$150 MM
DCP equity contribution $1.5 B
PHILLIPS 66
THIRD QUARTER 2015
CONFERENCE CALL
Questions and Answers
PHILLIPS 66
THIRD QUARTER 2015
CONFERENCE CALL
Appendix
ESTIMATED SENSITIVITIES
2015
21Sensitivities shown above are independent and are only valid within a limited price range
Annual Net Income $MM
Midstream - DCP (net to Phillips 66)
10¢/Gal Increase in NGL price 30
$1/MMBtu Increase in Natural Gas price 25
$10/BBL Increase in WTI price 15
Chemicals - CPChem (net to Phillips 66)
1¢/Lb Increase in Chain Margin (Ethylene, Polyethylene, NAO) 35
Worldwide Refining
$1/BBL Increase in Gasoline Margin 220
$1/BBL Increase in Distillate Margin 200
$1/BBL Widening LLS / Maya Differential (LLS less Maya) 50
$1/BBL Widening WTI / WCS Differential (WTI less WCS) 40
$1/BBL Widening WTI / WTS Differential (WTI less WTS) 15
$1/BBL Widening LLS / Medium Sour Differential (LLS less Medium Sour) 15
$1/BBL Widening ANS / WCS Differential (ANS less WCS) 10
10¢/MMBtu Increase in Natural Gas price (10)
Impacts due to Actual Crude Feedstock Differing from Feedstock Assumed in Market Indicators:
18.32
10.27
(3.96)
(1.14)
(2.06)
(0.89)
Market
3:2:1
Configuration Secondary
Products
Feedstock Other Realized
Margin
ATLANTIC BASIN / EUROPE $/BBL
REFINING MARGINS – MARKET VS. REALIZED
3Q 2015
22
Market 3:2:1 – Dated Brent / Gasoline 83.7 RBOB NYH / Diesel 15ppm NYH
Brent: $50.26/BBL 97% Crude Capacity Utilization 56% Market Capture
13.34
10.72
(3.07)
(3.26)
2.00
1.71
Market
3:2:1
Configuration Secondary
Products
Feedstock Other Realized
Margin
GULF COAST $/BBL
REFINING MARGINS – MARKET VS. REALIZED
3Q 2015
23
Market 3:2:1 – LLS / Gasoline 85 CBOB / Diesel 61 8ppm
LLS: $50.13/BBL 100% Crude Capacity Utilization 80% Market Capture
22.03 20.97
(2.91)
(2.18)
1.10
2.93
Market
3:2:1
Configuration Secondary
Products
Feedstock Other Realized
Margin
CENTRAL CORRIDOR $/BBL
REFINING MARGINS – MARKET VS. REALIZED
3Q 2015
24
Market 3:2:1 – WTI / Gasoline Unl Sub Octane Group 3 / ULSD Group 3
WTI: $46.37/BBL 91% Crude Capacity Utilization 95% Market Capture
30.69
18.29
(6.30)
(3.53)
2.68
(5.25)
Market
3:2:1
Configuration Secondary
Products
Feedstock Other Realized
Margin
WESTERN / PACIFIC $/BBL
REFINING MARGINS – MARKET VS. REALIZED
3Q 2015
25
Market 3:2:1 – ANS Spot / Los Angeles CARBOB / Los Angeles No. 2 CARB
ANS: $51.44/BBL 96% Crude Capacity Utilization 60% Market Capture
1,140
1,647
(24) (27)
494
85
(21)
3Q 2014
Adjusted
Earnings
Midstream Chemicals Refining Marketing
& Specialties
Corporate
& Other
3Q 2015
Adjusted
Earnings
3Q 2015 Adjusted Earnings
$MM
91 (112)1,052272 344
ADJUSTED EARNINGS
3Q 2015 VS. 3Q 2014
26
115
91
19 6
(49)
3Q 2014
Adjusted
Earnings
Transportation NGL DCP
Midstream
3Q 2015
Adjusted
Earnings
$MM
MIDSTREAM
3Q 2015 VS. 3Q 2014
27
77 32 (18)
3Q 2015 Adjusted Earnings
299
272
2
(29) 0
3Q 2014
Adjusted
Earnings
Olefins &
Polyolefins
Specialties,
Aromatics &
Styrenics
Other 3Q 2015
Adjusted
Earnings
$MM
CHEMICALS
3Q 2015 VS. 3Q 2014
28
261 (6)17
3Q 2015 Adjusted Earnings
558
1,052
53
219 44
178
3Q 2014
Adjusted
Earnings
Atlantic
Basin /
Europe
Gulf
Coast
Central
Corridor
Western /
Pacific
3Q 2015
Adjusted
Earnings
$MM
REFINING
3Q 2015 VS. 3Q 2014
29
193 372285 202
3Q 2015 Adjusted Earnings
259
344
75 10
3Q 2014
Adjusted
Earnings
Marketing
& Other
Specialties 3Q 2015
Adjusted
Earnings
$MM
MARKETING AND SPECIALTIES
3Q 2015 VS. 3Q 2014
30
291 53
3Q 2015 Adjusted Earnings
(91)
(112)
(7) (1)
(13)
3Q 2014
Adjusted
Net Loss
Net Interest
Expense
Corporate
Overhead Other
3Q 2015
Adjusted
Net Loss
$MM
CORPORATE AND OTHER
3Q 2015 VS. 3Q 2014
31
5.1 4.8
0.0
1.5
(1.0)
(0.7) (0.1)
June 30
Cash
Balance*
CFO
(excluding
working
capital)
Working
Capital
Capital
Expenditures
&
Investments
Shareholder
Distributions
Other September 30
Cash
Balance*
$B
CASH FLOW
3Q 2015
32
* Includes cash and cash equivalents
33
NON-GAAP RECONCILIATIONS
Sep YTD 3Q 2Q Sep YTD 3Q
Phillips 66
Net Income (Loss) Attributable to Phillips 66 3,577$ 1,578$ 1,012$ 3,615$ 1,180$
Adjustments:
Asset dispositions (265) (18) (132) (109) (109)
Pension settlement expense 46 46 - - -
Impairments by equity affiliates 148 22 126 69 69
Pending claims and settlements (23) 19 (4) - -
Discontinued Operations - - - (706) -
Adjusted Net Income (Loss) Attributable to Phillips 66 3,483$ 1,647$ 1,002$ 2,869$ 1,140$
Net Income (Loss) Attributable to Phillips 66 Per Share of Common Stock (dollars) 6.52$ 2.90$ 1.84$ 6.28$ 2.09$
Adjusted Net Income (Loss) Attributable to Phillips 66 Per Share of Common Stock (dollars) 6.34$ 3.02$ 1.83$ 4.98$ 2.02$
Millions of Dollars
Except as Indicated
2015 2014
34
NON-GAAP RECONCILIATIONS
Sep YTD 3Q 2Q Sep YTD 3Q
Midstream
Net Income (Loss) Attributable to Phillips 66 90$ 101$ (78)$ 411$ 115$
Adjustments:
Pension settlement expense 6 6 - - -
Impairments by equity affiliates 128 2 126 - -
Asset dispositions (18) (18) - - -
Adjusted Net Income (Loss) Attributable to Phillips 66 206$ 91$ 48$ 411$ 115$
Chemicals
Net Income (Loss) Attributable to Phillips 66 750$ 252$ 295$ 870$ 230$
Adjustments:
Impairments by equity affiliates 20 20 - 69 69
Adjusted Net Income (Loss) Attributable to Phillips 66 770$ 272$ 295$ 939$ 299$
Millions of Dollars
Except as Indicated
2015 2014
35
NON-GAAP RECONCILIATIONS
Sep YTD 3Q 2Q Sep YTD 3Q
Refining
Net Income (Loss) Attributable to Phillips 66 2,145$ 1,003$ 604$ 1,254$ 558$
Adjustments:
Asset dispositions (5) - - - -
Pension settlement expense 30 30 - - -
Pending claims and settlements (19) 19 - - -
Adjusted Net Income (Loss) Attributable to Phillips 66 2,151$ 1,052$ 604$ 1,254$ 558$
Marketing & Specialties
Net Income (Loss) Attributable to Phillips 66 956$ 338$ 314$ 667$ 368$
Adjustments:
Asset dispositions (242) - (132) (109) (109)
Pension settlement expense 6 6 - - -
Adjusted Net Income (Loss) Attributable to Phillips 66 720$ 344$ 182$ 558$ 259$
Corporate and Other
Net Income (Loss) Attributable to Phillips 66 (364)$ (116)$ (123)$ (293)$ (91)$
Adjustments:
Pension settlement expense 4 4 - - -
Pending claims and settlements (4) - (4) - -
Adjusted Net Income (Loss) Attributable to Phillips 66 (364)$ (112)$ (127)$ (293)$ (91)$
2015 2014
Millions of Dollars
Except as Indicated
36
NON-GAAP RECONCILIATIONS
Sep YTD 3Q 2Q Sep YTD 3Q
Midstream - Transportation
Net Income (Loss) Attributable to Phillips 66 207$ 77$ 65$ 180$ 58$
Adjustments:
Adjusted Net Income (Loss) Attributable to Phillips 66 207$ 77$ 65$ 180$ 58$
Midstream - NGL
Net Income (Loss) Attributable to Phillips 66 48$ 26$ 8$ 84$ 26$
Adjustments:
Pension settlement expense 6 6 - - -
Adjusted Net Income (Loss) Attributable to Phillips 66 54$ 32$ 8$ 84$ 26$
Midstream - DCP Midstream
Net Income (Loss) Attributable to Phillips 66 (165)$ (2)$ (151)$ 147$ 31$
Adjustments:
Impairments by equity affiliates 128 2 126 - -
Asset dispositions (18) (18) - - -
Adjusted Net Income (Loss) Attributable to Phillips 66 (55)$ (18)$ (25)$ 147$ 31$
Millions of Dollars
Except as Indicated
2015 2014
37
NON-GAAP RECONCILIATIONS
Sep YTD 3Q 2Q Sep YTD 3Q
Refining - Atlantic Basin / Europe
Net Income (Loss) Attributable to Phillips 66 383$ 180$ 90$ 141$ 140$
Adjustments:
Pension settlement expense 8 8 - - -
Pending claims and settlements (33) 5 - - -
Adjusted Net Income (Loss) Attributable to Phillips 66 358$ 193$ 90$ 141$ 140$
Refining - Gulf Coast
Net Income (Loss) Attributable to Phillips 66 423$ 269$ 83$ 263$ 66$
Adjustments:
Pension settlement expense 10 10 - - -
Pending claims and settlements 6 6 - - -
Adjusted Net Income (Loss) Attributable to Phillips 66 439$ 285$ 83$ 263$ 66$
Millions of Dollars
Except as Indicated
2015 2014
38
NON-GAAP RECONCILIATIONS
Sep YTD 3Q 2Q Sep YTD 3Q
Refining - Central Corridor
Net Income (Loss) Attributable to Phillips 66 771$ 360$ 216$ 785$ 328$
Adjustments:
Pension settlement expense 7 7 - - -
Pending claims and settlements 5 5 - - -
Adjusted Net Income (Loss) Attributable to Phillips 66 783$ 372$ 216$ 785$ 328$
Refining - Western / Pacific
Net Income (Loss) Attributable to Phillips 66 568$ 194$ 215$ 65$ 24$
Adjustments:
Pension settlement expense 5 5 - - -
Pending claims and settlements 3 3 - - -
Asset dispositions (5) - - - -
Adjusted Net Income (Loss) Attributable to Phillips 66 571$ 202$ 215$ 65$ 24$
Millions of Dollars
Except as Indicated
2015 2014
39
NON-GAAP RECONCILIATIONS
Sep YTD 3Q 2Q Sep YTD 3Q
Marketing & Specialties - Marketing & Other
Net Income (Loss) Attributable to Phillips 66 805$ 285$ 266$ 537$ 325$
Adjustments:
Asset dispositions (242) - (132) (109) (109)
Pension settlement expense 6 6 - - -
Adjusted Net Income (Loss) Attributable to Phillips 66 569$ 291$ 134$ 428$ 216$
Marketing & Specialties - Specialties
Net Income (Loss) Attributable to Phillips 66 151$ 53$ 48$ 130$ 43$
Adjustments:
Adjusted Net Income (Loss) Attributable to Phillips 66 151$ 53$ 48$ 130$ 43$
Millions of Dollars
Except as Indicated
20142015
2015 YTD Phillips 66 Midstream Chemicals Refining
Marketing
& Specialties
Numerator ($MM)
Net Income 3,614 132 750 2,145 956
After-tax interest expense 153 - - - -
GAAP ROCE earnings 3,767 132 750 2,145 956
Special Items (94) 116 20 6 (236)
Adjusted ROCE earnings 3,673 248 770 2,151 720
Denominator ($MM)
GAAP average capital employed* 31,853 6,104 4,883 13,637 2,933
2015 Annualized Adjusted YTD ROCE 15% 5% 21% 21% 33%
2015 Annualized GAAP YTD ROCE 16% 3% 20% 21% 43%
40* Total equity plus total debt
NON-GAAP RECONCILIATIONS
41
NON-GAAP RECONCILIATIONS
Phillips 66
Consolidated
Phillips 66
Partners
Adjusted
Phillips 66
Total Debt 8,951$ 1,100$ 7,851$
Total Equity 24,032$ 805$ 23,227$
Debt-to-Capital Ratio 27% 25%
Total Cash 4,822$ 73$ 4,749$
Net-Debt-to-Capital Ratio 15% 12%
2015
3Q
Millions of Dollars
42
NON-GAAP RECONCILIATIONS
Millions of Dollars
2015
3Q
Effective Tax Rates
Income before taxes 2,359$
Special items 99$
Adjusted income before taxes 2,458$
Provision for taxes 767$
Special items 30$
Adjusted provision for taxes 797$
GAAP effective tax rate 33%
Adjusted effective tax rate 32%

More Related Content

What's hot

Management Investor Presentation - Year End 2015
Management Investor Presentation - Year End 2015Management Investor Presentation - Year End 2015
Management Investor Presentation - Year End 2015RioCan
 
Q3 16 slides ugi-v_final
Q3 16 slides ugi-v_finalQ3 16 slides ugi-v_final
Q3 16 slides ugi-v_finalUGI_Corporation
 
En link midstream 3q 2016 operations report final
En link midstream 3q 2016 operations report finalEn link midstream 3q 2016 operations report final
En link midstream 3q 2016 operations report finalEnLinkMidstreamLLC
 
Visão Geral da Petrobras
Visão Geral da PetrobrasVisão Geral da Petrobras
Visão Geral da PetrobrasPetrobras
 
Teekay Corporation Q2-2019 Earnings Presentation
Teekay Corporation Q2-2019 Earnings PresentationTeekay Corporation Q2-2019 Earnings Presentation
Teekay Corporation Q2-2019 Earnings PresentationTeekay Corporation
 
4 q15 earnings slide deck final
4 q15 earnings slide deck   final4 q15 earnings slide deck   final
4 q15 earnings slide deck finalinvestorswci
 
Sun investor presentation may 2018 final
Sun investor presentation may 2018 finalSun investor presentation may 2018 final
Sun investor presentation may 2018 finalSunocoLP
 
Apresentação de Pedro Parente no Investor Day Londres
Apresentação de Pedro Parente no Investor Day LondresApresentação de Pedro Parente no Investor Day Londres
Apresentação de Pedro Parente no Investor Day LondresPetrobras
 
February 2017 enlk and enlc operations report
February 2017 enlk and enlc operations reportFebruary 2017 enlk and enlc operations report
February 2017 enlk and enlc operations reportEnLinkMidstreamLLC
 
2017 12 capital one conference final
2017 12 capital one conference final2017 12 capital one conference final
2017 12 capital one conference finalDenbury
 
Arex 3 q15 results presentation
Arex 3 q15 results presentationArex 3 q15 results presentation
Arex 3 q15 results presentationApproachResources
 
Webcast 4Q15
Webcast 4Q15Webcast 4Q15
Webcast 4Q15Petrobras
 
Constellation Energy Partners - Q4 2013
Constellation Energy Partners - Q4 2013Constellation Energy Partners - Q4 2013
Constellation Energy Partners - Q4 2013BRS Resources Ltd.
 
1 q16 earnings-presentation-final
1 q16 earnings-presentation-final1 q16 earnings-presentation-final
1 q16 earnings-presentation-finalinvestorswci
 
Teekay Corporation Q3-2015 Earnings Presentation
Teekay Corporation Q3-2015 Earnings PresentationTeekay Corporation Q3-2015 Earnings Presentation
Teekay Corporation Q3-2015 Earnings PresentationTeekay Corporation
 
Am website presentation november 2016
Am website presentation   november 2016Am website presentation   november 2016
Am website presentation november 2016anteromidstream
 
Fy17 q2 slides ameri-gas_vfinal
Fy17 q2   slides ameri-gas_vfinalFy17 q2   slides ameri-gas_vfinal
Fy17 q2 slides ameri-gas_vfinalAmeriGas
 
MarkWest Energy 1Q15 Conference Call Presentation
MarkWest Energy 1Q15 Conference Call PresentationMarkWest Energy 1Q15 Conference Call Presentation
MarkWest Energy 1Q15 Conference Call PresentationMarcellus Drilling News
 
Q1 16 slides ugi-v_final
Q1 16 slides ugi-v_finalQ1 16 slides ugi-v_final
Q1 16 slides ugi-v_finalAmeriGas
 

What's hot (20)

Management Investor Presentation - Year End 2015
Management Investor Presentation - Year End 2015Management Investor Presentation - Year End 2015
Management Investor Presentation - Year End 2015
 
Q3 16 slides ugi-v_final
Q3 16 slides ugi-v_finalQ3 16 slides ugi-v_final
Q3 16 slides ugi-v_final
 
2016 shareholdermeetingfinal
2016 shareholdermeetingfinal2016 shareholdermeetingfinal
2016 shareholdermeetingfinal
 
En link midstream 3q 2016 operations report final
En link midstream 3q 2016 operations report finalEn link midstream 3q 2016 operations report final
En link midstream 3q 2016 operations report final
 
Visão Geral da Petrobras
Visão Geral da PetrobrasVisão Geral da Petrobras
Visão Geral da Petrobras
 
Teekay Corporation Q2-2019 Earnings Presentation
Teekay Corporation Q2-2019 Earnings PresentationTeekay Corporation Q2-2019 Earnings Presentation
Teekay Corporation Q2-2019 Earnings Presentation
 
4 q15 earnings slide deck final
4 q15 earnings slide deck   final4 q15 earnings slide deck   final
4 q15 earnings slide deck final
 
Sun investor presentation may 2018 final
Sun investor presentation may 2018 finalSun investor presentation may 2018 final
Sun investor presentation may 2018 final
 
Apresentação de Pedro Parente no Investor Day Londres
Apresentação de Pedro Parente no Investor Day LondresApresentação de Pedro Parente no Investor Day Londres
Apresentação de Pedro Parente no Investor Day Londres
 
February 2017 enlk and enlc operations report
February 2017 enlk and enlc operations reportFebruary 2017 enlk and enlc operations report
February 2017 enlk and enlc operations report
 
2017 12 capital one conference final
2017 12 capital one conference final2017 12 capital one conference final
2017 12 capital one conference final
 
Arex 3 q15 results presentation
Arex 3 q15 results presentationArex 3 q15 results presentation
Arex 3 q15 results presentation
 
Webcast 4Q15
Webcast 4Q15Webcast 4Q15
Webcast 4Q15
 
Constellation Energy Partners - Q4 2013
Constellation Energy Partners - Q4 2013Constellation Energy Partners - Q4 2013
Constellation Energy Partners - Q4 2013
 
1 q16 earnings-presentation-final
1 q16 earnings-presentation-final1 q16 earnings-presentation-final
1 q16 earnings-presentation-final
 
Teekay Corporation Q3-2015 Earnings Presentation
Teekay Corporation Q3-2015 Earnings PresentationTeekay Corporation Q3-2015 Earnings Presentation
Teekay Corporation Q3-2015 Earnings Presentation
 
Am website presentation november 2016
Am website presentation   november 2016Am website presentation   november 2016
Am website presentation november 2016
 
Fy17 q2 slides ameri-gas_vfinal
Fy17 q2   slides ameri-gas_vfinalFy17 q2   slides ameri-gas_vfinal
Fy17 q2 slides ameri-gas_vfinal
 
MarkWest Energy 1Q15 Conference Call Presentation
MarkWest Energy 1Q15 Conference Call PresentationMarkWest Energy 1Q15 Conference Call Presentation
MarkWest Energy 1Q15 Conference Call Presentation
 
Q1 16 slides ugi-v_final
Q1 16 slides ugi-v_finalQ1 16 slides ugi-v_final
Q1 16 slides ugi-v_final
 

Similar to Phillips 66 Third-Quarter Earnings Conference Call

PHILLIPS 66 FIRST QUARTER CONFERENCE CALL
PHILLIPS 66 FIRST QUARTER CONFERENCE CALLPHILLIPS 66 FIRST QUARTER CONFERENCE CALL
PHILLIPS 66 FIRST QUARTER CONFERENCE CALLinvestor_phillips66
 
Phillips66 Q4 2014 Press Release Slides
Phillips66 Q4 2014 Press Release SlidesPhillips66 Q4 2014 Press Release Slides
Phillips66 Q4 2014 Press Release Slidesinvestor_phillips66
 
Psx q3 2016 earnings slides final
Psx q3 2016 earnings slides   finalPsx q3 2016 earnings slides   final
Psx q3 2016 earnings slides finalinvestor_phillips66
 
Psx q2 2016 press release slides final
Psx q2 2016 press release slides finalPsx q2 2016 press release slides final
Psx q2 2016 press release slides finalinvestor_phillips66
 
Phillips 66 Fourth-Quarter Earnings Conference Call
Phillips 66 Fourth-Quarter Earnings Conference CallPhillips 66 Fourth-Quarter Earnings Conference Call
Phillips 66 Fourth-Quarter Earnings Conference Callinvestor_phillips66
 
2015 citi may presentation-final
2015 citi  may presentation-final2015 citi  may presentation-final
2015 citi may presentation-finalinvestor_phillips66
 
Phillips 66 ubs austin 2014 final 2014-08-14
Phillips 66   ubs austin 2014 final 2014-08-14Phillips 66   ubs austin 2014 final 2014-08-14
Phillips 66 ubs austin 2014 final 2014-08-14investor_phillips66
 
Investor update march 2016 website
Investor update march 2016 websiteInvestor update march 2016 website
Investor update march 2016 websiteinvestor_phillips66
 
Phillips 66 -2015-investor-update-1_q-2015_p66-com
Phillips 66 -2015-investor-update-1_q-2015_p66-comPhillips 66 -2015-investor-update-1_q-2015_p66-com
Phillips 66 -2015-investor-update-1_q-2015_p66-cominvestor_phillips66
 
2017 1 q conference presentation tgt -final for posting
2017 1 q conference presentation tgt -final for posting2017 1 q conference presentation tgt -final for posting
2017 1 q conference presentation tgt -final for postinginvestor_phillips66
 
Trc q1 2016 earnings slides final
Trc q1 2016 earnings slides finalTrc q1 2016 earnings slides final
Trc q1 2016 earnings slides finaltrcsolutions
 
Trc q1 2015 earnings slides final
Trc q1 2015 earnings slides finalTrc q1 2015 earnings slides final
Trc q1 2015 earnings slides finaltrcsolutions
 
2015 credit-suisse-final v001-h4mb7r
2015 credit-suisse-final v001-h4mb7r2015 credit-suisse-final v001-h4mb7r
2015 credit-suisse-final v001-h4mb7rinvestor_phillips66
 
Trc q2 2015 earnings slides final
Trc q2 2015 earnings slides finalTrc q2 2015 earnings slides final
Trc q2 2015 earnings slides finaltrcsolutions
 
Apresentação 3 t15_master_inglês_final v2
Apresentação 3 t15_master_inglês_final v2Apresentação 3 t15_master_inglês_final v2
Apresentação 3 t15_master_inglês_final v2CPFL RI
 
Uct investor presentation spring 2018
Uct investor presentation   spring 2018Uct investor presentation   spring 2018
Uct investor presentation spring 2018Ultracleanir
 

Similar to Phillips 66 Third-Quarter Earnings Conference Call (20)

PHILLIPS 66 FIRST QUARTER CONFERENCE CALL
PHILLIPS 66 FIRST QUARTER CONFERENCE CALLPHILLIPS 66 FIRST QUARTER CONFERENCE CALL
PHILLIPS 66 FIRST QUARTER CONFERENCE CALL
 
Phillips66 Q4 2014 Press Release Slides
Phillips66 Q4 2014 Press Release SlidesPhillips66 Q4 2014 Press Release Slides
Phillips66 Q4 2014 Press Release Slides
 
Psx q3 2016 earnings slides final
Psx q3 2016 earnings slides   finalPsx q3 2016 earnings slides   final
Psx q3 2016 earnings slides final
 
Psx q2 2016 press release slides final
Psx q2 2016 press release slides finalPsx q2 2016 press release slides final
Psx q2 2016 press release slides final
 
Phillips 66 Fourth-Quarter Earnings Conference Call
Phillips 66 Fourth-Quarter Earnings Conference CallPhillips 66 Fourth-Quarter Earnings Conference Call
Phillips 66 Fourth-Quarter Earnings Conference Call
 
2015 citi may presentation-final
2015 citi  may presentation-final2015 citi  may presentation-final
2015 citi may presentation-final
 
Q22015 investorupdatepsxpsxp
Q22015 investorupdatepsxpsxpQ22015 investorupdatepsxpsxp
Q22015 investorupdatepsxpsxp
 
Phillips 66 ubs austin 2014 final 2014-08-14
Phillips 66   ubs austin 2014 final 2014-08-14Phillips 66   ubs austin 2014 final 2014-08-14
Phillips 66 ubs austin 2014 final 2014-08-14
 
Investor update march 2016 website
Investor update march 2016 websiteInvestor update march 2016 website
Investor update march 2016 website
 
Phillips 66 -2015-investor-update-1_q-2015_p66-com
Phillips 66 -2015-investor-update-1_q-2015_p66-comPhillips 66 -2015-investor-update-1_q-2015_p66-com
Phillips 66 -2015-investor-update-1_q-2015_p66-com
 
2017 1 q conference presentation tgt -final for posting
2017 1 q conference presentation tgt -final for posting2017 1 q conference presentation tgt -final for posting
2017 1 q conference presentation tgt -final for posting
 
2015 credit suisse final
2015 credit suisse final2015 credit suisse final
2015 credit suisse final
 
Phillips 66 2015 baml-p66.com
Phillips 66   2015 baml-p66.comPhillips 66   2015 baml-p66.com
Phillips 66 2015 baml-p66.com
 
Winter 2018
Winter 2018Winter 2018
Winter 2018
 
Trc q1 2016 earnings slides final
Trc q1 2016 earnings slides finalTrc q1 2016 earnings slides final
Trc q1 2016 earnings slides final
 
Trc q1 2015 earnings slides final
Trc q1 2015 earnings slides finalTrc q1 2015 earnings slides final
Trc q1 2015 earnings slides final
 
2015 credit-suisse-final v001-h4mb7r
2015 credit-suisse-final v001-h4mb7r2015 credit-suisse-final v001-h4mb7r
2015 credit-suisse-final v001-h4mb7r
 
Trc q2 2015 earnings slides final
Trc q2 2015 earnings slides finalTrc q2 2015 earnings slides final
Trc q2 2015 earnings slides final
 
Apresentação 3 t15_master_inglês_final v2
Apresentação 3 t15_master_inglês_final v2Apresentação 3 t15_master_inglês_final v2
Apresentação 3 t15_master_inglês_final v2
 
Uct investor presentation spring 2018
Uct investor presentation   spring 2018Uct investor presentation   spring 2018
Uct investor presentation spring 2018
 

Recently uploaded

Collective Mining | Corporate Presentation - April 2024
Collective Mining | Corporate Presentation - April 2024Collective Mining | Corporate Presentation - April 2024
Collective Mining | Corporate Presentation - April 2024CollectiveMining1
 
VIP 7001035870 Find & Meet Hyderabad Call Girls Banjara Hills high-profile Ca...
VIP 7001035870 Find & Meet Hyderabad Call Girls Banjara Hills high-profile Ca...VIP 7001035870 Find & Meet Hyderabad Call Girls Banjara Hills high-profile Ca...
VIP 7001035870 Find & Meet Hyderabad Call Girls Banjara Hills high-profile Ca...aditipandeya
 
Russian Call Girls Kolkata Amaira 🤌 8250192130 🚀 Vip Call Girls Kolkata
Russian Call Girls Kolkata Amaira 🤌  8250192130 🚀 Vip Call Girls KolkataRussian Call Girls Kolkata Amaira 🤌  8250192130 🚀 Vip Call Girls Kolkata
Russian Call Girls Kolkata Amaira 🤌 8250192130 🚀 Vip Call Girls Kolkataanamikaraghav4
 
9654467111 Low Rate Call Girls In Tughlakabad, Delhi NCR
9654467111 Low Rate Call Girls In Tughlakabad, Delhi NCR9654467111 Low Rate Call Girls In Tughlakabad, Delhi NCR
9654467111 Low Rate Call Girls In Tughlakabad, Delhi NCRSapana Sha
 
VIP Kolkata Call Girl Entally 👉 8250192130 Available With Room
VIP Kolkata Call Girl Entally 👉 8250192130  Available With RoomVIP Kolkata Call Girl Entally 👉 8250192130  Available With Room
VIP Kolkata Call Girl Entally 👉 8250192130 Available With Roomdivyansh0kumar0
 
VIP 7001035870 Find & Meet Hyderabad Call Girls Miyapur high-profile Call Girl
VIP 7001035870 Find & Meet Hyderabad Call Girls Miyapur high-profile Call GirlVIP 7001035870 Find & Meet Hyderabad Call Girls Miyapur high-profile Call Girl
VIP 7001035870 Find & Meet Hyderabad Call Girls Miyapur high-profile Call Girladitipandeya
 
如何办理(UTS毕业证书)悉尼科技大学毕业证学位证书
如何办理(UTS毕业证书)悉尼科技大学毕业证学位证书如何办理(UTS毕业证书)悉尼科技大学毕业证学位证书
如何办理(UTS毕业证书)悉尼科技大学毕业证学位证书Fis s
 
Malad Escorts, (Pooja 09892124323), Malad Call Girls Service
Malad Escorts, (Pooja 09892124323), Malad Call Girls ServiceMalad Escorts, (Pooja 09892124323), Malad Call Girls Service
Malad Escorts, (Pooja 09892124323), Malad Call Girls ServicePooja Nehwal
 
Short-, Mid-, and Long-term gxxoals.pptx
Short-, Mid-, and Long-term gxxoals.pptxShort-, Mid-, and Long-term gxxoals.pptx
Short-, Mid-, and Long-term gxxoals.pptxHenryBriggs2
 
9654467111 Call Girls In Katwaria Sarai Short 1500 Night 6000
9654467111 Call Girls In Katwaria Sarai Short 1500 Night 60009654467111 Call Girls In Katwaria Sarai Short 1500 Night 6000
9654467111 Call Girls In Katwaria Sarai Short 1500 Night 6000Sapana Sha
 
Sustainability Leadership, April 26 2024
Sustainability Leadership, April 26 2024Sustainability Leadership, April 26 2024
Sustainability Leadership, April 26 2024TeckResourcesLtd
 
Methanex Investor Presentation (April 2024)
Methanex Investor Presentation (April 2024)Methanex Investor Presentation (April 2024)
Methanex Investor Presentation (April 2024)Methanex Corporation
 
High Profile Call Girls Kolkata Trisha 🤌 8250192130 🚀 Vip Call Girls Kolkata
High Profile Call Girls Kolkata Trisha 🤌  8250192130 🚀 Vip Call Girls KolkataHigh Profile Call Girls Kolkata Trisha 🤌  8250192130 🚀 Vip Call Girls Kolkata
High Profile Call Girls Kolkata Trisha 🤌 8250192130 🚀 Vip Call Girls Kolkataanamikaraghav4
 
如何办理密苏里大学堪萨斯分校毕业证(文凭)UMKC学位证书
如何办理密苏里大学堪萨斯分校毕业证(文凭)UMKC学位证书如何办理密苏里大学堪萨斯分校毕业证(文凭)UMKC学位证书
如何办理密苏里大学堪萨斯分校毕业证(文凭)UMKC学位证书Fir La
 

Recently uploaded (20)

Collective Mining | Corporate Presentation - April 2024
Collective Mining | Corporate Presentation - April 2024Collective Mining | Corporate Presentation - April 2024
Collective Mining | Corporate Presentation - April 2024
 
VIP 7001035870 Find & Meet Hyderabad Call Girls Banjara Hills high-profile Ca...
VIP 7001035870 Find & Meet Hyderabad Call Girls Banjara Hills high-profile Ca...VIP 7001035870 Find & Meet Hyderabad Call Girls Banjara Hills high-profile Ca...
VIP 7001035870 Find & Meet Hyderabad Call Girls Banjara Hills high-profile Ca...
 
Model Call Girl in Udyog Vihar Delhi reach out to us at 🔝9953056974🔝
Model Call Girl in Udyog Vihar Delhi reach out to us at 🔝9953056974🔝Model Call Girl in Udyog Vihar Delhi reach out to us at 🔝9953056974🔝
Model Call Girl in Udyog Vihar Delhi reach out to us at 🔝9953056974🔝
 
Russian Call Girls Kolkata Amaira 🤌 8250192130 🚀 Vip Call Girls Kolkata
Russian Call Girls Kolkata Amaira 🤌  8250192130 🚀 Vip Call Girls KolkataRussian Call Girls Kolkata Amaira 🤌  8250192130 🚀 Vip Call Girls Kolkata
Russian Call Girls Kolkata Amaira 🤌 8250192130 🚀 Vip Call Girls Kolkata
 
9654467111 Low Rate Call Girls In Tughlakabad, Delhi NCR
9654467111 Low Rate Call Girls In Tughlakabad, Delhi NCR9654467111 Low Rate Call Girls In Tughlakabad, Delhi NCR
9654467111 Low Rate Call Girls In Tughlakabad, Delhi NCR
 
VIP Kolkata Call Girl Entally 👉 8250192130 Available With Room
VIP Kolkata Call Girl Entally 👉 8250192130  Available With RoomVIP Kolkata Call Girl Entally 👉 8250192130  Available With Room
VIP Kolkata Call Girl Entally 👉 8250192130 Available With Room
 
VIP 7001035870 Find & Meet Hyderabad Call Girls Miyapur high-profile Call Girl
VIP 7001035870 Find & Meet Hyderabad Call Girls Miyapur high-profile Call GirlVIP 7001035870 Find & Meet Hyderabad Call Girls Miyapur high-profile Call Girl
VIP 7001035870 Find & Meet Hyderabad Call Girls Miyapur high-profile Call Girl
 
Call Girls 🫤 Nehru Place ➡️ 9999965857 ➡️ Delhi 🫦 Russian Escorts FULL ENJOY
Call Girls 🫤 Nehru Place ➡️ 9999965857  ➡️ Delhi 🫦  Russian Escorts FULL ENJOYCall Girls 🫤 Nehru Place ➡️ 9999965857  ➡️ Delhi 🫦  Russian Escorts FULL ENJOY
Call Girls 🫤 Nehru Place ➡️ 9999965857 ➡️ Delhi 🫦 Russian Escorts FULL ENJOY
 
如何办理(UTS毕业证书)悉尼科技大学毕业证学位证书
如何办理(UTS毕业证书)悉尼科技大学毕业证学位证书如何办理(UTS毕业证书)悉尼科技大学毕业证学位证书
如何办理(UTS毕业证书)悉尼科技大学毕业证学位证书
 
Malad Escorts, (Pooja 09892124323), Malad Call Girls Service
Malad Escorts, (Pooja 09892124323), Malad Call Girls ServiceMalad Escorts, (Pooja 09892124323), Malad Call Girls Service
Malad Escorts, (Pooja 09892124323), Malad Call Girls Service
 
Short-, Mid-, and Long-term gxxoals.pptx
Short-, Mid-, and Long-term gxxoals.pptxShort-, Mid-, and Long-term gxxoals.pptx
Short-, Mid-, and Long-term gxxoals.pptx
 
Call Girls 🫤 Mukherjee Nagar ➡️ 9999965857 ➡️ Delhi 🫦 Russian Escorts FULL ...
Call Girls 🫤 Mukherjee Nagar ➡️ 9999965857  ➡️ Delhi 🫦  Russian Escorts FULL ...Call Girls 🫤 Mukherjee Nagar ➡️ 9999965857  ➡️ Delhi 🫦  Russian Escorts FULL ...
Call Girls 🫤 Mukherjee Nagar ➡️ 9999965857 ➡️ Delhi 🫦 Russian Escorts FULL ...
 
young Call girls in Dwarka sector 1🔝 9953056974 🔝 Delhi escort Service
young Call girls in Dwarka sector 1🔝 9953056974 🔝 Delhi escort Serviceyoung Call girls in Dwarka sector 1🔝 9953056974 🔝 Delhi escort Service
young Call girls in Dwarka sector 1🔝 9953056974 🔝 Delhi escort Service
 
9654467111 Call Girls In Katwaria Sarai Short 1500 Night 6000
9654467111 Call Girls In Katwaria Sarai Short 1500 Night 60009654467111 Call Girls In Katwaria Sarai Short 1500 Night 6000
9654467111 Call Girls In Katwaria Sarai Short 1500 Night 6000
 
Sustainability Leadership, April 26 2024
Sustainability Leadership, April 26 2024Sustainability Leadership, April 26 2024
Sustainability Leadership, April 26 2024
 
Methanex Investor Presentation (April 2024)
Methanex Investor Presentation (April 2024)Methanex Investor Presentation (April 2024)
Methanex Investor Presentation (April 2024)
 
Preet Vihar (Delhi) 9953330565 Escorts, Call Girls Services
Preet Vihar (Delhi) 9953330565 Escorts, Call Girls ServicesPreet Vihar (Delhi) 9953330565 Escorts, Call Girls Services
Preet Vihar (Delhi) 9953330565 Escorts, Call Girls Services
 
High Profile Call Girls Kolkata Trisha 🤌 8250192130 🚀 Vip Call Girls Kolkata
High Profile Call Girls Kolkata Trisha 🤌  8250192130 🚀 Vip Call Girls KolkataHigh Profile Call Girls Kolkata Trisha 🤌  8250192130 🚀 Vip Call Girls Kolkata
High Profile Call Girls Kolkata Trisha 🤌 8250192130 🚀 Vip Call Girls Kolkata
 
如何办理密苏里大学堪萨斯分校毕业证(文凭)UMKC学位证书
如何办理密苏里大学堪萨斯分校毕业证(文凭)UMKC学位证书如何办理密苏里大学堪萨斯分校毕业证(文凭)UMKC学位证书
如何办理密苏里大学堪萨斯分校毕业证(文凭)UMKC学位证书
 
Model Call Girl in Uttam Nagar Delhi reach out to us at 🔝9953056974🔝
Model Call Girl in Uttam Nagar Delhi reach out to us at 🔝9953056974🔝Model Call Girl in Uttam Nagar Delhi reach out to us at 🔝9953056974🔝
Model Call Girl in Uttam Nagar Delhi reach out to us at 🔝9953056974🔝
 

Phillips 66 Third-Quarter Earnings Conference Call

  • 1. PHILLIPS 66 THIRD QUARTER CONFERENCE CALL October 30, 2015
  • 2. This presentation contains certain forward-looking statements within the meaning of Section 27A of the Securities Act of 1933, as amended, and Section 21E of the Securities Exchange Act of 1934, as amended, which are intended to be covered by the safe harbors created thereby. Words and phrases such as “is anticipated,” “is estimated,” “is expected,” “is planned,” “is scheduled,” “is targeted,” “believes,” “intends,” “objectives,” “projects,” “strategies” and similar expressions are used to identify such forward-looking statements. However, the absence of these words does not mean that a statement is not forward-looking. Forward-looking statements relating to Phillips 66’s operations (including joint venture operations) are based on management’s expectations, estimates and projections about the company, its interests and the energy industry in general on the date this presentation was prepared. These statements are not guarantees of future performance and involve certain risks, uncertainties and assumptions that are difficult to predict. Therefore, actual outcomes and results may differ materially from what is expressed or forecast in such forward-looking statements. Factors that could cause actual results or events to differ materially from those described in the forward-looking statements include fluctuations in NGL, crude oil and natural gas prices, and petrochemical and refining margins; unexpected changes in costs for constructing, modifying or operating our facilities; unexpected difficulties in manufacturing, refining or transporting our products; lack of, or disruptions in, adequate and reliable transportation for our NGL, crude oil, natural gas and refined products; potential liability from litigation or for remedial actions, including removal and reclamation obligations, under environmental regulations; limited access to capital or significantly higher cost of capital related to illiquidity or uncertainty in the domestic or international financial markets; and other economic, business, competitive and/or regulatory factors affecting Phillips 66’s businesses generally as set forth in our filings with the Securities and Exchange Commission. Phillips 66 is under no obligation (and expressly disclaims any such obligation) to update or alter its forward-looking statements, whether as a result of new information, future events or otherwise. This presentation includes non-GAAP financial measures. You can find the reconciliations to comparable GAAP financial measures at the end of the presentation materials or in the “Investors” section of our website. CAUTIONARY STATEMENT 2
  • 4. 4 OVERVIEW 3Q 2015 Adjusted Earnings $1.6 B Adjusted EPS $3.02 Operating cash flow excluding working capital $1.5 B Capital expenditures and investments $1.0 B Shareholder distributions $673 MM Adjusted net debt-to-capital ratio 12% Annualized adjusted YTD ROCE 15% Shareholder distributions include dividends and share repurchases Adjusted net debt-to-capital ratio excludes the impacts of PSXP
  • 5. 1,002 1,647 43 (23) 448 162 15 2Q 2015 Adjusted Earnings Midstream Chemicals Refining Marketing & Specialties Corporate & Other 3Q 2015 Adjusted Earnings 3Q 2015 Adjusted Earnings $MM 91 (112)1,052272 344 ADJUSTED EARNINGS 3Q 2015 VS. 2Q 2015 5
  • 6. 6 MIDSTREAM OVERVIEW 3Q 2015 Transportation Higher volumes, lower operating costs NGL Strong margins PSXP Distributions up 7% DCP Midstream Improved marketing margins ROCE 5% ROCE is annualized adjusted YTD
  • 7. 48 91 12 24 7 2Q 2015 Adjusted Earnings Transportation NGL DCP Midstream 3Q 2015 Adjusted Earnings $MM MIDSTREAM 3Q 2015 VS. 2Q 2015 77 32 (18) 3Q 2015 Adjusted Earnings 7
  • 8. 8 CHEMICALS OVERVIEW 3Q 2015 Olefins & Polyolefins Higher volumes and lower costs Specialties, Aromatics & Styrenics Lower margins and volumes ROCE 21% ROCE is annualized adjusted YTD
  • 9. 295 272 (6) (21) 4 2Q 2015 Adjusted Earnings Olefins & Polyolefins Specialties, Aromatics & Styrenics Other 3Q 2015 Adjusted Earnings $MM CHEMICALS 3Q 2015 VS. 2Q 2015 9 3Q 2015 Adjusted Earnings 261 (6)17
  • 10. 10 REFINING OVERVIEW 3Q 2015 Realized refining margin $13.96/BBL Worldwide market capture 72% Refining crude utilization 96% Clean product yield 84% ROCE 21% ROCE is annualized adjusted YTD
  • 11. 604 1,052 103 202 156 (13) 2Q 2015 Adjusted Earnings Atlantic Basin / Europe Gulf Coast Central Corridor Western / Pacific 3Q 2015 Adjusted Earnings $MM REFINING 3Q 2015 VS. 2Q 2015 11 193 372285 202 3Q 2015 Adjusted Earnings
  • 12. 19.51 13.96 (4.14) (2.47) 0.75 0.31 Market 3:2:1 Configuration Secondary Products Feedstock Other Realized Margin WORLDWIDE REFINING $/BBL REFINING MARGINS – MARKET VS. REALIZED 3Q 2015 12 Avg Market Crude: $49.54/BBL 96% Crude Capacity Utilization 72% Market Capture
  • 13. 13 MARKETING AND SPECIALTIES OVERVIEW 3Q 2015 Marketing Higher global margins and volumes Specialties Strong lubricants margins ROCE 33% ROCE is annualized adjusted YTD
  • 14. 182 344 157 5 2Q 2015 Adjusted Earnings Marketing & Other Specialties 3Q 2015 Adjusted Earnings $MM MARKETING AND SPECIALTIES 3Q 2015 VS. 2Q 2015 14 291 53 3Q 2015 Adjusted Earnings
  • 15. (127) (112) 6 3 6 2Q 2015 Adjusted Net Loss Net Interest Expense Corporate Overhead Other 3Q 2015 Adjusted Net Loss $MM CORPORATE AND OTHER 3Q 2015 VS. 2Q 2015 15
  • 16. 22.4 22.0 22.6 23.2 24.0 22.0 21.6 21.8 22.4 23.2 6.2 8.7 8.9 9.0 9.0 6.2 8.7 7.8 7.9 7.9 5.4 5.2 5.4 5.1 4.8 5.0 5.2 5.3 5.0 4.7 22% 28% 28% 28% 27% 22% 29% 26% 26% 25% 2013 2014 1Q 2015 2Q 2015 3Q 2015 2013 2014 1Q 2015 2Q 2015 3Q 2015 Equity $B Debt $B Cash & Cash Equivalents $B Debt-to-Capital 20%-30% CAPITAL STRUCTURE 2013 – 3Q 2015 16 Consolidated PSX Excluding PSXP
  • 17. 5.2 4.8 4.1 0.1 1.5 (0.8) (3.3) (2.0) December 2014 Cash Balance* CFO (excluding working capital) Working Capital PSXP Bond & Equity Proceeds Debt Repayment Capital Expenditures & Investments Shareholder Distributions September 2015 Cash Balance* $B CASH FLOW YTD 2015 17 * Includes cash and cash equivalents
  • 18. 18 Global Olefins & Polyolefins utilization Mid-90% Refining crude utilization Mid-90% 2015 full year consolidated capital expenditures $4.3 B Effective income tax rate Mid-30% Corporate & Other costs (after-tax) $110 MM - $120 MM OUTLOOK 4Q 2015 Refining turnaround expenses (pre-tax) ~$150 MM DCP equity contribution $1.5 B
  • 19. PHILLIPS 66 THIRD QUARTER 2015 CONFERENCE CALL Questions and Answers
  • 20. PHILLIPS 66 THIRD QUARTER 2015 CONFERENCE CALL Appendix
  • 21. ESTIMATED SENSITIVITIES 2015 21Sensitivities shown above are independent and are only valid within a limited price range Annual Net Income $MM Midstream - DCP (net to Phillips 66) 10¢/Gal Increase in NGL price 30 $1/MMBtu Increase in Natural Gas price 25 $10/BBL Increase in WTI price 15 Chemicals - CPChem (net to Phillips 66) 1¢/Lb Increase in Chain Margin (Ethylene, Polyethylene, NAO) 35 Worldwide Refining $1/BBL Increase in Gasoline Margin 220 $1/BBL Increase in Distillate Margin 200 $1/BBL Widening LLS / Maya Differential (LLS less Maya) 50 $1/BBL Widening WTI / WCS Differential (WTI less WCS) 40 $1/BBL Widening WTI / WTS Differential (WTI less WTS) 15 $1/BBL Widening LLS / Medium Sour Differential (LLS less Medium Sour) 15 $1/BBL Widening ANS / WCS Differential (ANS less WCS) 10 10¢/MMBtu Increase in Natural Gas price (10) Impacts due to Actual Crude Feedstock Differing from Feedstock Assumed in Market Indicators:
  • 22. 18.32 10.27 (3.96) (1.14) (2.06) (0.89) Market 3:2:1 Configuration Secondary Products Feedstock Other Realized Margin ATLANTIC BASIN / EUROPE $/BBL REFINING MARGINS – MARKET VS. REALIZED 3Q 2015 22 Market 3:2:1 – Dated Brent / Gasoline 83.7 RBOB NYH / Diesel 15ppm NYH Brent: $50.26/BBL 97% Crude Capacity Utilization 56% Market Capture
  • 23. 13.34 10.72 (3.07) (3.26) 2.00 1.71 Market 3:2:1 Configuration Secondary Products Feedstock Other Realized Margin GULF COAST $/BBL REFINING MARGINS – MARKET VS. REALIZED 3Q 2015 23 Market 3:2:1 – LLS / Gasoline 85 CBOB / Diesel 61 8ppm LLS: $50.13/BBL 100% Crude Capacity Utilization 80% Market Capture
  • 24. 22.03 20.97 (2.91) (2.18) 1.10 2.93 Market 3:2:1 Configuration Secondary Products Feedstock Other Realized Margin CENTRAL CORRIDOR $/BBL REFINING MARGINS – MARKET VS. REALIZED 3Q 2015 24 Market 3:2:1 – WTI / Gasoline Unl Sub Octane Group 3 / ULSD Group 3 WTI: $46.37/BBL 91% Crude Capacity Utilization 95% Market Capture
  • 25. 30.69 18.29 (6.30) (3.53) 2.68 (5.25) Market 3:2:1 Configuration Secondary Products Feedstock Other Realized Margin WESTERN / PACIFIC $/BBL REFINING MARGINS – MARKET VS. REALIZED 3Q 2015 25 Market 3:2:1 – ANS Spot / Los Angeles CARBOB / Los Angeles No. 2 CARB ANS: $51.44/BBL 96% Crude Capacity Utilization 60% Market Capture
  • 26. 1,140 1,647 (24) (27) 494 85 (21) 3Q 2014 Adjusted Earnings Midstream Chemicals Refining Marketing & Specialties Corporate & Other 3Q 2015 Adjusted Earnings 3Q 2015 Adjusted Earnings $MM 91 (112)1,052272 344 ADJUSTED EARNINGS 3Q 2015 VS. 3Q 2014 26
  • 27. 115 91 19 6 (49) 3Q 2014 Adjusted Earnings Transportation NGL DCP Midstream 3Q 2015 Adjusted Earnings $MM MIDSTREAM 3Q 2015 VS. 3Q 2014 27 77 32 (18) 3Q 2015 Adjusted Earnings
  • 28. 299 272 2 (29) 0 3Q 2014 Adjusted Earnings Olefins & Polyolefins Specialties, Aromatics & Styrenics Other 3Q 2015 Adjusted Earnings $MM CHEMICALS 3Q 2015 VS. 3Q 2014 28 261 (6)17 3Q 2015 Adjusted Earnings
  • 29. 558 1,052 53 219 44 178 3Q 2014 Adjusted Earnings Atlantic Basin / Europe Gulf Coast Central Corridor Western / Pacific 3Q 2015 Adjusted Earnings $MM REFINING 3Q 2015 VS. 3Q 2014 29 193 372285 202 3Q 2015 Adjusted Earnings
  • 30. 259 344 75 10 3Q 2014 Adjusted Earnings Marketing & Other Specialties 3Q 2015 Adjusted Earnings $MM MARKETING AND SPECIALTIES 3Q 2015 VS. 3Q 2014 30 291 53 3Q 2015 Adjusted Earnings
  • 31. (91) (112) (7) (1) (13) 3Q 2014 Adjusted Net Loss Net Interest Expense Corporate Overhead Other 3Q 2015 Adjusted Net Loss $MM CORPORATE AND OTHER 3Q 2015 VS. 3Q 2014 31
  • 32. 5.1 4.8 0.0 1.5 (1.0) (0.7) (0.1) June 30 Cash Balance* CFO (excluding working capital) Working Capital Capital Expenditures & Investments Shareholder Distributions Other September 30 Cash Balance* $B CASH FLOW 3Q 2015 32 * Includes cash and cash equivalents
  • 33. 33 NON-GAAP RECONCILIATIONS Sep YTD 3Q 2Q Sep YTD 3Q Phillips 66 Net Income (Loss) Attributable to Phillips 66 3,577$ 1,578$ 1,012$ 3,615$ 1,180$ Adjustments: Asset dispositions (265) (18) (132) (109) (109) Pension settlement expense 46 46 - - - Impairments by equity affiliates 148 22 126 69 69 Pending claims and settlements (23) 19 (4) - - Discontinued Operations - - - (706) - Adjusted Net Income (Loss) Attributable to Phillips 66 3,483$ 1,647$ 1,002$ 2,869$ 1,140$ Net Income (Loss) Attributable to Phillips 66 Per Share of Common Stock (dollars) 6.52$ 2.90$ 1.84$ 6.28$ 2.09$ Adjusted Net Income (Loss) Attributable to Phillips 66 Per Share of Common Stock (dollars) 6.34$ 3.02$ 1.83$ 4.98$ 2.02$ Millions of Dollars Except as Indicated 2015 2014
  • 34. 34 NON-GAAP RECONCILIATIONS Sep YTD 3Q 2Q Sep YTD 3Q Midstream Net Income (Loss) Attributable to Phillips 66 90$ 101$ (78)$ 411$ 115$ Adjustments: Pension settlement expense 6 6 - - - Impairments by equity affiliates 128 2 126 - - Asset dispositions (18) (18) - - - Adjusted Net Income (Loss) Attributable to Phillips 66 206$ 91$ 48$ 411$ 115$ Chemicals Net Income (Loss) Attributable to Phillips 66 750$ 252$ 295$ 870$ 230$ Adjustments: Impairments by equity affiliates 20 20 - 69 69 Adjusted Net Income (Loss) Attributable to Phillips 66 770$ 272$ 295$ 939$ 299$ Millions of Dollars Except as Indicated 2015 2014
  • 35. 35 NON-GAAP RECONCILIATIONS Sep YTD 3Q 2Q Sep YTD 3Q Refining Net Income (Loss) Attributable to Phillips 66 2,145$ 1,003$ 604$ 1,254$ 558$ Adjustments: Asset dispositions (5) - - - - Pension settlement expense 30 30 - - - Pending claims and settlements (19) 19 - - - Adjusted Net Income (Loss) Attributable to Phillips 66 2,151$ 1,052$ 604$ 1,254$ 558$ Marketing & Specialties Net Income (Loss) Attributable to Phillips 66 956$ 338$ 314$ 667$ 368$ Adjustments: Asset dispositions (242) - (132) (109) (109) Pension settlement expense 6 6 - - - Adjusted Net Income (Loss) Attributable to Phillips 66 720$ 344$ 182$ 558$ 259$ Corporate and Other Net Income (Loss) Attributable to Phillips 66 (364)$ (116)$ (123)$ (293)$ (91)$ Adjustments: Pension settlement expense 4 4 - - - Pending claims and settlements (4) - (4) - - Adjusted Net Income (Loss) Attributable to Phillips 66 (364)$ (112)$ (127)$ (293)$ (91)$ 2015 2014 Millions of Dollars Except as Indicated
  • 36. 36 NON-GAAP RECONCILIATIONS Sep YTD 3Q 2Q Sep YTD 3Q Midstream - Transportation Net Income (Loss) Attributable to Phillips 66 207$ 77$ 65$ 180$ 58$ Adjustments: Adjusted Net Income (Loss) Attributable to Phillips 66 207$ 77$ 65$ 180$ 58$ Midstream - NGL Net Income (Loss) Attributable to Phillips 66 48$ 26$ 8$ 84$ 26$ Adjustments: Pension settlement expense 6 6 - - - Adjusted Net Income (Loss) Attributable to Phillips 66 54$ 32$ 8$ 84$ 26$ Midstream - DCP Midstream Net Income (Loss) Attributable to Phillips 66 (165)$ (2)$ (151)$ 147$ 31$ Adjustments: Impairments by equity affiliates 128 2 126 - - Asset dispositions (18) (18) - - - Adjusted Net Income (Loss) Attributable to Phillips 66 (55)$ (18)$ (25)$ 147$ 31$ Millions of Dollars Except as Indicated 2015 2014
  • 37. 37 NON-GAAP RECONCILIATIONS Sep YTD 3Q 2Q Sep YTD 3Q Refining - Atlantic Basin / Europe Net Income (Loss) Attributable to Phillips 66 383$ 180$ 90$ 141$ 140$ Adjustments: Pension settlement expense 8 8 - - - Pending claims and settlements (33) 5 - - - Adjusted Net Income (Loss) Attributable to Phillips 66 358$ 193$ 90$ 141$ 140$ Refining - Gulf Coast Net Income (Loss) Attributable to Phillips 66 423$ 269$ 83$ 263$ 66$ Adjustments: Pension settlement expense 10 10 - - - Pending claims and settlements 6 6 - - - Adjusted Net Income (Loss) Attributable to Phillips 66 439$ 285$ 83$ 263$ 66$ Millions of Dollars Except as Indicated 2015 2014
  • 38. 38 NON-GAAP RECONCILIATIONS Sep YTD 3Q 2Q Sep YTD 3Q Refining - Central Corridor Net Income (Loss) Attributable to Phillips 66 771$ 360$ 216$ 785$ 328$ Adjustments: Pension settlement expense 7 7 - - - Pending claims and settlements 5 5 - - - Adjusted Net Income (Loss) Attributable to Phillips 66 783$ 372$ 216$ 785$ 328$ Refining - Western / Pacific Net Income (Loss) Attributable to Phillips 66 568$ 194$ 215$ 65$ 24$ Adjustments: Pension settlement expense 5 5 - - - Pending claims and settlements 3 3 - - - Asset dispositions (5) - - - - Adjusted Net Income (Loss) Attributable to Phillips 66 571$ 202$ 215$ 65$ 24$ Millions of Dollars Except as Indicated 2015 2014
  • 39. 39 NON-GAAP RECONCILIATIONS Sep YTD 3Q 2Q Sep YTD 3Q Marketing & Specialties - Marketing & Other Net Income (Loss) Attributable to Phillips 66 805$ 285$ 266$ 537$ 325$ Adjustments: Asset dispositions (242) - (132) (109) (109) Pension settlement expense 6 6 - - - Adjusted Net Income (Loss) Attributable to Phillips 66 569$ 291$ 134$ 428$ 216$ Marketing & Specialties - Specialties Net Income (Loss) Attributable to Phillips 66 151$ 53$ 48$ 130$ 43$ Adjustments: Adjusted Net Income (Loss) Attributable to Phillips 66 151$ 53$ 48$ 130$ 43$ Millions of Dollars Except as Indicated 20142015
  • 40. 2015 YTD Phillips 66 Midstream Chemicals Refining Marketing & Specialties Numerator ($MM) Net Income 3,614 132 750 2,145 956 After-tax interest expense 153 - - - - GAAP ROCE earnings 3,767 132 750 2,145 956 Special Items (94) 116 20 6 (236) Adjusted ROCE earnings 3,673 248 770 2,151 720 Denominator ($MM) GAAP average capital employed* 31,853 6,104 4,883 13,637 2,933 2015 Annualized Adjusted YTD ROCE 15% 5% 21% 21% 33% 2015 Annualized GAAP YTD ROCE 16% 3% 20% 21% 43% 40* Total equity plus total debt NON-GAAP RECONCILIATIONS
  • 41. 41 NON-GAAP RECONCILIATIONS Phillips 66 Consolidated Phillips 66 Partners Adjusted Phillips 66 Total Debt 8,951$ 1,100$ 7,851$ Total Equity 24,032$ 805$ 23,227$ Debt-to-Capital Ratio 27% 25% Total Cash 4,822$ 73$ 4,749$ Net-Debt-to-Capital Ratio 15% 12% 2015 3Q Millions of Dollars
  • 42. 42 NON-GAAP RECONCILIATIONS Millions of Dollars 2015 3Q Effective Tax Rates Income before taxes 2,359$ Special items 99$ Adjusted income before taxes 2,458$ Provision for taxes 767$ Special items 30$ Adjusted provision for taxes 797$ GAAP effective tax rate 33% Adjusted effective tax rate 32%