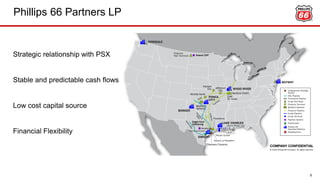
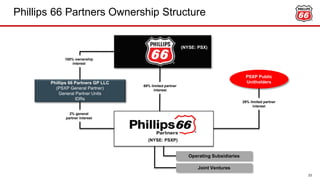
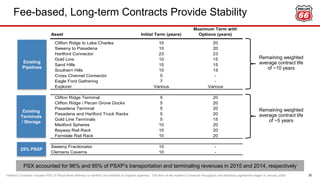
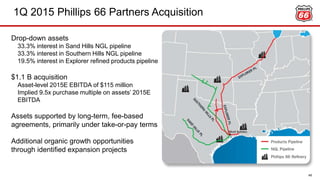
- Phillips 66 Partners LP owns, operates, develops and acquires primarily fee-based crude oil, refined petroleum products and natural gas liquids pipelines and terminals and other midstream assets.
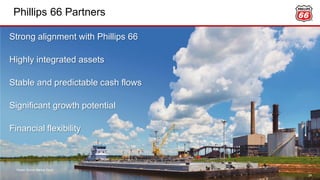
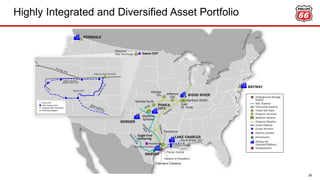
- PSXP has a balanced portfolio of assets with long-term, fee-based contracts providing stable cash flows. Recent acquisitions and organic growth projects will further expand the portfolio.
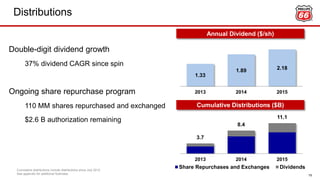
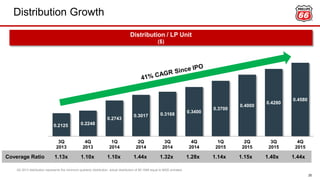
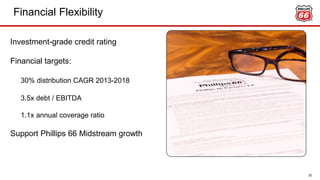
- PSXP is targeting 30% annual distribution growth through 2018 while maintaining investment grade credit ratings and annual distribution coverage of at least 1.1x.