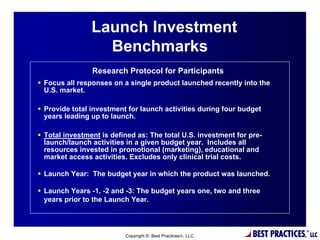
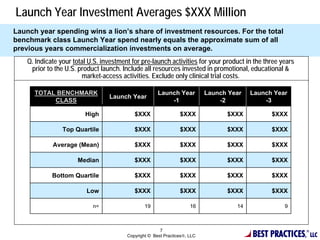
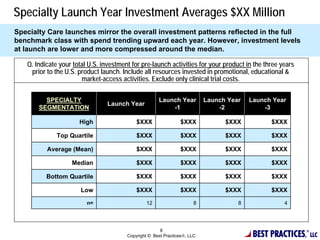
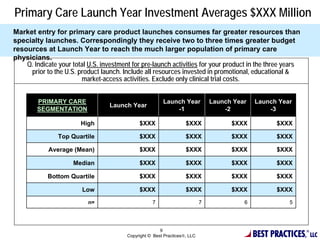
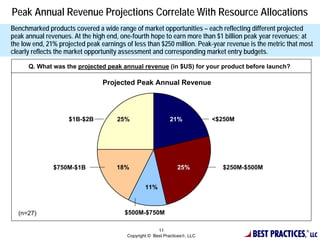
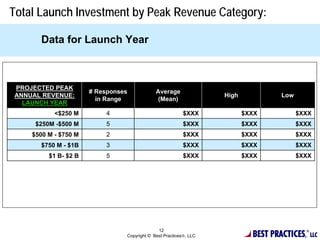
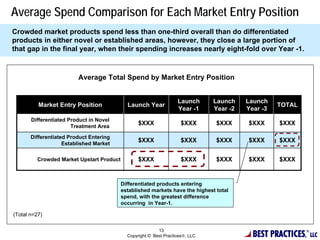
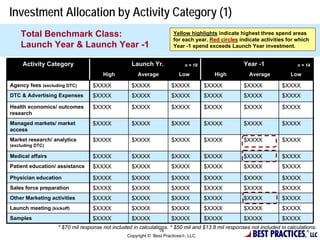
SlideShare a Scribd company logo
1 of 23
Download to read offline
New Product Launch Spend:
What It Takes to Win in the U.S. Market


                Best Practices, LLC
         Strategic Benchmarking Research

                              1

               Copyright © Best Practices, LLC   BEST PRACTICES,   ®
                                                                        LLC
Executive Summary


 Project Objectives & Methodology

 Key Findings & Insights

 Companies Participating in Study

 Participant/ Product Demographic Data


                         2

          Copyright © Best Practices, LLC   BEST PRACTICES,   ®
                                                                   LLC
Project Objectives & Methodology
Best Practices, LLC developed a customized survey tool to capture industry data and
deployed it to a representative sample of 27 brand & marketing leaders at 23 leading
biopharmaceutical companies.


         Study Objective:                                               Contents:
    The objective of this
                                                           Industry average cost for new
    benchmarking study was to
                                                              pharmaceutical product launch
    help biopharma leaders develop
    competitive launch and pre-                            Average cost for specialty and
    launch activity budgets to                                primary product launches
    ensure successful U.S. market                          Percentage of budget allocated
    entry for new products.                                   to 12 key marketing, education and
                                                              market access activities during and
    This data will serve as a
    reference or comparison point                             prior to launch
    for brand and marketing leaders                        Timing for conducting 50+ activities
    as they develop budgets and                            Anticipated budget & activity trends
    allocate funds for their new                           Top 3 success factors
    brands.


                                                                                   BEST PRACTICES,
                                                3                                                    ®
                                 Copyright © Best Practices, LLC                                        LLC
Universe of Learning: Companies Participating in Study
Benchmark participants included 27 executives and managers at 23 leading
biopharmaceutical companies.


                                           Survey Only
                                     Participating Companies


    Abbott, Amylin, Astellas, Bausch & Lomb, Baxter Healthcare, Bayer HealthCare, Bristol-Myers Squibb,
    EMD Serono, Genzyme, GlaxoSmithKline, Inspire, Lundbeck, Merck & Co., Noven, Novo Nordisk, Onyx,
                   ProStrakan, Regeneron, Roche, sanofi-aventis, Shire, Teva, Xanodyne.

                                                                                         BEST PRACTICES,
                                                        4                                                  ®
                                         Copyright © Best Practices, LLC                                      LLC
Participants’ Job Titles & Functional Areas
Directors and Vice Presidents make up more than three-quarters of the benchmark
class. More than half the respondents work within marketing functions or departments.


          Participant Job Titles                                Participant Departments/Functions

              Other (Head, Leader)
                                                               Marketing                                          52%
 Manager/                                   VP/EVP/
                        7%                  SVP
Sr. Manager
                11%            22%
                                                            Commercial             11%

                                                         New Products              7%

                                                               Managed
                                                                                   7%
                                                                Markets
                        60%
                                                                   * Other               19%


                Director/Senior Director/                    * Other= R&D, Medical Affairs, Regulatory Affairs,
                Executive Director                              Product Launch, Market Analytics, Business
                                                                              Development
(n=27)                                                                                                        (n=27)

                                                                                               BEST PRACTICES,
                                                       5                                                                ®
                                        Copyright © Best Practices, LLC                                                    LLC
Launch Investment
                  Benchmarks
                Research Protocol for Participants
 Focus all responses on a single product launched recently into the
  U.S. market.

 Provide total investment for launch activities during four budget
  years leading up to launch.

 Total investment is defined as: The total U.S. investment for pre-
  launch/launch activities in a given budget year. Includes all
  resources invested in promotional (marketing), educational and
  market access activities. Excludes only clinical trial costs.

 Launch Year: The budget year in which the product was launched.

 Launch Years -1, -2 and -3: The budget years one, two and three
  years prior to the Launch Year.


                                         6

                          Copyright © Best Practices, LLC       BEST PRACTICES,   ®
                                                                                       LLC
Launch Year Investment Averages $XXX Million
Launch year spending wins a lion’s share of investment resources. For the total
benchmark class Launch Year spend nearly equals the approximate sum of all
previous years commercialization investments on average.
    Q. Indicate your total U.S. investment for pre-launch activities for your product in the three years
     prior to the U.S. product launch. Include all resources invested in promotional, educational &
                        market-access activities. Exclude only clinical trial costs.

      TOTAL BENCHMARK                                  Launch Year          Launch Year   Launch Year
                                  Launch Year
           CLASS                                           -1                   -2            -3

                         High               $XXX                 $XXX             $XXX          $XXX

                 Top Quartile               $XXX                 $XXX             $XXX          $XXX

             Average (Mean)                 $XXX                 $XXX             $XXX          $XXX

                      Median                $XXX                 $XXX             $XXX          $XXX

             Bottom Quartile                $XXX                 $XXX             $XXX          $XXX

                          Low               $XXX                 $XXX             $XXX          $XXX

                            n=                   19                   16             14             9


                                                                                          BEST PRACTICES,
                                                        7                                                   ®
                                         Copyright © Best Practices, LLC                                       LLC
Specialty Launch Year Investment Averages $XX Million
Specialty Care launches mirror the overall investment patterns reflected in the full
benchmark class with spend trending upward each year. However, investment levels
at launch are lower and more compressed around the median.

   Q. Indicate your total U.S. investment for pre-launch activities for your product in the three years
    prior to the U.S. product launch. Include all resources invested in promotional, educational &
                       market-access activities. Exclude only clinical trial costs.

         SPECIALTY                                    Launch Year          Launch Year   Launch Year
                                 Launch Year
       SEGMENTATION                                       -1                   -2            -3

                      High                  $XXX                $XXX             $XXX          $XXX

              Top Quartile                  $XXX                $XXX             $XXX          $XXX

          Average (Mean)                    $XXX                $XXX             $XXX          $XXX

                   Median                   $XXX                $XXX             $XXX          $XXX

          Bottom Quartile                   $XXX                $XXX             $XXX          $XXX

                       Low                  $XXX                $XXX             $XXX          $XXX

                         n=                      12                    8             8             4


                                                                                          BEST PRACTICES,
                                                       8                                                    ®
                                        Copyright © Best Practices, LLC                                        LLC
Primary Care Launch Year Investment Averages $XXX Million
Market entry for primary care product launches consumes far greater resources than
specialty launches. Correspondingly they receive two to three times greater budget
resources at Launch Year to reach the much larger population of primary care
physicians.
    Q. Indicate your total U.S. investment for pre-launch activities for your product in the three years
     prior to the U.S. product launch. Include all resources invested in promotional, educational &
                        market-access activities. Exclude only clinical trial costs.


        PRIMARY CARE                                     Launch Year            Launch Year   Launch Year
                                  Launch Year
        SEGMENTATION                                         -1                     -2            -3

                        High                  $XXX                  $XXX              $XXX          $XXX

                Top Quartile                  $XXX                  $XXX              $XXX          $XXX

            Average (Mean)                    $XXX                  $XXX              $XXX          $XXX

                     Median                   $XXX                  $XXX              $XXX          $XXX

            Bottom Quartile                   $XXX                  $XXX              $XXX          $XXX

                        Low                   $XXX                  $XXX              $XXX          $XXX
                           n=                       7                       7             6             5


                                                                                              BEST PRACTICES,
                                                        9                                                       ®
                                         Copyright © Best Practices, LLC                                           LLC
Investment Data by
       Product Segment
Data is segmented by:
 Projected Peak Annual Revenue
 Therapeutic Areas – Oncology & Endocrine/Metabolic
 Product Market Entry Position


                              10

                Copyright © Best Practices, LLC   BEST PRACTICES,   ®
                                                                         LLC
Peak Annual Revenue Projections Correlate With Resource Allocations
Benchmarked products covered a wide range of market opportunities – each reflecting different projected
peak annual revenues. At the high end, one-fourth hope to earn more than $1 billion peak year revenues; at
the low end, 21% projected peak earnings of less than $250 million. Peak-year revenue is the metric that most
clearly reflects the market opportunity assessment and corresponding market entry budgets.

      Q. What was the projected peak annual revenue (in $US) for your product before launch?

                                 Projected Peak Annual Revenue


                    $1B-$2B           25%                   21%             <$250M


               $750M-$1B              18%                       25%           $250M-$500M


                                                 11%


  (n=27)                                 $500M-$750M


                                                                                       BEST PRACTICES,
                                                       11                                                 ®
                                         Copyright © Best Practices, LLC                                     LLC
Total Launch Investment by Peak Revenue Category:

      Data for Launch Year


PROJECTED PEAK
                      # Responses            Average
ANNUAL REVENUE:                                                    High             Low
                        in Range              (Mean)
  LAUNCH YEAR
           <$250 M         4                              $XXX            $XXX            $XXX
     $250M -$500 M         5                              $XXX            $XXX            $XXX
    $500 M - $750 M        2                              $XXX            $XXX            $XXX
      $750 M - $1B         3                              $XXX            $XXX            $XXX
         $1 B- $2 B        5                              $XXX            $XXX            $XXX


                                                                            BEST PRACTICES,
                                              12                                              ®
                                Copyright © Best Practices, LLC                                  LLC
Average Spend Comparison for Each Market Entry Position
Crowded market products spend less than one-third overall than do differentiated
products in either novel or established areas, however, they close a large portion of
that gap in the final year, when their spending increases nearly eight-fold over Year -1.


                         Average Total Spend by Market Entry Position


                                                                   Launch      Launch    Launch
          Market Entry Position             Launch Year                                            TOTAL
                                                                   Year -1     Year -2   Year -3
       Differentiated Product in Novel
                       Treatment Area
                                                 $XXX                $XXX      $XXX      $XXX      $XXX

       Differentiated Product Entering
                    Established Market
                                                 $XXX                $XXX      $XXX      $XXX      $XXX


         Crowded Market Upstart Product          $XXX                $XXX      $XXX      $XXX      $XXX


                                          Differentiated products entering
                                          established markets have the highest total
                                          spend, with the greatest difference
                                          occurring in Year-1.

(Total n=27)


                                                                                           BEST PRACTICES,
                                                          13                                                 ®
                                            Copyright © Best Practices, LLC                                     LLC
Launch Activities
Benchmark partners were asked to indicate which launch activities
they fund within each of the following categories during the last
four budget years leading up to launch.

 Agency Fees (excluding DTC)
 Direct to Consumer & Advertising Expenses
 Health Economics/ Outcomes Research
 Launch Meeting/ Kickoff
 Managed Markets/Market Access
 Market Research/Analytics (excluding DTC)
 Medical Affairs
 Patient Education/ Assistance
 Physician Education
 Sales Force Preparation
 Other

                                      14

                        Copyright © Best Practices, LLC    BEST PRACTICES,   ®
                                                                                  LLC
Activities Included in Agency Fees Spend
Key activities funded by participants within the Agency Fees budget category were
promotion/advertising and communications/publications. Promotion was the activity
funded by the most companies in the Launch Year, Year -1 and Year -2. In the Year -3,
the greatest number of companies funded communications/publications activities.
Q. Please check all of the listed activities that were included in your product's Year -3, Year -2, Year -1
                                         and Launch Year budgets.

                                 AGENCY FEES (excluding DTC)
                    Pre-Launch                                                 Launch
          Year -3      Year -2    Year -1
                                                      Promotional/
            33%         80%         92%                                                               100%
                                                      Advertising

                                                Communications/
            83%         60%         85%                                                        76%
                                                  Publications


            67%         40%         54%           Public Relations                             76%


            17%         40%         38%                    Retainers                41%
                                                                                                 =most frequent
                                                                                                 activity per year
            0%          10%         0%            Other (specify):         0%
                                                                                   Other (Year -2):
         n=6         n = 10      n = 13                  n = 17                    • Positioning, campaign development

                                                                                               BEST PRACTICES,
                                                          15                                                         ®
                                            Copyright © Best Practices, LLC                                             LLC
Activities Expected to Gain Funding in Near Future
Health Outcomes and Health Economics Research are expected to grow significantly in
importance in the next three years, with 97% projecting spending increases there. A
majority of participants also expect increases for managed markets, medical affairs and
patient education spend.
  Q. In your opinion, how will recent and anticipated market changes impact funding levels for
               the following types of launch activities over the next 24-36 months?
                                                                                                            Total
                                                Significant increase              Some increase
                                                                                                          Increase
          Health economics/outcomes research                40%                         56%                 96%

              Managed markets/market access               24%                     60%                       84%

                              Medical affairs 8%                            72%                             80%

                 Patient education/ assistance 8%                     52%                                   60%

                         Physician education                36%                                             36%

                                        DTC 8%                  28%                                         36%

                                    Samples 4%              28%                                             32%

                      Sales force preparation 4%            28%                                             32%

   Market research/analytics (excluding DTC) 8%             24%                                             32%

                     Launch meeting (kickoff)       16%                                                     16%

                 Agency fees (excluding DTC)      12%                                                       12%
 (n=29)                                                     % Responses

                                                                                                  BEST PRACTICES,
                                                          16                                                        ®
                                            Copyright © Best Practices, LLC                                            LLC
Launch Investment Allocation
 Participants indicated their total U.S. investment for pre-
  launch activities for their respective product in four
  different budget years: Launch Year, Year -1, Year -2, and
  Year -3.
 Budget numbers provided include all resources invested in
  promotional, educational & market-access activities,
  excluding only clinical trial costs.
 Slides in this section exhibit average, high and low spend
  allocated for activities in 12 categories for the Launch Year
  and the three years preceding launch.
 Data is provided for the full benchmark class. In addition,
  data is provided for the following benchmark class
  segments: Primary care products, specialty products and
  Oncology products.


                                  17

                    Copyright © Best Practices, LLC       BEST PRACTICES,   ®
                                                                                 LLC
Investment Allocation by Activity Category (1)
    Total Benchmark Class:                                          Yellow highlights indicate highest three spend areas
                                                                    for each year. Red circles indicate activities for which
    Launch Year & Launch Year -1                                    Year -1 spend exceeds Launch Year investment.


     Activity Category                            Launch Yr.             n = 18                    Year -1                n = 14

                                      High           Average           Low            High           Average           Low

Agency fees (excluding DTC)       $XXXX           $XXXX            $XXXX          $XXXX            $XXXX           $XXXX
DTC & Advertising Expenses        $XXXX           $XXXX            $XXXX          $XXXX            $XXXX           $XXXX
Health economics/ outcomes        $XXXX           $XXXX            $XXXX          $XXXX            $XXXX           $XXXX
research
Managed markets/ market           $XXXX           $XXXX            $XXXX          $XXXX            $XXXX           $XXXX
access
Market research/ analytics        $XXXX           $XXXX            $XXXX          $XXXX            $XXXX           $XXXX
(excluding DTC)

Medical affairs                   $XXXX           $XXXX            $XXXX          $XXXX            $XXXX           $XXXX
Patient education/ assistance     $XXXX           $XXXX            $XXXX          $XXXX            $XXXX           $XXXX
Physician education               $XXXX           $XXXX            $XXXX          $XXXX            $XXXX           $XXXX
Sales force preparation           $XXXX           $XXXX            $XXXX          $XXXX            $XXXX           $XXXX
Other Marketing activities        $XXXX           $XXXX            $XXXX          $XXXX            $XXXX           $XXXX
Launch meeting (kickoff)          $XXXX           $XXXX            $XXXX          $XXXX            $XXXX           $XXXX
Samples                           $XXXX           $XXXX            $XXXX          $XXXX            $XXXX           $XXXX
                   * $70 mil response not included in calculations. * $50 mil and $13.8 mil responses not included in calculations.
                                                                                                       BEST PRACTICES
                                                               18                                                              ®
                                                Copyright © Best Practices, LLC                                              , LLC
Success Factors


                 19

   Copyright © Best Practices, LLC   BEST PRACTICES,   ®
                                                            LLC
Top Areas to Consider in Setting Launch Budgets
Survey participants identified Managed Care access and reimbursement, physician
awareness, KOL relationships, and solid market research as the most important areas to
consider in establishing successful new product launch budgets.
   Q. What are the three most important success factors to consider in establishing and allocating
                          new product launch budgets in today’s market?
                Success Factor Categories                                                   Verbatim Responses:
      Managed Care Access/ Reimbursement                       50%     “Good definition of the key influencers & decision makers.”
       Physician/KOL Awareness/ Education                    38%       “Getting medical information/education to physicians without
                                                                       use of sales reps.”
      Market Research/Market Analytics Data                  38%
                                                                       “Competitive differentiation for HE/OR benefit.”
          Data - Clinical, Health Economics/             33%
      Outcomes, Comparative Effectiveness                              “Use new/digital vehicles with field force, physician, payer,
               Patient Education/Awareness            25%              patient.”

                                                    21%                “Investment in physician education (CME & Promotional).”
                     Product Differentiation
                                                                       “Expertise/presence in market today vs. being new entrant.”
                          Physician Access          21%
                                                                       “Ensure managed marketing is adequately funded.”
                   Sales Force Preparation         17%
                                                                       “Differentiating the brand via strategic marketing.”
                         Launch Trajectory        13%
                                                                       “Using alternative marketing sources/direct to physician.”
                         Favorable Co-pay         13%                  “Creativity and collaboration from the team.”
  (n=25)               Sufficient Investment      13%                  “Focus on fundamentals.”
                                               % Responses             “Touch - the number of thought leaders that touch the drug
Other: Experience in new market, patient assistance,                   either in preclinical or clinical settings pre-launch.”
understanding competition, understanding how product
will be paid for, team collaboration, advocacy.                        “Research/phase III.”

                                                                                                              BEST PRACTICES,
                                                                    20                                                                 ®
                                                      Copyright © Best Practices, LLC                                                     LLC
Most Important
Future Activities


                 21

   Copyright © Best Practices, LLC   BEST PRACTICES,   ®
                                                            LLC
Activities for Successful Future Specialty Product Launch
Nearly half the participants expect managed care access and reimbursement activities to
be among the Top 3 most important product launch activities over the next few years.
Also key to launch success will be physician education, health outcomes research, sales
force prep and market data & analytics.
    Q. Within the next 24-36 months, what launch activities (traditional or emerging) do you think will
       be the Top Three most important to achieving a successful launch for a specialty product?
                  Top Activity Categories                                                         Verbatim Responses:
 Managed Care Access/Reimbursement                                   44%     “Targeted research activities that alter the standard of care
              Market Data & Analytics                                        in settings where the drug is or will be used most frequently.”
                                                              28%
 (e.g., segmenting, forecasting, pricing)
                                                                             “Elucidating clinically significant differentiation vs. standard
               Sales Force Preparation                      28%
                                                                             of care.”
                                                              28%
                   Physician Education                                       “Use of novel channels to more frequently reach and
                                                              28%            connect with end users (Internet).”
Health Outcomes/Economics Research
                                                     16%                     “Clear patient (and payer) value proposition.”
     New Channels (e.g., social media)
                                                     16%                     “Consumer marketing via internet and social media.”
     Product Differentiation/Positioning
                                                   12%                       “Non-personal education and promotion to physicians.”
                     KOL Relationships
                                                                             “Reimbursement support/Pharmacoeconomics.”
                      Value Proposition            12%
                                                                             “Outcomes Research and Studies - Comparative Outcomes.
                      Patient Education            12%
                                                   12%                       “Claims data analysis.”
 (n=25)               Physician Access
                                                % Responses                  “Interactive educational tools.”
                                                                             “Evidence based guidelines for product use.”
Other: CI, reimbursement landscape research & prep, test promotional
campaign, interactive educational tools, post-marketing outcomes data,       “Clinical outcomes data/post marketing.”
attend ad boards, use evidence-based guidelines, strong value proposition

                                                                                                                     BEST PRACTICES,
                                                                         22                                                                     ®
                                                           Copyright © Best Practices, LLC                                                         LLC
About Best Practices, LLC

Best Practices, LLC is a research and consulting firm that conducts
work based on the simple yet profound principle that organizations
can chart a course to superior economic performance by studying
the best business practices, operating tactics and winning
                strategies of world-class companies.


                   Best Practices, LLC
      6350 Quadrangle Drive, Suite 200, Chapel Hill, NC 27517
                          919-403-0251
                bestpractices@best-in-class.com
                     www.best-in-class.com


                                     23

                       Copyright © Best Practices, LLC     BEST PRACTICES,   ®
                                                                                  LLC

More Related Content

What's hot

Tetley Masala Premium Marketing Plan
Tetley Masala Premium Marketing PlanTetley Masala Premium Marketing Plan
Tetley Masala Premium Marketing PlanLuis Alberto Farray
 
Nestle presentation of management
Nestle presentation of management Nestle presentation of management
Nestle presentation of management Sarwat Shabbir
 
Tea marketing plan
Tea marketing planTea marketing plan
Tea marketing planAli Hadi
 
Wine Marketing Plan for BROLIO
Wine Marketing Plan for BROLIOWine Marketing Plan for BROLIO
Wine Marketing Plan for BROLIOAnne Marie Payne
 
Report on launching of new product
Report on launching of new productReport on launching of new product
Report on launching of new productFaiza Javaid
 
Freight trucking business plan example
Freight trucking business plan exampleFreight trucking business plan example
Freight trucking business plan exampleupmetrics.co
 
MO group assignment
MO group assignmentMO group assignment
MO group assignmentdarshananibm
 
Distributionstrategy of pepsico
Distributionstrategy of pepsicoDistributionstrategy of pepsico
Distributionstrategy of pepsicoAkash Rana
 
Brand positioning
Brand positioningBrand positioning
Brand positioninggyaanmasti
 
Presentation nestle pure life usa & pakistan
Presentation nestle pure life usa & pakistanPresentation nestle pure life usa & pakistan
Presentation nestle pure life usa & pakistanWaqas Mumtaz
 
Uk's standard chartered bank
Uk's standard chartered bankUk's standard chartered bank
Uk's standard chartered bankSHREYANSH VATS
 
Unit 9 entrepreneurship and small business management esbm assignment
Unit 9 entrepreneurship and small business management esbm assignmentUnit 9 entrepreneurship and small business management esbm assignment
Unit 9 entrepreneurship and small business management esbm assignmentTop-notch Research & Consultncy
 
Flowers business plan
Flowers business planFlowers business plan
Flowers business planjalajchahal
 
STP & MARKETING MIX OF PEANUT PIK BISCUITS
STP & MARKETING MIX OF PEANUT PIK BISCUITSSTP & MARKETING MIX OF PEANUT PIK BISCUITS
STP & MARKETING MIX OF PEANUT PIK BISCUITSIrfan Tanwari
 
Business plan
Business planBusiness plan
Business planStudent
 

What's hot (20)

Tetley Masala Premium Marketing Plan
Tetley Masala Premium Marketing PlanTetley Masala Premium Marketing Plan
Tetley Masala Premium Marketing Plan
 
Ceylon tea industry
Ceylon tea industryCeylon tea industry
Ceylon tea industry
 
DEFENSE REPORT
DEFENSE REPORTDEFENSE REPORT
DEFENSE REPORT
 
Nestle presentation of management
Nestle presentation of management Nestle presentation of management
Nestle presentation of management
 
Tea marketing plan
Tea marketing planTea marketing plan
Tea marketing plan
 
Wine Marketing Plan for BROLIO
Wine Marketing Plan for BROLIOWine Marketing Plan for BROLIO
Wine Marketing Plan for BROLIO
 
Branding bangladesh
Branding bangladeshBranding bangladesh
Branding bangladesh
 
Report on launching of new product
Report on launching of new productReport on launching of new product
Report on launching of new product
 
Production system
Production systemProduction system
Production system
 
Freight trucking business plan example
Freight trucking business plan exampleFreight trucking business plan example
Freight trucking business plan example
 
business plan (smoothy juice)
business plan (smoothy juice)business plan (smoothy juice)
business plan (smoothy juice)
 
MO group assignment
MO group assignmentMO group assignment
MO group assignment
 
Distributionstrategy of pepsico
Distributionstrategy of pepsicoDistributionstrategy of pepsico
Distributionstrategy of pepsico
 
Brand positioning
Brand positioningBrand positioning
Brand positioning
 
Presentation nestle pure life usa & pakistan
Presentation nestle pure life usa & pakistanPresentation nestle pure life usa & pakistan
Presentation nestle pure life usa & pakistan
 
Uk's standard chartered bank
Uk's standard chartered bankUk's standard chartered bank
Uk's standard chartered bank
 
Unit 9 entrepreneurship and small business management esbm assignment
Unit 9 entrepreneurship and small business management esbm assignmentUnit 9 entrepreneurship and small business management esbm assignment
Unit 9 entrepreneurship and small business management esbm assignment
 
Flowers business plan
Flowers business planFlowers business plan
Flowers business plan
 
STP & MARKETING MIX OF PEANUT PIK BISCUITS
STP & MARKETING MIX OF PEANUT PIK BISCUITSSTP & MARKETING MIX OF PEANUT PIK BISCUITS
STP & MARKETING MIX OF PEANUT PIK BISCUITS
 
Business plan
Business planBusiness plan
Business plan
 

Viewers also liked

How to effectively launch a new product
How to effectively launch a new productHow to effectively launch a new product
How to effectively launch a new productGovinda Biswas
 
New Product Launch - PepsiCo
New Product Launch - PepsiCoNew Product Launch - PepsiCo
New Product Launch - PepsiConidhiraj
 
Launch a New Product that Doesn't Hurt Your Existing Brand by Andrew Homeyer ...
Launch a New Product that Doesn't Hurt Your Existing Brand by Andrew Homeyer ...Launch a New Product that Doesn't Hurt Your Existing Brand by Andrew Homeyer ...
Launch a New Product that Doesn't Hurt Your Existing Brand by Andrew Homeyer ...Lean Startup Co.
 
Xerox Case Study - Gamification in training and development - Manu Melwin Joy
Xerox Case Study - Gamification in training and development  - Manu Melwin JoyXerox Case Study - Gamification in training and development  - Manu Melwin Joy
Xerox Case Study - Gamification in training and development - Manu Melwin Joymanumelwin
 
Bread and Beyond Marketing Report
Bread and Beyond Marketing ReportBread and Beyond Marketing Report
Bread and Beyond Marketing ReportJunaid Ashraf
 
New Product Development Report
New Product Development ReportNew Product Development Report
New Product Development ReportMohammad Choudhary
 
Case Study On Aditya Birla Group
Case Study On Aditya Birla GroupCase Study On Aditya Birla Group
Case Study On Aditya Birla Groupindira 7
 
Ultimate Case Study Solving Template
Ultimate Case Study Solving TemplateUltimate Case Study Solving Template
Ultimate Case Study Solving TemplateSayem Faruk
 
Titan Watches Case Study Presentation
Titan Watches Case Study PresentationTitan Watches Case Study Presentation
Titan Watches Case Study PresentationCotecna Inspection
 
Dabur India Ltd - A Case Study
Dabur India Ltd  - A Case StudyDabur India Ltd  - A Case Study
Dabur India Ltd - A Case StudyAjay Dhamija
 
Cadbury - New Product Launch
Cadbury - New Product LaunchCadbury - New Product Launch
Cadbury - New Product LaunchSruthi Nair
 
Pharmaceutical marketing plan case study
Pharmaceutical marketing plan case studyPharmaceutical marketing plan case study
Pharmaceutical marketing plan case studyMohamed Magdy
 
Corporate Strategy - Case Study - Google
Corporate Strategy - Case Study - GoogleCorporate Strategy - Case Study - Google
Corporate Strategy - Case Study - GoogleV. Castel
 
Marketing Report: Segmentation, Targeting, Positioning and Product Mix of Cad...
Marketing Report: Segmentation, Targeting, Positioning and Product Mix of Cad...Marketing Report: Segmentation, Targeting, Positioning and Product Mix of Cad...
Marketing Report: Segmentation, Targeting, Positioning and Product Mix of Cad...Hypup Media
 
Marketing plan of nestle
Marketing plan of nestleMarketing plan of nestle
Marketing plan of nestleabdullah khan
 
Heineken Case Study business Analysis
Heineken Case Study business AnalysisHeineken Case Study business Analysis
Heineken Case Study business Analysisjin88lin
 
Southwest Airlines : Case Study
Southwest Airlines : Case StudySouthwest Airlines : Case Study
Southwest Airlines : Case StudySarang Bhutada
 
New launching strategy of pharmaceutical brand
New launching strategy of pharmaceutical brandNew launching strategy of pharmaceutical brand
New launching strategy of pharmaceutical brandMohammad Masum Chowdhury
 

Viewers also liked (20)

How to effectively launch a new product
How to effectively launch a new productHow to effectively launch a new product
How to effectively launch a new product
 
New Product Launch - PepsiCo
New Product Launch - PepsiCoNew Product Launch - PepsiCo
New Product Launch - PepsiCo
 
Launch a New Product that Doesn't Hurt Your Existing Brand by Andrew Homeyer ...
Launch a New Product that Doesn't Hurt Your Existing Brand by Andrew Homeyer ...Launch a New Product that Doesn't Hurt Your Existing Brand by Andrew Homeyer ...
Launch a New Product that Doesn't Hurt Your Existing Brand by Andrew Homeyer ...
 
Xerox Case Study - Gamification in training and development - Manu Melwin Joy
Xerox Case Study - Gamification in training and development  - Manu Melwin JoyXerox Case Study - Gamification in training and development  - Manu Melwin Joy
Xerox Case Study - Gamification in training and development - Manu Melwin Joy
 
Bread and Beyond Marketing Report
Bread and Beyond Marketing ReportBread and Beyond Marketing Report
Bread and Beyond Marketing Report
 
New Product Development Report
New Product Development ReportNew Product Development Report
New Product Development Report
 
Case Study On Aditya Birla Group
Case Study On Aditya Birla GroupCase Study On Aditya Birla Group
Case Study On Aditya Birla Group
 
Ultimate Case Study Solving Template
Ultimate Case Study Solving TemplateUltimate Case Study Solving Template
Ultimate Case Study Solving Template
 
Titan Watches Case Study Presentation
Titan Watches Case Study PresentationTitan Watches Case Study Presentation
Titan Watches Case Study Presentation
 
Dabur India Ltd - A Case Study
Dabur India Ltd  - A Case StudyDabur India Ltd  - A Case Study
Dabur India Ltd - A Case Study
 
nestle cerelac marketing plan
nestle cerelac marketing plannestle cerelac marketing plan
nestle cerelac marketing plan
 
Nivea Case Study
Nivea Case StudyNivea Case Study
Nivea Case Study
 
Cadbury - New Product Launch
Cadbury - New Product LaunchCadbury - New Product Launch
Cadbury - New Product Launch
 
Pharmaceutical marketing plan case study
Pharmaceutical marketing plan case studyPharmaceutical marketing plan case study
Pharmaceutical marketing plan case study
 
Corporate Strategy - Case Study - Google
Corporate Strategy - Case Study - GoogleCorporate Strategy - Case Study - Google
Corporate Strategy - Case Study - Google
 
Marketing Report: Segmentation, Targeting, Positioning and Product Mix of Cad...
Marketing Report: Segmentation, Targeting, Positioning and Product Mix of Cad...Marketing Report: Segmentation, Targeting, Positioning and Product Mix of Cad...
Marketing Report: Segmentation, Targeting, Positioning and Product Mix of Cad...
 
Marketing plan of nestle
Marketing plan of nestleMarketing plan of nestle
Marketing plan of nestle
 
Heineken Case Study business Analysis
Heineken Case Study business AnalysisHeineken Case Study business Analysis
Heineken Case Study business Analysis
 
Southwest Airlines : Case Study
Southwest Airlines : Case StudySouthwest Airlines : Case Study
Southwest Airlines : Case Study
 
New launching strategy of pharmaceutical brand
New launching strategy of pharmaceutical brandNew launching strategy of pharmaceutical brand
New launching strategy of pharmaceutical brand
 

Similar to New Product Launch Spend Report Summary

Warranty Management Excellence Measuring Performance through Product Return D...
Warranty Management Excellence Measuring Performance through Product Return D...Warranty Management Excellence Measuring Performance through Product Return D...
Warranty Management Excellence Measuring Performance through Product Return D...Best Practices
 
Lifecycle Management excellence
Lifecycle Management excellenceLifecycle Management excellence
Lifecycle Management excellenceBest Practices
 
Psm 280 A Best Practices In Advancing Customer Marketing Innovations
Psm 280 A Best Practices In Advancing Customer Marketing  InnovationsPsm 280 A Best Practices In Advancing Customer Marketing  Innovations
Psm 280 A Best Practices In Advancing Customer Marketing InnovationsCameron Tew
 
Best Practices in Advancing Customer Marketing- Innovations Report Summary
Best Practices in Advancing Customer Marketing- Innovations Report SummaryBest Practices in Advancing Customer Marketing- Innovations Report Summary
Best Practices in Advancing Customer Marketing- Innovations Report SummaryMarty Daniel with ThunderActive
 
Driving Growth & Talent Retention through Pay for Performance
Driving Growth & Talent Retention through Pay for PerformanceDriving Growth & Talent Retention through Pay for Performance
Driving Growth & Talent Retention through Pay for PerformanceBest Practices
 
Resource Benchmarks for U.S. Pharmaceutical Managed Care Operations
Resource Benchmarks for U.S. Pharmaceutical Managed Care OperationsResource Benchmarks for U.S. Pharmaceutical Managed Care Operations
Resource Benchmarks for U.S. Pharmaceutical Managed Care OperationsBest Practices, LLC
 
Resource Benchmarks for US Pharma Managed Care Operations Report Summary
Resource Benchmarks for US Pharma Managed Care Operations Report SummaryResource Benchmarks for US Pharma Managed Care Operations Report Summary
Resource Benchmarks for US Pharma Managed Care Operations Report SummaryBest Practices, LLC
 
US Managed Care Staffing &amp; Resourcing Report Summary
US Managed Care Staffing &amp; Resourcing Report SummaryUS Managed Care Staffing &amp; Resourcing Report Summary
US Managed Care Staffing &amp; Resourcing Report SummaryBest Practices
 
Pharma New Product Planning- Medical Affairs Report Summary
Pharma New Product Planning- Medical Affairs Report SummaryPharma New Product Planning- Medical Affairs Report Summary
Pharma New Product Planning- Medical Affairs Report SummaryMarty Daniel with ThunderActive
 
New Product Launch Spend Report Summary
New Product Launch Spend Report SummaryNew Product Launch Spend Report Summary
New Product Launch Spend Report SummaryBest Practices, LLC
 
New Product Launch Spend Report Summary
New Product Launch Spend Report SummaryNew Product Launch Spend Report Summary
New Product Launch Spend Report SummaryBest Practices, LLC
 
Professional and Trade Relations Excellence Report Summary
Professional and Trade Relations Excellence Report SummaryProfessional and Trade Relations Excellence Report Summary
Professional and Trade Relations Excellence Report SummaryBest Practices
 
Professional and Trade Relations Excellence Report Summary
Professional and Trade Relations Excellence Report SummaryProfessional and Trade Relations Excellence Report Summary
Professional and Trade Relations Excellence Report SummaryMarty Daniel with ThunderActive
 
Research and Consulting Offerings
Research and Consulting OfferingsResearch and Consulting Offerings
Research and Consulting OfferingsBest Practices
 
Deploying the iPad to Sales & Managed Markets Teams: Training and Effectivene...
Deploying the iPad to Sales & Managed Markets Teams: Training and Effectivene...Deploying the iPad to Sales & Managed Markets Teams: Training and Effectivene...
Deploying the iPad to Sales & Managed Markets Teams: Training and Effectivene...Best Practices
 
Expanding a Product Portfolio Without Cannibalizing an Established Brand Repo...
Expanding a Product Portfolio Without Cannibalizing an Established Brand Repo...Expanding a Product Portfolio Without Cannibalizing an Established Brand Repo...
Expanding a Product Portfolio Without Cannibalizing an Established Brand Repo...Best Practices
 
Business policy & strategic management
Business policy & strategic managementBusiness policy & strategic management
Business policy & strategic managementShashankdiv
 

Similar to New Product Launch Spend Report Summary (20)

Warranty Management Excellence Measuring Performance through Product Return D...
Warranty Management Excellence Measuring Performance through Product Return D...Warranty Management Excellence Measuring Performance through Product Return D...
Warranty Management Excellence Measuring Performance through Product Return D...
 
Lifecycle Management excellence
Lifecycle Management excellenceLifecycle Management excellence
Lifecycle Management excellence
 
Psm 280 A Best Practices In Advancing Customer Marketing Innovations
Psm 280 A Best Practices In Advancing Customer Marketing  InnovationsPsm 280 A Best Practices In Advancing Customer Marketing  Innovations
Psm 280 A Best Practices In Advancing Customer Marketing Innovations
 
Best Practices in Advancing Customer Marketing- Innovations Report Summary
Best Practices in Advancing Customer Marketing- Innovations Report SummaryBest Practices in Advancing Customer Marketing- Innovations Report Summary
Best Practices in Advancing Customer Marketing- Innovations Report Summary
 
Driving Growth & Talent Retention through Pay for Performance
Driving Growth & Talent Retention through Pay for PerformanceDriving Growth & Talent Retention through Pay for Performance
Driving Growth & Talent Retention through Pay for Performance
 
Resource Benchmarks for U.S. Pharmaceutical Managed Care Operations
Resource Benchmarks for U.S. Pharmaceutical Managed Care OperationsResource Benchmarks for U.S. Pharmaceutical Managed Care Operations
Resource Benchmarks for U.S. Pharmaceutical Managed Care Operations
 
Resource Benchmarks for US Pharma Managed Care Operations Report Summary
Resource Benchmarks for US Pharma Managed Care Operations Report SummaryResource Benchmarks for US Pharma Managed Care Operations Report Summary
Resource Benchmarks for US Pharma Managed Care Operations Report Summary
 
US Managed Care Staffing &amp; Resourcing Report Summary
US Managed Care Staffing &amp; Resourcing Report SummaryUS Managed Care Staffing &amp; Resourcing Report Summary
US Managed Care Staffing &amp; Resourcing Report Summary
 
Pharma New Product Planning- Medical Affairs Report Summary
Pharma New Product Planning- Medical Affairs Report SummaryPharma New Product Planning- Medical Affairs Report Summary
Pharma New Product Planning- Medical Affairs Report Summary
 
New Product Launch Spend Report Summary
New Product Launch Spend Report SummaryNew Product Launch Spend Report Summary
New Product Launch Spend Report Summary
 
New Product Launch Spend Report Summary
New Product Launch Spend Report SummaryNew Product Launch Spend Report Summary
New Product Launch Spend Report Summary
 
Professional and Trade Relations Excellence Report Summary
Professional and Trade Relations Excellence Report SummaryProfessional and Trade Relations Excellence Report Summary
Professional and Trade Relations Excellence Report Summary
 
Professional and Trade Relations Excellence Report Summary
Professional and Trade Relations Excellence Report SummaryProfessional and Trade Relations Excellence Report Summary
Professional and Trade Relations Excellence Report Summary
 
E Sampling Summary
E Sampling SummaryE Sampling Summary
E Sampling Summary
 
E-Sampling Report Summary
E-Sampling Report SummaryE-Sampling Report Summary
E-Sampling Report Summary
 
Strategic
StrategicStrategic
Strategic
 
Research and Consulting Offerings
Research and Consulting OfferingsResearch and Consulting Offerings
Research and Consulting Offerings
 
Deploying the iPad to Sales & Managed Markets Teams: Training and Effectivene...
Deploying the iPad to Sales & Managed Markets Teams: Training and Effectivene...Deploying the iPad to Sales & Managed Markets Teams: Training and Effectivene...
Deploying the iPad to Sales & Managed Markets Teams: Training and Effectivene...
 
Expanding a Product Portfolio Without Cannibalizing an Established Brand Repo...
Expanding a Product Portfolio Without Cannibalizing an Established Brand Repo...Expanding a Product Portfolio Without Cannibalizing an Established Brand Repo...
Expanding a Product Portfolio Without Cannibalizing an Established Brand Repo...
 
Business policy & strategic management
Business policy & strategic managementBusiness policy & strategic management
Business policy & strategic management
 

More from Marty Daniel with ThunderActive

Educating the Market: Creating Value Through Support of Continuing Medical Ed...
Educating the Market: Creating Value Through Support of Continuing Medical Ed...Educating the Market: Creating Value Through Support of Continuing Medical Ed...
Educating the Market: Creating Value Through Support of Continuing Medical Ed...Marty Daniel with ThunderActive
 
U.S. Sales Communications Excellence: Resources, Structure and Processes to O...
U.S. Sales Communications Excellence: Resources, Structure and Processes to O...U.S. Sales Communications Excellence: Resources, Structure and Processes to O...
U.S. Sales Communications Excellence: Resources, Structure and Processes to O...Marty Daniel with ThunderActive
 
Government Affairs and Public Policy Excellence Report Summary
Government Affairs and Public Policy Excellence Report SummaryGovernment Affairs and Public Policy Excellence Report Summary
Government Affairs and Public Policy Excellence Report SummaryMarty Daniel with ThunderActive
 
Pharma Public Affairs- Resources Required to Serve the US Market Report Summary
Pharma Public Affairs- Resources Required to Serve the US Market Report SummaryPharma Public Affairs- Resources Required to Serve the US Market Report Summary
Pharma Public Affairs- Resources Required to Serve the US Market Report SummaryMarty Daniel with ThunderActive
 
SM 169A High-Performance Market Research Functions Report Summary
SM 169A High-Performance Market Research Functions Report SummarySM 169A High-Performance Market Research Functions Report Summary
SM 169A High-Performance Market Research Functions Report SummaryMarty Daniel with ThunderActive
 

More from Marty Daniel with ThunderActive (12)

Inbound Marketing for Law Firms
Inbound Marketing for Law FirmsInbound Marketing for Law Firms
Inbound Marketing for Law Firms
 
Ozge's Awesome Hummus
Ozge's Awesome HummusOzge's Awesome Hummus
Ozge's Awesome Hummus
 
Medical Affairs Excellence Services Summary
Medical Affairs Excellence Services SummaryMedical Affairs Excellence Services Summary
Medical Affairs Excellence Services Summary
 
Educating the Market: Creating Value Through Support of Continuing Medical Ed...
Educating the Market: Creating Value Through Support of Continuing Medical Ed...Educating the Market: Creating Value Through Support of Continuing Medical Ed...
Educating the Market: Creating Value Through Support of Continuing Medical Ed...
 
U.S. Sales Communications Excellence: Resources, Structure and Processes to O...
U.S. Sales Communications Excellence: Resources, Structure and Processes to O...U.S. Sales Communications Excellence: Resources, Structure and Processes to O...
U.S. Sales Communications Excellence: Resources, Structure and Processes to O...
 
Government Affairs and Public Policy Excellence Report Summary
Government Affairs and Public Policy Excellence Report SummaryGovernment Affairs and Public Policy Excellence Report Summary
Government Affairs and Public Policy Excellence Report Summary
 
Corporate Affairs Excellence Report Summary
Corporate Affairs Excellence Report SummaryCorporate Affairs Excellence Report Summary
Corporate Affairs Excellence Report Summary
 
Pharma Public Affairs- Resources Required to Serve the US Market Report Summary
Pharma Public Affairs- Resources Required to Serve the US Market Report SummaryPharma Public Affairs- Resources Required to Serve the US Market Report Summary
Pharma Public Affairs- Resources Required to Serve the US Market Report Summary
 
SM 169A High-Performance Market Research Functions Report Summary
SM 169A High-Performance Market Research Functions Report SummarySM 169A High-Performance Market Research Functions Report Summary
SM 169A High-Performance Market Research Functions Report Summary
 
Health Outcomes Report Summary
Health Outcomes Report SummaryHealth Outcomes Report Summary
Health Outcomes Report Summary
 
Optimizing KOL Relationships Report Summary
Optimizing KOL Relationships Report SummaryOptimizing KOL Relationships Report Summary
Optimizing KOL Relationships Report Summary
 
OP 106A Raising Disease State Awareness Report Summary
OP 106A Raising Disease State Awareness Report SummaryOP 106A Raising Disease State Awareness Report Summary
OP 106A Raising Disease State Awareness Report Summary
 

Recently uploaded

Vip Female Escorts Noida 9711199171 Greater Noida Escorts Service
Vip Female Escorts Noida 9711199171 Greater Noida Escorts ServiceVip Female Escorts Noida 9711199171 Greater Noida Escorts Service
Vip Female Escorts Noida 9711199171 Greater Noida Escorts Serviceankitnayak356677
 
RE Capital's Visionary Leadership under Newman Leech
RE Capital's Visionary Leadership under Newman LeechRE Capital's Visionary Leadership under Newman Leech
RE Capital's Visionary Leadership under Newman LeechNewman George Leech
 
Vip Dewas Call Girls #9907093804 Contact Number Escorts Service Dewas
Vip Dewas Call Girls #9907093804 Contact Number Escorts Service DewasVip Dewas Call Girls #9907093804 Contact Number Escorts Service Dewas
Vip Dewas Call Girls #9907093804 Contact Number Escorts Service Dewasmakika9823
 
Regression analysis: Simple Linear Regression Multiple Linear Regression
Regression analysis:  Simple Linear Regression Multiple Linear RegressionRegression analysis:  Simple Linear Regression Multiple Linear Regression
Regression analysis: Simple Linear Regression Multiple Linear RegressionRavindra Nath Shukla
 
Call Girls In Sikandarpur Gurgaon ❤️8860477959_Russian 100% Genuine Escorts I...
Call Girls In Sikandarpur Gurgaon ❤️8860477959_Russian 100% Genuine Escorts I...Call Girls In Sikandarpur Gurgaon ❤️8860477959_Russian 100% Genuine Escorts I...
Call Girls In Sikandarpur Gurgaon ❤️8860477959_Russian 100% Genuine Escorts I...lizamodels9
 
Call Girls In Connaught Place Delhi ❤️88604**77959_Russian 100% Genuine Escor...
Call Girls In Connaught Place Delhi ❤️88604**77959_Russian 100% Genuine Escor...Call Girls In Connaught Place Delhi ❤️88604**77959_Russian 100% Genuine Escor...
Call Girls In Connaught Place Delhi ❤️88604**77959_Russian 100% Genuine Escor...lizamodels9
 
Non Text Magic Studio Magic Design for Presentations L&P.pptx
Non Text Magic Studio Magic Design for Presentations L&P.pptxNon Text Magic Studio Magic Design for Presentations L&P.pptx
Non Text Magic Studio Magic Design for Presentations L&P.pptxAbhayThakur200703
 
A DAY IN THE LIFE OF A SALESMAN / WOMAN
A DAY IN THE LIFE OF A  SALESMAN / WOMANA DAY IN THE LIFE OF A  SALESMAN / WOMAN
A DAY IN THE LIFE OF A SALESMAN / WOMANIlamathiKannappan
 
GD Birla and his contribution in management
GD Birla and his contribution in managementGD Birla and his contribution in management
GD Birla and his contribution in managementchhavia330
 
Call Girls Navi Mumbai Just Call 9907093804 Top Class Call Girl Service Avail...
Call Girls Navi Mumbai Just Call 9907093804 Top Class Call Girl Service Avail...Call Girls Navi Mumbai Just Call 9907093804 Top Class Call Girl Service Avail...
Call Girls Navi Mumbai Just Call 9907093804 Top Class Call Girl Service Avail...Dipal Arora
 
Lucknow 💋 Escorts in Lucknow - 450+ Call Girl Cash Payment 8923113531 Neha Th...
Lucknow 💋 Escorts in Lucknow - 450+ Call Girl Cash Payment 8923113531 Neha Th...Lucknow 💋 Escorts in Lucknow - 450+ Call Girl Cash Payment 8923113531 Neha Th...
Lucknow 💋 Escorts in Lucknow - 450+ Call Girl Cash Payment 8923113531 Neha Th...anilsa9823
 
Call Girls In Panjim North Goa 9971646499 Genuine Service
Call Girls In Panjim North Goa 9971646499 Genuine ServiceCall Girls In Panjim North Goa 9971646499 Genuine Service
Call Girls In Panjim North Goa 9971646499 Genuine Serviceritikaroy0888
 
Lowrate Call Girls In Sector 18 Noida ❤️8860477959 Escorts 100% Genuine Servi...
Lowrate Call Girls In Sector 18 Noida ❤️8860477959 Escorts 100% Genuine Servi...Lowrate Call Girls In Sector 18 Noida ❤️8860477959 Escorts 100% Genuine Servi...
Lowrate Call Girls In Sector 18 Noida ❤️8860477959 Escorts 100% Genuine Servi...lizamodels9
 
Intro to BCG's Carbon Emissions Benchmark_vF.pdf
Intro to BCG's Carbon Emissions Benchmark_vF.pdfIntro to BCG's Carbon Emissions Benchmark_vF.pdf
Intro to BCG's Carbon Emissions Benchmark_vF.pdfpollardmorgan
 
rishikeshgirls.in- Rishikesh call girl.pdf
rishikeshgirls.in- Rishikesh call girl.pdfrishikeshgirls.in- Rishikesh call girl.pdf
rishikeshgirls.in- Rishikesh call girl.pdfmuskan1121w
 
Progress Report - Oracle Database Analyst Summit
Progress  Report - Oracle Database Analyst SummitProgress  Report - Oracle Database Analyst Summit
Progress Report - Oracle Database Analyst SummitHolger Mueller
 
Catalogue ONG NUOC PPR DE NHAT .pdf
Catalogue ONG NUOC PPR DE NHAT      .pdfCatalogue ONG NUOC PPR DE NHAT      .pdf
Catalogue ONG NUOC PPR DE NHAT .pdfOrient Homes
 
Insurers' journeys to build a mastery in the IoT usage
Insurers' journeys to build a mastery in the IoT usageInsurers' journeys to build a mastery in the IoT usage
Insurers' journeys to build a mastery in the IoT usageMatteo Carbone
 
2024 Numerator Consumer Study of Cannabis Usage
2024 Numerator Consumer Study of Cannabis Usage2024 Numerator Consumer Study of Cannabis Usage
2024 Numerator Consumer Study of Cannabis UsageNeil Kimberley
 

Recently uploaded (20)

Vip Female Escorts Noida 9711199171 Greater Noida Escorts Service
Vip Female Escorts Noida 9711199171 Greater Noida Escorts ServiceVip Female Escorts Noida 9711199171 Greater Noida Escorts Service
Vip Female Escorts Noida 9711199171 Greater Noida Escorts Service
 
RE Capital's Visionary Leadership under Newman Leech
RE Capital's Visionary Leadership under Newman LeechRE Capital's Visionary Leadership under Newman Leech
RE Capital's Visionary Leadership under Newman Leech
 
Vip Dewas Call Girls #9907093804 Contact Number Escorts Service Dewas
Vip Dewas Call Girls #9907093804 Contact Number Escorts Service DewasVip Dewas Call Girls #9907093804 Contact Number Escorts Service Dewas
Vip Dewas Call Girls #9907093804 Contact Number Escorts Service Dewas
 
Regression analysis: Simple Linear Regression Multiple Linear Regression
Regression analysis:  Simple Linear Regression Multiple Linear RegressionRegression analysis:  Simple Linear Regression Multiple Linear Regression
Regression analysis: Simple Linear Regression Multiple Linear Regression
 
Call Girls In Sikandarpur Gurgaon ❤️8860477959_Russian 100% Genuine Escorts I...
Call Girls In Sikandarpur Gurgaon ❤️8860477959_Russian 100% Genuine Escorts I...Call Girls In Sikandarpur Gurgaon ❤️8860477959_Russian 100% Genuine Escorts I...
Call Girls In Sikandarpur Gurgaon ❤️8860477959_Russian 100% Genuine Escorts I...
 
Call Girls In Connaught Place Delhi ❤️88604**77959_Russian 100% Genuine Escor...
Call Girls In Connaught Place Delhi ❤️88604**77959_Russian 100% Genuine Escor...Call Girls In Connaught Place Delhi ❤️88604**77959_Russian 100% Genuine Escor...
Call Girls In Connaught Place Delhi ❤️88604**77959_Russian 100% Genuine Escor...
 
Non Text Magic Studio Magic Design for Presentations L&P.pptx
Non Text Magic Studio Magic Design for Presentations L&P.pptxNon Text Magic Studio Magic Design for Presentations L&P.pptx
Non Text Magic Studio Magic Design for Presentations L&P.pptx
 
Forklift Operations: Safety through Cartoons
Forklift Operations: Safety through CartoonsForklift Operations: Safety through Cartoons
Forklift Operations: Safety through Cartoons
 
A DAY IN THE LIFE OF A SALESMAN / WOMAN
A DAY IN THE LIFE OF A  SALESMAN / WOMANA DAY IN THE LIFE OF A  SALESMAN / WOMAN
A DAY IN THE LIFE OF A SALESMAN / WOMAN
 
GD Birla and his contribution in management
GD Birla and his contribution in managementGD Birla and his contribution in management
GD Birla and his contribution in management
 
Call Girls Navi Mumbai Just Call 9907093804 Top Class Call Girl Service Avail...
Call Girls Navi Mumbai Just Call 9907093804 Top Class Call Girl Service Avail...Call Girls Navi Mumbai Just Call 9907093804 Top Class Call Girl Service Avail...
Call Girls Navi Mumbai Just Call 9907093804 Top Class Call Girl Service Avail...
 
Lucknow 💋 Escorts in Lucknow - 450+ Call Girl Cash Payment 8923113531 Neha Th...
Lucknow 💋 Escorts in Lucknow - 450+ Call Girl Cash Payment 8923113531 Neha Th...Lucknow 💋 Escorts in Lucknow - 450+ Call Girl Cash Payment 8923113531 Neha Th...
Lucknow 💋 Escorts in Lucknow - 450+ Call Girl Cash Payment 8923113531 Neha Th...
 
Call Girls In Panjim North Goa 9971646499 Genuine Service
Call Girls In Panjim North Goa 9971646499 Genuine ServiceCall Girls In Panjim North Goa 9971646499 Genuine Service
Call Girls In Panjim North Goa 9971646499 Genuine Service
 
Lowrate Call Girls In Sector 18 Noida ❤️8860477959 Escorts 100% Genuine Servi...
Lowrate Call Girls In Sector 18 Noida ❤️8860477959 Escorts 100% Genuine Servi...Lowrate Call Girls In Sector 18 Noida ❤️8860477959 Escorts 100% Genuine Servi...
Lowrate Call Girls In Sector 18 Noida ❤️8860477959 Escorts 100% Genuine Servi...
 
Intro to BCG's Carbon Emissions Benchmark_vF.pdf
Intro to BCG's Carbon Emissions Benchmark_vF.pdfIntro to BCG's Carbon Emissions Benchmark_vF.pdf
Intro to BCG's Carbon Emissions Benchmark_vF.pdf
 
rishikeshgirls.in- Rishikesh call girl.pdf
rishikeshgirls.in- Rishikesh call girl.pdfrishikeshgirls.in- Rishikesh call girl.pdf
rishikeshgirls.in- Rishikesh call girl.pdf
 
Progress Report - Oracle Database Analyst Summit
Progress  Report - Oracle Database Analyst SummitProgress  Report - Oracle Database Analyst Summit
Progress Report - Oracle Database Analyst Summit
 
Catalogue ONG NUOC PPR DE NHAT .pdf
Catalogue ONG NUOC PPR DE NHAT      .pdfCatalogue ONG NUOC PPR DE NHAT      .pdf
Catalogue ONG NUOC PPR DE NHAT .pdf
 
Insurers' journeys to build a mastery in the IoT usage
Insurers' journeys to build a mastery in the IoT usageInsurers' journeys to build a mastery in the IoT usage
Insurers' journeys to build a mastery in the IoT usage
 
2024 Numerator Consumer Study of Cannabis Usage
2024 Numerator Consumer Study of Cannabis Usage2024 Numerator Consumer Study of Cannabis Usage
2024 Numerator Consumer Study of Cannabis Usage
 

New Product Launch Spend Report Summary

  • 1. New Product Launch Spend: What It Takes to Win in the U.S. Market Best Practices, LLC Strategic Benchmarking Research 1 Copyright © Best Practices, LLC BEST PRACTICES, ® LLC
  • 2. Executive Summary  Project Objectives & Methodology  Key Findings & Insights  Companies Participating in Study  Participant/ Product Demographic Data 2 Copyright © Best Practices, LLC BEST PRACTICES, ® LLC
  • 3. Project Objectives & Methodology Best Practices, LLC developed a customized survey tool to capture industry data and deployed it to a representative sample of 27 brand & marketing leaders at 23 leading biopharmaceutical companies. Study Objective: Contents: The objective of this  Industry average cost for new benchmarking study was to pharmaceutical product launch help biopharma leaders develop competitive launch and pre-  Average cost for specialty and launch activity budgets to primary product launches ensure successful U.S. market  Percentage of budget allocated entry for new products. to 12 key marketing, education and market access activities during and This data will serve as a reference or comparison point prior to launch for brand and marketing leaders  Timing for conducting 50+ activities as they develop budgets and  Anticipated budget & activity trends allocate funds for their new  Top 3 success factors brands. BEST PRACTICES, 3 ® Copyright © Best Practices, LLC LLC
  • 4. Universe of Learning: Companies Participating in Study Benchmark participants included 27 executives and managers at 23 leading biopharmaceutical companies. Survey Only Participating Companies Abbott, Amylin, Astellas, Bausch & Lomb, Baxter Healthcare, Bayer HealthCare, Bristol-Myers Squibb, EMD Serono, Genzyme, GlaxoSmithKline, Inspire, Lundbeck, Merck & Co., Noven, Novo Nordisk, Onyx, ProStrakan, Regeneron, Roche, sanofi-aventis, Shire, Teva, Xanodyne. BEST PRACTICES, 4 ® Copyright © Best Practices, LLC LLC
  • 5. Participants’ Job Titles & Functional Areas Directors and Vice Presidents make up more than three-quarters of the benchmark class. More than half the respondents work within marketing functions or departments. Participant Job Titles Participant Departments/Functions Other (Head, Leader) Marketing 52% Manager/ VP/EVP/ 7% SVP Sr. Manager 11% 22% Commercial 11% New Products 7% Managed 7% Markets 60% * Other 19% Director/Senior Director/ * Other= R&D, Medical Affairs, Regulatory Affairs, Executive Director Product Launch, Market Analytics, Business Development (n=27) (n=27) BEST PRACTICES, 5 ® Copyright © Best Practices, LLC LLC
  • 6. Launch Investment Benchmarks Research Protocol for Participants  Focus all responses on a single product launched recently into the U.S. market.  Provide total investment for launch activities during four budget years leading up to launch.  Total investment is defined as: The total U.S. investment for pre- launch/launch activities in a given budget year. Includes all resources invested in promotional (marketing), educational and market access activities. Excludes only clinical trial costs.  Launch Year: The budget year in which the product was launched.  Launch Years -1, -2 and -3: The budget years one, two and three years prior to the Launch Year. 6 Copyright © Best Practices, LLC BEST PRACTICES, ® LLC
  • 7. Launch Year Investment Averages $XXX Million Launch year spending wins a lion’s share of investment resources. For the total benchmark class Launch Year spend nearly equals the approximate sum of all previous years commercialization investments on average. Q. Indicate your total U.S. investment for pre-launch activities for your product in the three years prior to the U.S. product launch. Include all resources invested in promotional, educational & market-access activities. Exclude only clinical trial costs. TOTAL BENCHMARK Launch Year Launch Year Launch Year Launch Year CLASS -1 -2 -3 High $XXX $XXX $XXX $XXX Top Quartile $XXX $XXX $XXX $XXX Average (Mean) $XXX $XXX $XXX $XXX Median $XXX $XXX $XXX $XXX Bottom Quartile $XXX $XXX $XXX $XXX Low $XXX $XXX $XXX $XXX n= 19 16 14 9 BEST PRACTICES, 7 ® Copyright © Best Practices, LLC LLC
  • 8. Specialty Launch Year Investment Averages $XX Million Specialty Care launches mirror the overall investment patterns reflected in the full benchmark class with spend trending upward each year. However, investment levels at launch are lower and more compressed around the median. Q. Indicate your total U.S. investment for pre-launch activities for your product in the three years prior to the U.S. product launch. Include all resources invested in promotional, educational & market-access activities. Exclude only clinical trial costs. SPECIALTY Launch Year Launch Year Launch Year Launch Year SEGMENTATION -1 -2 -3 High $XXX $XXX $XXX $XXX Top Quartile $XXX $XXX $XXX $XXX Average (Mean) $XXX $XXX $XXX $XXX Median $XXX $XXX $XXX $XXX Bottom Quartile $XXX $XXX $XXX $XXX Low $XXX $XXX $XXX $XXX n= 12 8 8 4 BEST PRACTICES, 8 ® Copyright © Best Practices, LLC LLC
  • 9. Primary Care Launch Year Investment Averages $XXX Million Market entry for primary care product launches consumes far greater resources than specialty launches. Correspondingly they receive two to three times greater budget resources at Launch Year to reach the much larger population of primary care physicians. Q. Indicate your total U.S. investment for pre-launch activities for your product in the three years prior to the U.S. product launch. Include all resources invested in promotional, educational & market-access activities. Exclude only clinical trial costs. PRIMARY CARE Launch Year Launch Year Launch Year Launch Year SEGMENTATION -1 -2 -3 High $XXX $XXX $XXX $XXX Top Quartile $XXX $XXX $XXX $XXX Average (Mean) $XXX $XXX $XXX $XXX Median $XXX $XXX $XXX $XXX Bottom Quartile $XXX $XXX $XXX $XXX Low $XXX $XXX $XXX $XXX n= 7 7 6 5 BEST PRACTICES, 9 ® Copyright © Best Practices, LLC LLC
  • 10. Investment Data by Product Segment Data is segmented by:  Projected Peak Annual Revenue  Therapeutic Areas – Oncology & Endocrine/Metabolic  Product Market Entry Position 10 Copyright © Best Practices, LLC BEST PRACTICES, ® LLC
  • 11. Peak Annual Revenue Projections Correlate With Resource Allocations Benchmarked products covered a wide range of market opportunities – each reflecting different projected peak annual revenues. At the high end, one-fourth hope to earn more than $1 billion peak year revenues; at the low end, 21% projected peak earnings of less than $250 million. Peak-year revenue is the metric that most clearly reflects the market opportunity assessment and corresponding market entry budgets. Q. What was the projected peak annual revenue (in $US) for your product before launch? Projected Peak Annual Revenue $1B-$2B 25% 21% <$250M $750M-$1B 18% 25% $250M-$500M 11% (n=27) $500M-$750M BEST PRACTICES, 11 ® Copyright © Best Practices, LLC LLC
  • 12. Total Launch Investment by Peak Revenue Category: Data for Launch Year PROJECTED PEAK # Responses Average ANNUAL REVENUE: High Low in Range (Mean) LAUNCH YEAR <$250 M 4 $XXX $XXX $XXX $250M -$500 M 5 $XXX $XXX $XXX $500 M - $750 M 2 $XXX $XXX $XXX $750 M - $1B 3 $XXX $XXX $XXX $1 B- $2 B 5 $XXX $XXX $XXX BEST PRACTICES, 12 ® Copyright © Best Practices, LLC LLC
  • 13. Average Spend Comparison for Each Market Entry Position Crowded market products spend less than one-third overall than do differentiated products in either novel or established areas, however, they close a large portion of that gap in the final year, when their spending increases nearly eight-fold over Year -1. Average Total Spend by Market Entry Position Launch Launch Launch Market Entry Position Launch Year TOTAL Year -1 Year -2 Year -3 Differentiated Product in Novel Treatment Area $XXX $XXX $XXX $XXX $XXX Differentiated Product Entering Established Market $XXX $XXX $XXX $XXX $XXX Crowded Market Upstart Product $XXX $XXX $XXX $XXX $XXX Differentiated products entering established markets have the highest total spend, with the greatest difference occurring in Year-1. (Total n=27) BEST PRACTICES, 13 ® Copyright © Best Practices, LLC LLC
  • 14. Launch Activities Benchmark partners were asked to indicate which launch activities they fund within each of the following categories during the last four budget years leading up to launch.  Agency Fees (excluding DTC)  Direct to Consumer & Advertising Expenses  Health Economics/ Outcomes Research  Launch Meeting/ Kickoff  Managed Markets/Market Access  Market Research/Analytics (excluding DTC)  Medical Affairs  Patient Education/ Assistance  Physician Education  Sales Force Preparation  Other 14 Copyright © Best Practices, LLC BEST PRACTICES, ® LLC
  • 15. Activities Included in Agency Fees Spend Key activities funded by participants within the Agency Fees budget category were promotion/advertising and communications/publications. Promotion was the activity funded by the most companies in the Launch Year, Year -1 and Year -2. In the Year -3, the greatest number of companies funded communications/publications activities. Q. Please check all of the listed activities that were included in your product's Year -3, Year -2, Year -1 and Launch Year budgets. AGENCY FEES (excluding DTC) Pre-Launch Launch Year -3 Year -2 Year -1 Promotional/ 33% 80% 92% 100% Advertising Communications/ 83% 60% 85% 76% Publications 67% 40% 54% Public Relations 76% 17% 40% 38% Retainers 41% =most frequent activity per year 0% 10% 0% Other (specify): 0% Other (Year -2): n=6 n = 10 n = 13 n = 17 • Positioning, campaign development BEST PRACTICES, 15 ® Copyright © Best Practices, LLC LLC
  • 16. Activities Expected to Gain Funding in Near Future Health Outcomes and Health Economics Research are expected to grow significantly in importance in the next three years, with 97% projecting spending increases there. A majority of participants also expect increases for managed markets, medical affairs and patient education spend. Q. In your opinion, how will recent and anticipated market changes impact funding levels for the following types of launch activities over the next 24-36 months? Total Significant increase Some increase Increase Health economics/outcomes research 40% 56% 96% Managed markets/market access 24% 60% 84% Medical affairs 8% 72% 80% Patient education/ assistance 8% 52% 60% Physician education 36% 36% DTC 8% 28% 36% Samples 4% 28% 32% Sales force preparation 4% 28% 32% Market research/analytics (excluding DTC) 8% 24% 32% Launch meeting (kickoff) 16% 16% Agency fees (excluding DTC) 12% 12% (n=29) % Responses BEST PRACTICES, 16 ® Copyright © Best Practices, LLC LLC
  • 17. Launch Investment Allocation  Participants indicated their total U.S. investment for pre- launch activities for their respective product in four different budget years: Launch Year, Year -1, Year -2, and Year -3.  Budget numbers provided include all resources invested in promotional, educational & market-access activities, excluding only clinical trial costs.  Slides in this section exhibit average, high and low spend allocated for activities in 12 categories for the Launch Year and the three years preceding launch.  Data is provided for the full benchmark class. In addition, data is provided for the following benchmark class segments: Primary care products, specialty products and Oncology products. 17 Copyright © Best Practices, LLC BEST PRACTICES, ® LLC
  • 18. Investment Allocation by Activity Category (1) Total Benchmark Class: Yellow highlights indicate highest three spend areas for each year. Red circles indicate activities for which Launch Year & Launch Year -1 Year -1 spend exceeds Launch Year investment. Activity Category Launch Yr. n = 18 Year -1 n = 14 High Average Low High Average Low Agency fees (excluding DTC) $XXXX $XXXX $XXXX $XXXX $XXXX $XXXX DTC & Advertising Expenses $XXXX $XXXX $XXXX $XXXX $XXXX $XXXX Health economics/ outcomes $XXXX $XXXX $XXXX $XXXX $XXXX $XXXX research Managed markets/ market $XXXX $XXXX $XXXX $XXXX $XXXX $XXXX access Market research/ analytics $XXXX $XXXX $XXXX $XXXX $XXXX $XXXX (excluding DTC) Medical affairs $XXXX $XXXX $XXXX $XXXX $XXXX $XXXX Patient education/ assistance $XXXX $XXXX $XXXX $XXXX $XXXX $XXXX Physician education $XXXX $XXXX $XXXX $XXXX $XXXX $XXXX Sales force preparation $XXXX $XXXX $XXXX $XXXX $XXXX $XXXX Other Marketing activities $XXXX $XXXX $XXXX $XXXX $XXXX $XXXX Launch meeting (kickoff) $XXXX $XXXX $XXXX $XXXX $XXXX $XXXX Samples $XXXX $XXXX $XXXX $XXXX $XXXX $XXXX * $70 mil response not included in calculations. * $50 mil and $13.8 mil responses not included in calculations. BEST PRACTICES 18 ® Copyright © Best Practices, LLC , LLC
  • 19. Success Factors 19 Copyright © Best Practices, LLC BEST PRACTICES, ® LLC
  • 20. Top Areas to Consider in Setting Launch Budgets Survey participants identified Managed Care access and reimbursement, physician awareness, KOL relationships, and solid market research as the most important areas to consider in establishing successful new product launch budgets. Q. What are the three most important success factors to consider in establishing and allocating new product launch budgets in today’s market? Success Factor Categories Verbatim Responses: Managed Care Access/ Reimbursement 50% “Good definition of the key influencers & decision makers.” Physician/KOL Awareness/ Education 38% “Getting medical information/education to physicians without use of sales reps.” Market Research/Market Analytics Data 38% “Competitive differentiation for HE/OR benefit.” Data - Clinical, Health Economics/ 33% Outcomes, Comparative Effectiveness “Use new/digital vehicles with field force, physician, payer, Patient Education/Awareness 25% patient.” 21% “Investment in physician education (CME & Promotional).” Product Differentiation “Expertise/presence in market today vs. being new entrant.” Physician Access 21% “Ensure managed marketing is adequately funded.” Sales Force Preparation 17% “Differentiating the brand via strategic marketing.” Launch Trajectory 13% “Using alternative marketing sources/direct to physician.” Favorable Co-pay 13% “Creativity and collaboration from the team.” (n=25) Sufficient Investment 13% “Focus on fundamentals.” % Responses “Touch - the number of thought leaders that touch the drug Other: Experience in new market, patient assistance, either in preclinical or clinical settings pre-launch.” understanding competition, understanding how product will be paid for, team collaboration, advocacy. “Research/phase III.” BEST PRACTICES, 20 ® Copyright © Best Practices, LLC LLC
  • 21. Most Important Future Activities 21 Copyright © Best Practices, LLC BEST PRACTICES, ® LLC
  • 22. Activities for Successful Future Specialty Product Launch Nearly half the participants expect managed care access and reimbursement activities to be among the Top 3 most important product launch activities over the next few years. Also key to launch success will be physician education, health outcomes research, sales force prep and market data & analytics. Q. Within the next 24-36 months, what launch activities (traditional or emerging) do you think will be the Top Three most important to achieving a successful launch for a specialty product? Top Activity Categories Verbatim Responses: Managed Care Access/Reimbursement 44% “Targeted research activities that alter the standard of care Market Data & Analytics in settings where the drug is or will be used most frequently.” 28% (e.g., segmenting, forecasting, pricing) “Elucidating clinically significant differentiation vs. standard Sales Force Preparation 28% of care.” 28% Physician Education “Use of novel channels to more frequently reach and 28% connect with end users (Internet).” Health Outcomes/Economics Research 16% “Clear patient (and payer) value proposition.” New Channels (e.g., social media) 16% “Consumer marketing via internet and social media.” Product Differentiation/Positioning 12% “Non-personal education and promotion to physicians.” KOL Relationships “Reimbursement support/Pharmacoeconomics.” Value Proposition 12% “Outcomes Research and Studies - Comparative Outcomes. Patient Education 12% 12% “Claims data analysis.” (n=25) Physician Access % Responses “Interactive educational tools.” “Evidence based guidelines for product use.” Other: CI, reimbursement landscape research & prep, test promotional campaign, interactive educational tools, post-marketing outcomes data, “Clinical outcomes data/post marketing.” attend ad boards, use evidence-based guidelines, strong value proposition BEST PRACTICES, 22 ® Copyright © Best Practices, LLC LLC
  • 23. About Best Practices, LLC Best Practices, LLC is a research and consulting firm that conducts work based on the simple yet profound principle that organizations can chart a course to superior economic performance by studying the best business practices, operating tactics and winning strategies of world-class companies. Best Practices, LLC 6350 Quadrangle Drive, Suite 200, Chapel Hill, NC 27517 919-403-0251 bestpractices@best-in-class.com www.best-in-class.com 23 Copyright © Best Practices, LLC BEST PRACTICES, ® LLC