Download as PDF, PPTX


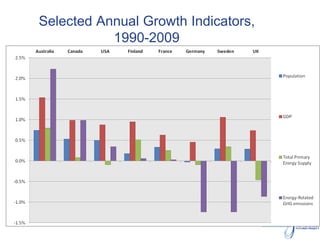


1. The document outlines a partnership between the Canadian Academy of Engineering and the David Suzuki Foundation to identify energy strategies for Canada to reduce greenhouse gas emissions 80% below 1990 levels by 2050, make Canada a global leader in sustainable energy, and ensure all Canadians have access to needed energy. 2. It discusses conceptual frameworks for lowering emissions through increasing energy efficiency, fuel switching to lower carbon options, and carbon management. 3. Data is presented comparing Canada's energy use and emissions to other countries' illustrative low carbon scenarios, showing pathways to decarbonize energy systems and increase renewable energy and energy productivity.


