Download as PDF, PPTX


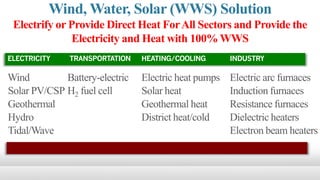


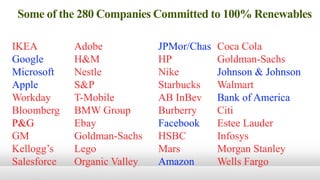
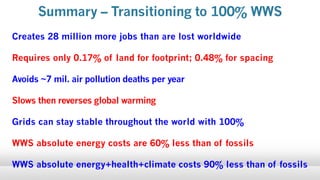


This document discusses the urgent need for a transition to 100% clean, renewable energy to address the global crises of air pollution, climate change, and energy scarcity. It outlines strategies for electrifying various sectors using wind, water, and solar (WWS) energy while detailing the potential economic benefits, including significant cost savings and job creation. The document emphasizes the feasibility of achieving this transition by 2030-2050, supported by multiple countries, cities, and companies committed to renewable energy initiatives.


