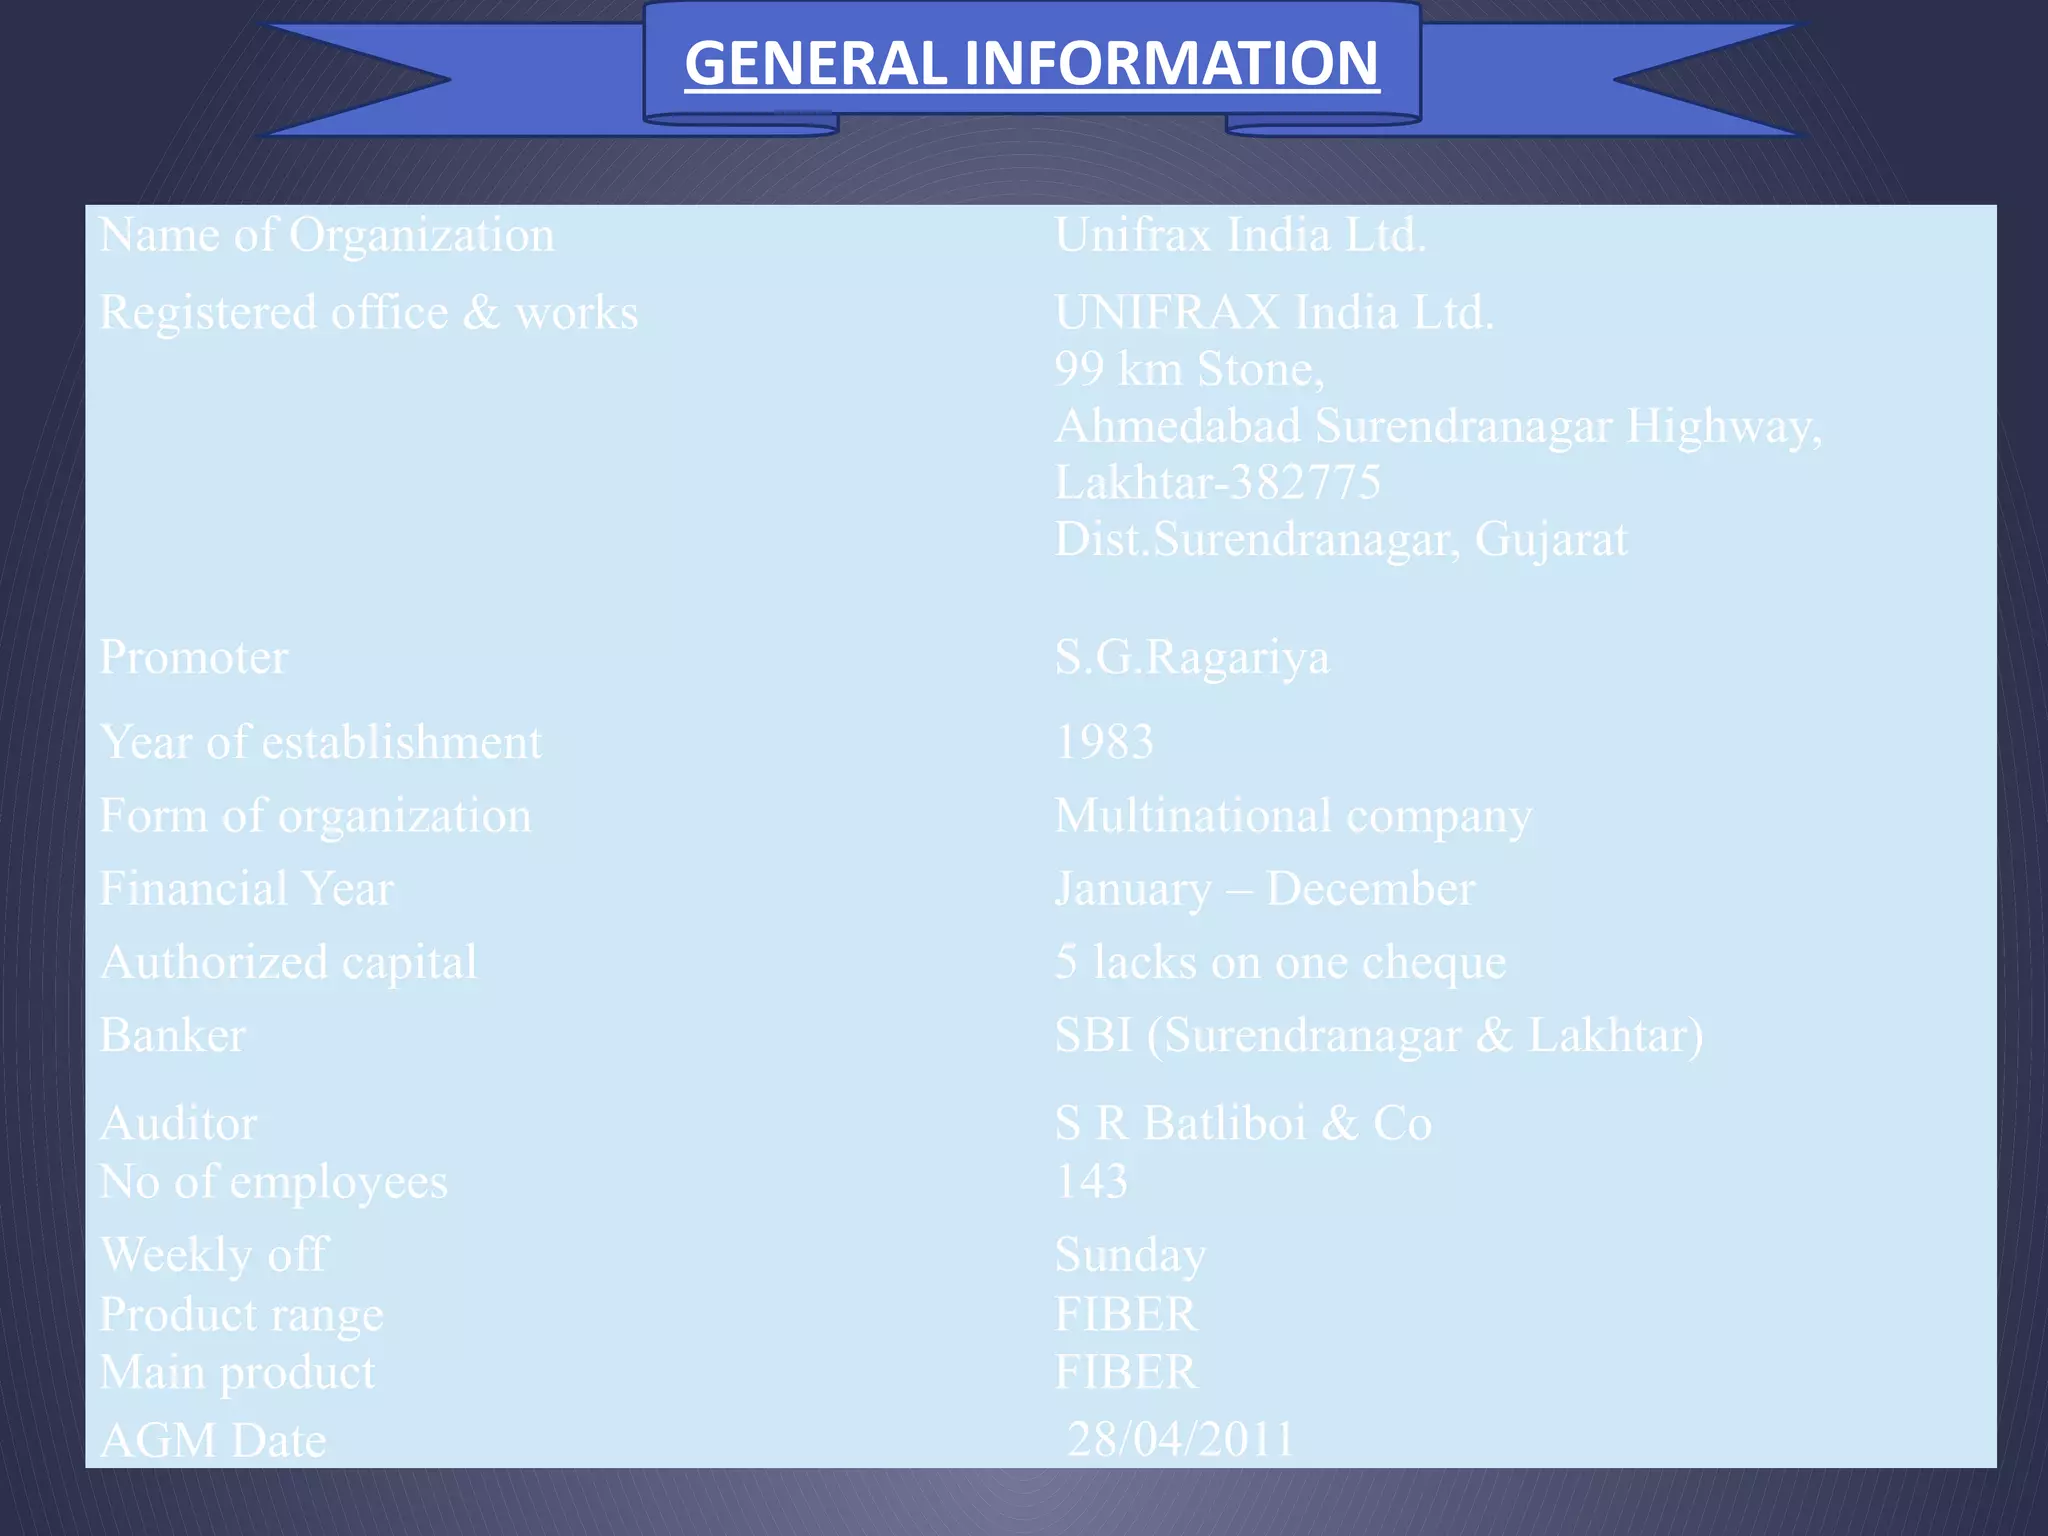
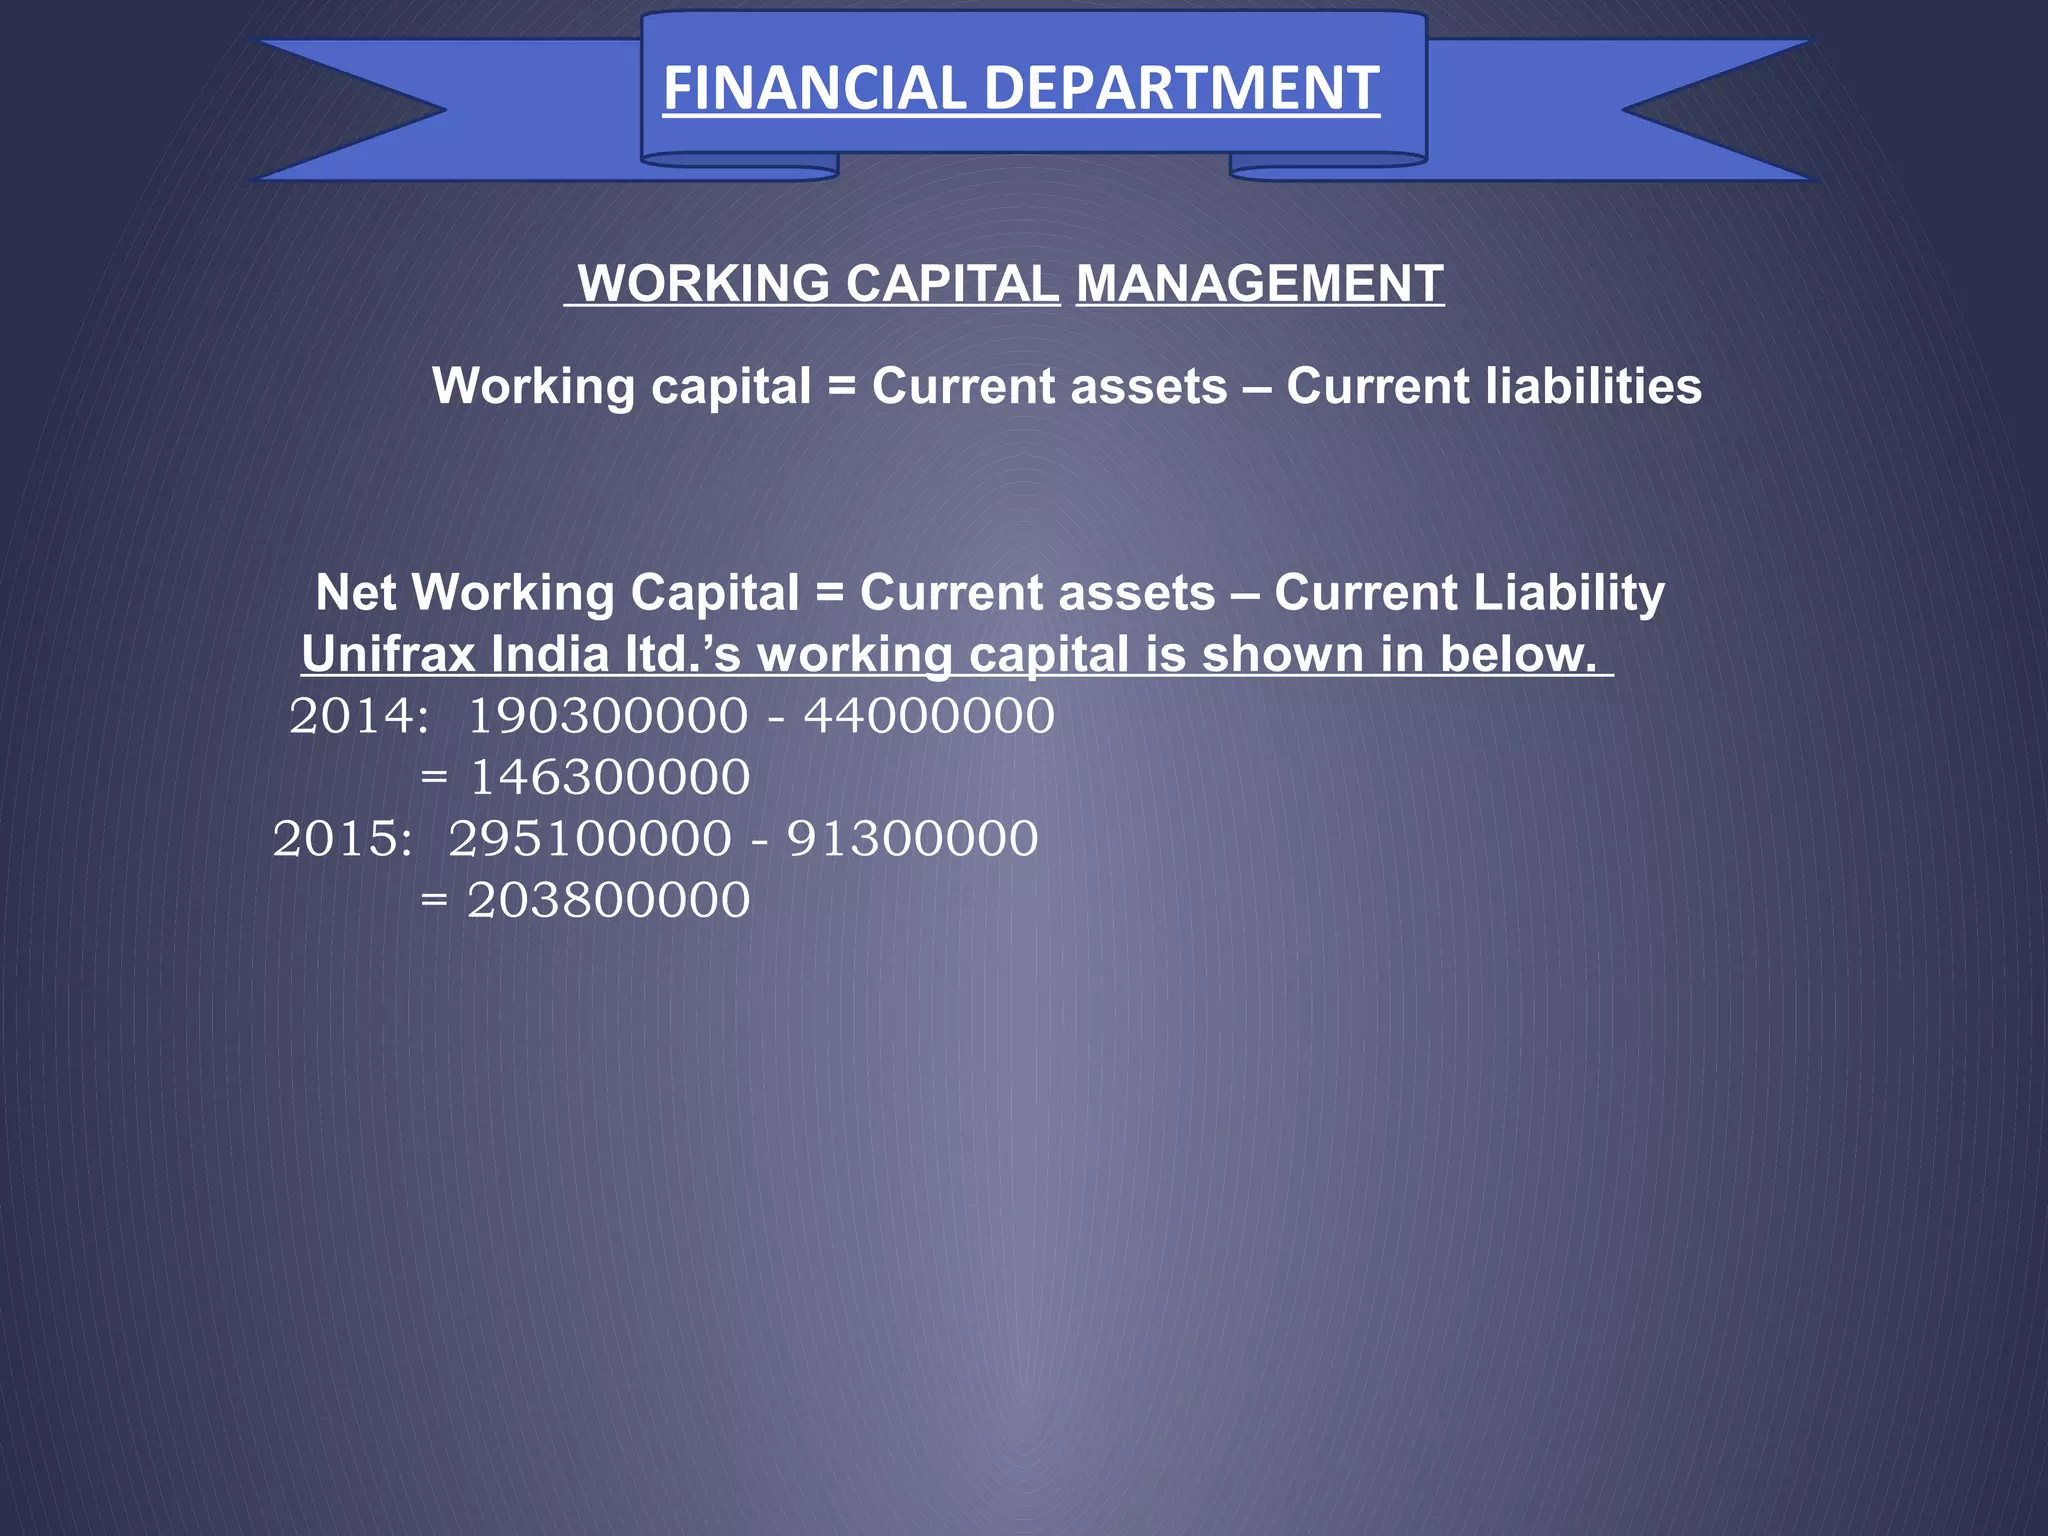
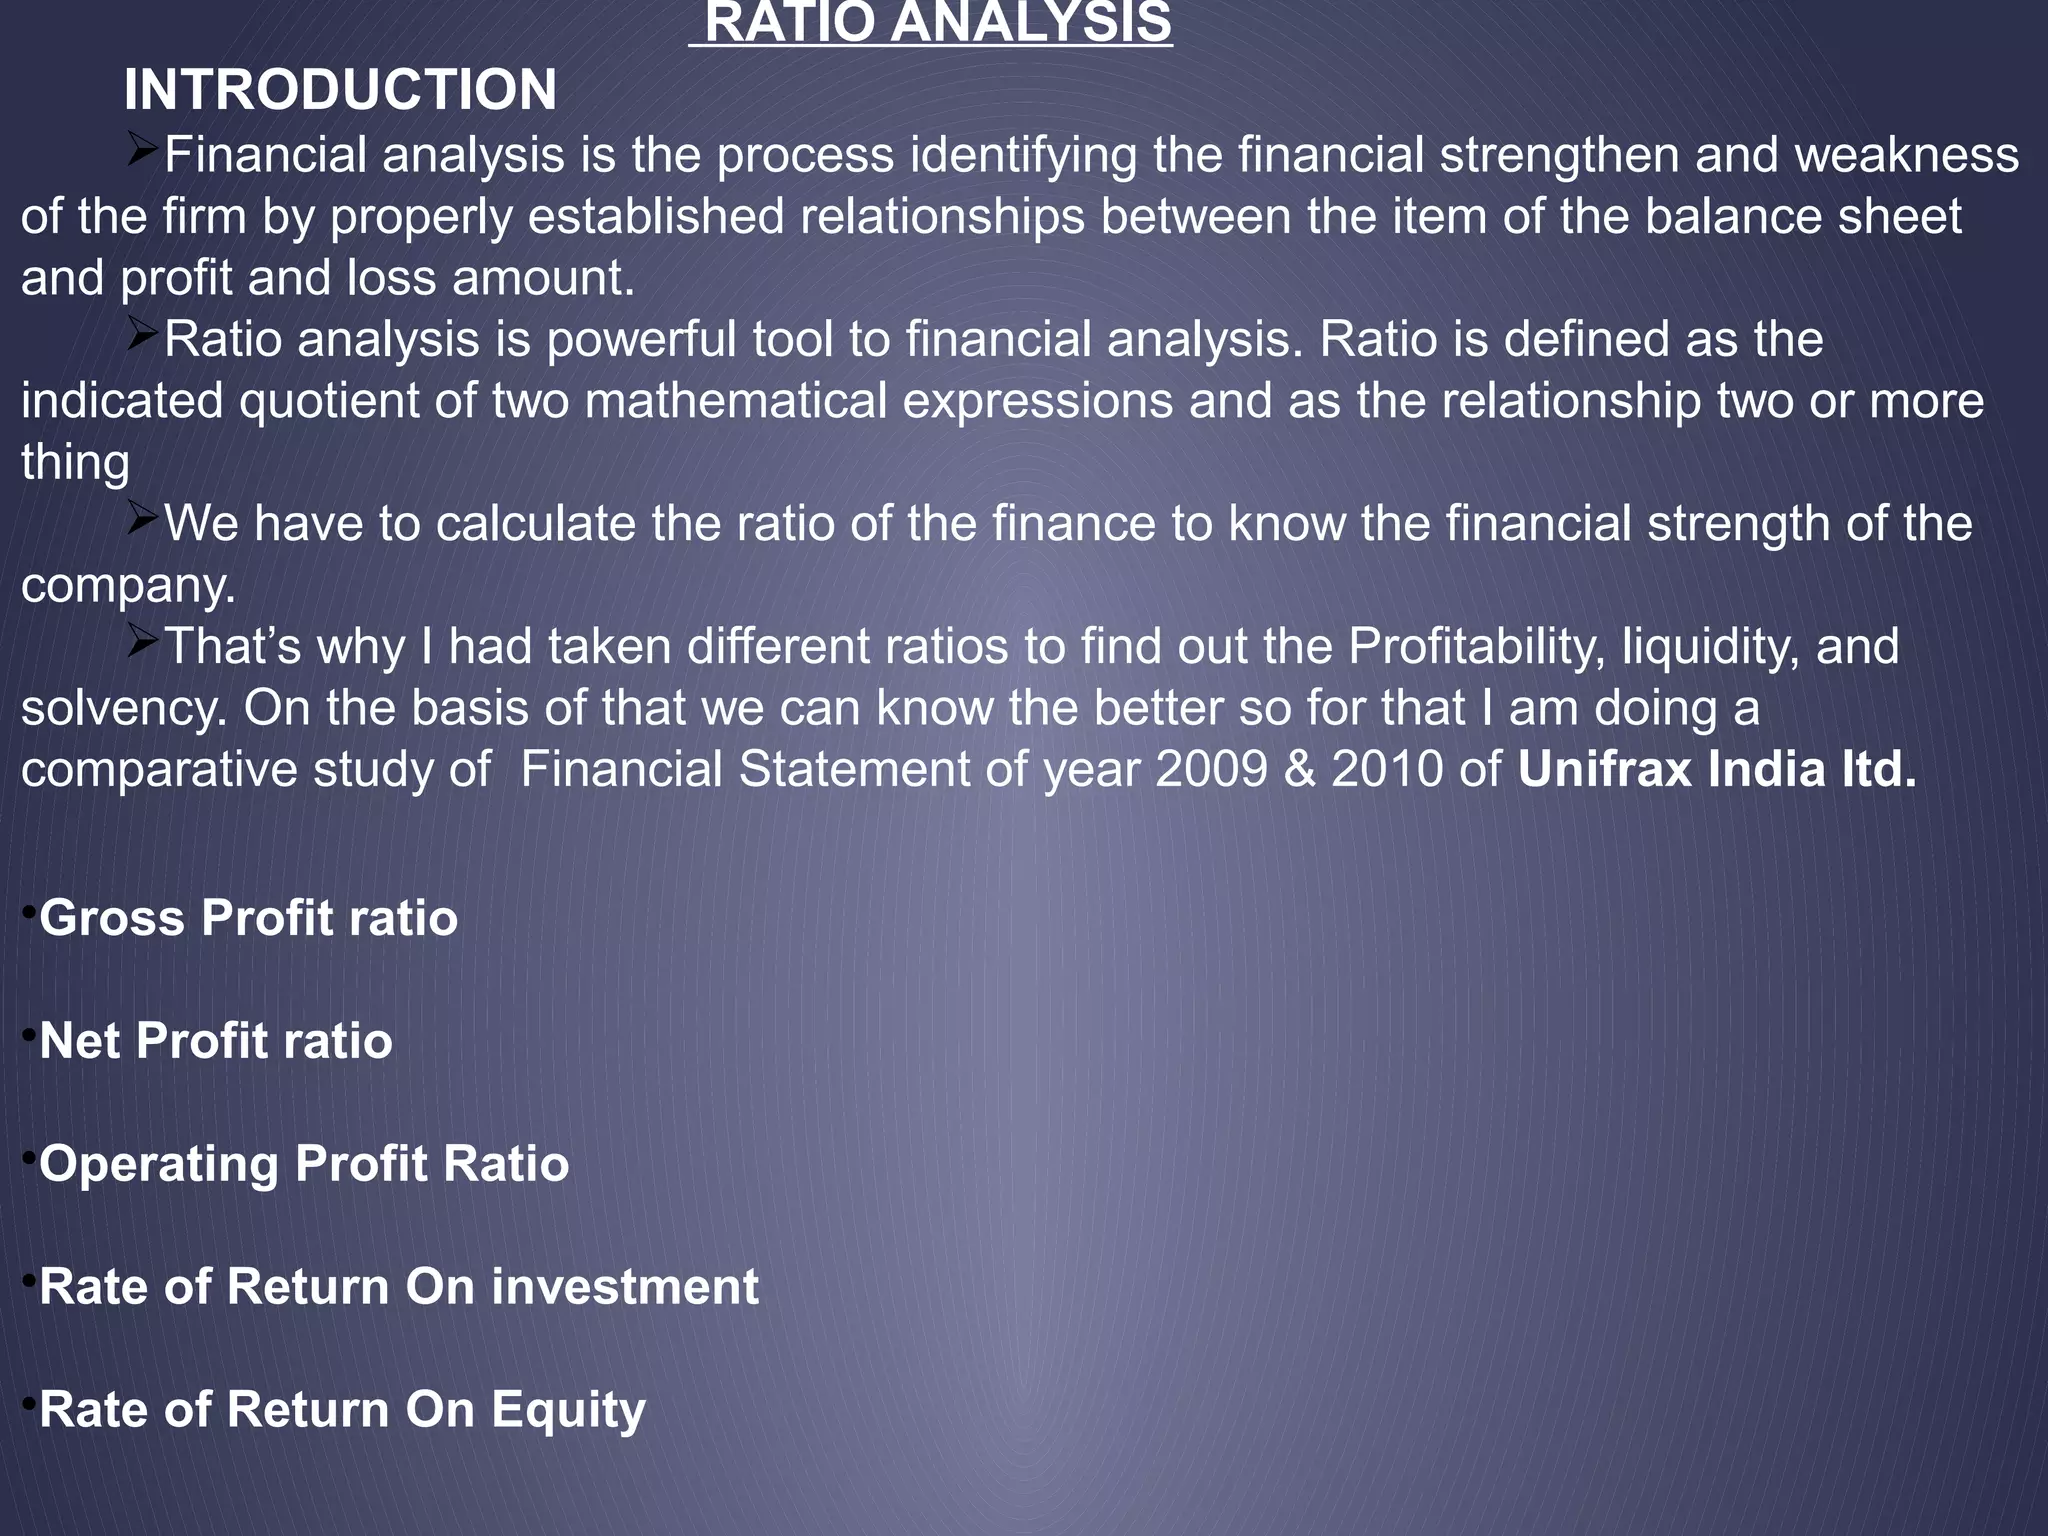
C.U.SHAH UNIVERSITY FACULTY
OF
PRESENTATION ON:- Ratio Analysis
MANAGEMENT STUDIES
Prepared by
NAME EN.NO. VAGHELA
DALSUKH .A 14MS501005
Guided by
Mr. D.A.Sanghvi
NO. PARTICULAR
1. INTRODUCTION
GENERAL INFORMATION
2. LITERATURE REVIEW
3. OBJECTIVE OF THE STUDY
4. RESEARCH STUDY DESIGN
5. ANALYSIS AND FINDING`
6. CONCLUSION
7. BIBIO GRAPHY
INDEX
Unifrax India ltd. co located at high way road in Lakhtar. It was established
in 1983. Mr. S.G.Rajgariya is the promoter of this company.
All the electrical accessories of this unit are certified by ISI mark. It means
all the products are government valid. It has its own unique prestige.
In this unit govt.have observed that most possible effort to motivate the
worker has been done so that the workers become more talented and encourage
working more efficiently. This effort has been done because they believe in
human resource development.
 I have observed the nature and thoughts of the owner of this unit. I
remember that he has told me that there is only one power in this world which
can motivate everything in this world; this power is only one Man Power.
Manpower is everything for the owner of each industry. This though not
only useful to develop the human relation among the employees.
This unit is also very conscious about the customers’ problems. The mgt.
Staff always remains alert to remove their customers’ problems and to give them
satisfaction.
They check their products kindly and also do research for improving and
maintaining the quality of the product.
INTRODUCTION
 I have noted that UnifraxIndia Ltd. co. has been established in 1983. The
promoters of this unit is S.G.Rajgariya who has started this unit.
 This company was takeover three times still now. This company started 1983 by
S.G.Rajgariya after that this company took over by sent gobain at in 1999 from
S.G.Rajgariya and them this company took over by Unifrax Company. Which is in USA,
from sent gobain.
UNIFRAX India Limited is a leading producer of high temperature
ceramic fibre products for wide variety of industrial applications. Its
ISO 9001, 14001 and OHSAS 18001 accredited facility at Lakhtar,
Gujarat produces Refractory Ceramic Fibre products in all grades and
forms. We are part of UNIFRAX Corporation, a company with long
and respected heritage.
With manufacturing & sales presence in most of the world's major
industrial regions, and a leadership position in the global high
temperature fibres market, Unifrax offers its worldwide customers
high quality products, service and support that have become Unifrax
hallmark.
BRIEF HISTORY OF
ORGANIZATION
LAKHTAR PUNE
PLANT
Name of Organization Unifrax India Ltd.
Registered office & works UNIFRAX India Ltd.
99 km Stone,
Ahmedabad Surendranagar Highway,
Lakhtar-382775
Dist.Surendranagar, Gujarat
Promoter S.G.Ragariya
Year of establishment 1983
Form of organization Multinational company
Financial Year January – December
Authorized capital 5 lacks on one cheque
Banker SBI (Surendranagar & Lakhtar)
Auditor S R Batliboi & Co
No of employees 143
Weekly off Sunday
Product range FIBER
Main product FIBER
AGM Date 28/04/2011
GENERAL INFORMATION
Q.C.In charge
storesproductionaccountant
assistant
Or clerks
engineer
skilled
workers
Manager
owner
Owner : Mr.S.G.Rajgariya
Managers : P. Modi
Purchase Department : M.D.satvani
Production Department : S.B.Vyas
Stores Department : Dave Nareshbhai
Bonded Department : Renuka parmar
Marketing Department : Mr.savant
Accountant : Kalaniwalla & Mistry
Quality control in charge : H.H.shah Engineer
ORGANIZATION CHART
WORKING CAPITAL MANAGEMENT
Working capital = Current assets – Current liabilities
Net Working Capital = Current assets – Current Liability
Unifrax India ltd.’s working capital is shown in below.
2014: 190300000 - 44000000
= 146300000
2015: 295100000 - 91300000
= 203800000
FINANCIAL DEPARTMENT
RATIO ANALYSIS
INTRODUCTION
Financial analysis is the process identifying the financial strengthen and weakness
of the firm by properly established relationships between the item of the balance sheet
and profit and loss amount.
Ratio analysis is powerful tool to financial analysis. Ratio is defined as the
indicated quotient of two mathematical expressions and as the relationship two or more
thing
We have to calculate the ratio of the finance to know the financial strength of the
company.
That’s why I had taken different ratios to find out the Profitability, liquidity, and
solvency. On the basis of that we can know the better so for that I am doing a
comparative study of Financial Statement of year 2009 & 2010 of Unifrax India ltd.
•Gross Profit ratio
•Net Profit ratio
•Operating Profit Ratio
•Rate of Return On investment
•Rate of Return On Equity
Ratio analysis
INTRODUCTION
We have to calculate the ratio of the finance to know the financial strength of the
company. That’s why I had taken different ratios to find out the Profitability, liquidity, and
solvency. On the basis of that we can know the better so for that I am doing a
comparative study of Financial Statement of year 2014 & 2015 of Unifrax India ltd.
 Ratio analysis involves establishing a relevant financial relationship
between components of financial statement. Using a ratio analysis we can
easily conclude the position of industries. The ratio can be classified as follows.
•Profitability Ratio
•Liquidity Ratio
•Asset Turnover Ratio
•Finance Structure Ratio
•Valuation ratio
TYPES OF RATIO
•Profitability Ratio
•Gross Profit ratio
•Net Profit ratio
•Operating Profit Ratio
•Rate of Return On investment
•Rate of Return On Equity
[1] Gross Profit ratio
Formula :- Gross profit ratio= Gross profit *100
Sales
Year 2014 2015
G.P.Ratio 37.94 37.04
37.94
37.04
36.4
36.6
36.8
37
37.2
37.4
37.6
37.8
38
2014 2015
G.P.Ratio
[2] Net profit ratio
Formula:- Net profit *100
Sales
Year 2014 2015
N.P.Ratio 24.17 24.57
24.17
24.57
23.9
24
24.1
24.2
24.3
24.4
24.5
24.6
2014 2015
N.P.Ratio
3. LIQUIDITY RATIO
Liquidity ratio includes the followings ratio
•Current ratio
•Quick ratio
•Net working ratio
•Cash generated per rupee of sales
[1] Current ratio
Formula:- Curent ratio = Current Assets *100
Current liabilities
432.5
323.22
0
50
100
150
200
250
300
350
400
450
2014 2015
Curent.Ratio
[2] Quick ratio
Formula:- Quick ratio = Quick assets
Quick liabilities
Year 2014 2015
Quick.Ratio 342.27 248.52
342.27
248.52
0
50
100
150
200
250
300
350
2014 2015
Quick.Ratio
[3] Net working ratio
Formula:- Net working ratio = Total current assets
Total current liabilities
Year 2014 2015
N.W.C.Ratio 13.38 14.99
13.38
14.99
12.5
13
13.5
14
14.5
15
2014 2015
N.W.C.Ratio
Stock turnover ratio
• Stock Turnover Ratio = Cost of Goods Sold
Average Inventory
2012 2013 2014-15
0
1
2
3
4
5
6
7
8
9
10
6.3
8.4
9.2
hypothesis testing
Stock turnover ratio
Null hypothesis
H0 : stock turnover ratio can improve
Alternative hypothesis
H1 : stock turnover ratio can not improve
Applying Chi- Square test…
Year F0 Fe (F0- Fe) (Fo-Fe)2 (fo-fe)2/ fe
2010-11 6.3 7.97 -1.67 2.7889 0.3499
2011-12 8.4 7.97 0.43 0.1849 0.0233
2012-13 9.2 7.97 1.23 1.5129 0.1898
TOTAL 23.9 - - 0.5630
• Degree of freedom= n-1= 3-1=2
• Level of Significance = 5%
• Tabulated value = 5.9915
[4] ASSET TURNOVER RATIO
In is basically productivity ratio which measure the output produced from
the given input deployed. This include
•Total assets Turnover
•Net Fixed assets turnover
•Networking Capital TurnoverInventory turnover
•Debtors turnover
[3] Debtor ratio
Formula:- Debt ratio = Long term debt
Total capita employee
Year 2014 2015
DEBT Ratio 0 0
0 0
0
0.2
0.4
0.6
0.8
1
2014 2015
DEBT Ratio
CONCLUSION
The study on employee’s satisfaction at Unifrax India ltd is cased out with full co-
operation of the employees and management. As far as possible with in the given limits
the study is completed with the satisfaction of many peoples. The data collected are
analyzed scientifically and the results obtained are free to nearly 80%. It is assured that
the company may got high boosted moral in the organization provided some of the
suggestions made in the report in carried out.
WEBSITES:
•www.google.com
•www.unifraxindia.com.
•www.investopedia.com
•www.wikipedia.com
THANK YOU

Project presentation

  • 1.
    C.U.SHAH UNIVERSITY FACULTY OF PRESENTATIONON:- Ratio Analysis MANAGEMENT STUDIES Prepared by NAME EN.NO. VAGHELA DALSUKH .A 14MS501005 Guided by Mr. D.A.Sanghvi
  • 2.
    NO. PARTICULAR 1. INTRODUCTION GENERALINFORMATION 2. LITERATURE REVIEW 3. OBJECTIVE OF THE STUDY 4. RESEARCH STUDY DESIGN 5. ANALYSIS AND FINDING` 6. CONCLUSION 7. BIBIO GRAPHY INDEX
  • 3.
    Unifrax India ltd.co located at high way road in Lakhtar. It was established in 1983. Mr. S.G.Rajgariya is the promoter of this company. All the electrical accessories of this unit are certified by ISI mark. It means all the products are government valid. It has its own unique prestige. In this unit govt.have observed that most possible effort to motivate the worker has been done so that the workers become more talented and encourage working more efficiently. This effort has been done because they believe in human resource development.  I have observed the nature and thoughts of the owner of this unit. I remember that he has told me that there is only one power in this world which can motivate everything in this world; this power is only one Man Power. Manpower is everything for the owner of each industry. This though not only useful to develop the human relation among the employees. This unit is also very conscious about the customers’ problems. The mgt. Staff always remains alert to remove their customers’ problems and to give them satisfaction. They check their products kindly and also do research for improving and maintaining the quality of the product. INTRODUCTION
  • 4.
     I havenoted that UnifraxIndia Ltd. co. has been established in 1983. The promoters of this unit is S.G.Rajgariya who has started this unit.  This company was takeover three times still now. This company started 1983 by S.G.Rajgariya after that this company took over by sent gobain at in 1999 from S.G.Rajgariya and them this company took over by Unifrax Company. Which is in USA, from sent gobain. UNIFRAX India Limited is a leading producer of high temperature ceramic fibre products for wide variety of industrial applications. Its ISO 9001, 14001 and OHSAS 18001 accredited facility at Lakhtar, Gujarat produces Refractory Ceramic Fibre products in all grades and forms. We are part of UNIFRAX Corporation, a company with long and respected heritage. With manufacturing & sales presence in most of the world's major industrial regions, and a leadership position in the global high temperature fibres market, Unifrax offers its worldwide customers high quality products, service and support that have become Unifrax hallmark. BRIEF HISTORY OF ORGANIZATION
  • 5.
  • 6.
    Name of OrganizationUnifrax India Ltd. Registered office & works UNIFRAX India Ltd. 99 km Stone, Ahmedabad Surendranagar Highway, Lakhtar-382775 Dist.Surendranagar, Gujarat Promoter S.G.Ragariya Year of establishment 1983 Form of organization Multinational company Financial Year January – December Authorized capital 5 lacks on one cheque Banker SBI (Surendranagar & Lakhtar) Auditor S R Batliboi & Co No of employees 143 Weekly off Sunday Product range FIBER Main product FIBER AGM Date 28/04/2011 GENERAL INFORMATION
  • 7.
    Q.C.In charge storesproductionaccountant assistant Or clerks engineer skilled workers Manager owner Owner: Mr.S.G.Rajgariya Managers : P. Modi Purchase Department : M.D.satvani Production Department : S.B.Vyas Stores Department : Dave Nareshbhai Bonded Department : Renuka parmar Marketing Department : Mr.savant Accountant : Kalaniwalla & Mistry Quality control in charge : H.H.shah Engineer ORGANIZATION CHART
  • 8.
    WORKING CAPITAL MANAGEMENT Workingcapital = Current assets – Current liabilities Net Working Capital = Current assets – Current Liability Unifrax India ltd.’s working capital is shown in below. 2014: 190300000 - 44000000 = 146300000 2015: 295100000 - 91300000 = 203800000 FINANCIAL DEPARTMENT
  • 9.
    RATIO ANALYSIS INTRODUCTION Financial analysisis the process identifying the financial strengthen and weakness of the firm by properly established relationships between the item of the balance sheet and profit and loss amount. Ratio analysis is powerful tool to financial analysis. Ratio is defined as the indicated quotient of two mathematical expressions and as the relationship two or more thing We have to calculate the ratio of the finance to know the financial strength of the company. That’s why I had taken different ratios to find out the Profitability, liquidity, and solvency. On the basis of that we can know the better so for that I am doing a comparative study of Financial Statement of year 2009 & 2010 of Unifrax India ltd. •Gross Profit ratio •Net Profit ratio •Operating Profit Ratio •Rate of Return On investment •Rate of Return On Equity
  • 10.
    Ratio analysis INTRODUCTION We haveto calculate the ratio of the finance to know the financial strength of the company. That’s why I had taken different ratios to find out the Profitability, liquidity, and solvency. On the basis of that we can know the better so for that I am doing a comparative study of Financial Statement of year 2014 & 2015 of Unifrax India ltd.  Ratio analysis involves establishing a relevant financial relationship between components of financial statement. Using a ratio analysis we can easily conclude the position of industries. The ratio can be classified as follows. •Profitability Ratio •Liquidity Ratio •Asset Turnover Ratio •Finance Structure Ratio •Valuation ratio TYPES OF RATIO
  • 11.
    •Profitability Ratio •Gross Profitratio •Net Profit ratio •Operating Profit Ratio •Rate of Return On investment •Rate of Return On Equity
  • 12.
    [1] Gross Profitratio Formula :- Gross profit ratio= Gross profit *100 Sales Year 2014 2015 G.P.Ratio 37.94 37.04 37.94 37.04 36.4 36.6 36.8 37 37.2 37.4 37.6 37.8 38 2014 2015 G.P.Ratio
  • 13.
    [2] Net profitratio Formula:- Net profit *100 Sales Year 2014 2015 N.P.Ratio 24.17 24.57 24.17 24.57 23.9 24 24.1 24.2 24.3 24.4 24.5 24.6 2014 2015 N.P.Ratio
  • 14.
    3. LIQUIDITY RATIO Liquidityratio includes the followings ratio •Current ratio •Quick ratio •Net working ratio •Cash generated per rupee of sales
  • 15.
    [1] Current ratio Formula:-Curent ratio = Current Assets *100 Current liabilities 432.5 323.22 0 50 100 150 200 250 300 350 400 450 2014 2015 Curent.Ratio
  • 16.
    [2] Quick ratio Formula:-Quick ratio = Quick assets Quick liabilities Year 2014 2015 Quick.Ratio 342.27 248.52 342.27 248.52 0 50 100 150 200 250 300 350 2014 2015 Quick.Ratio
  • 17.
    [3] Net workingratio Formula:- Net working ratio = Total current assets Total current liabilities Year 2014 2015 N.W.C.Ratio 13.38 14.99 13.38 14.99 12.5 13 13.5 14 14.5 15 2014 2015 N.W.C.Ratio
  • 18.
    Stock turnover ratio •Stock Turnover Ratio = Cost of Goods Sold Average Inventory 2012 2013 2014-15 0 1 2 3 4 5 6 7 8 9 10 6.3 8.4 9.2
  • 19.
    hypothesis testing Stock turnoverratio Null hypothesis H0 : stock turnover ratio can improve Alternative hypothesis H1 : stock turnover ratio can not improve Applying Chi- Square test… Year F0 Fe (F0- Fe) (Fo-Fe)2 (fo-fe)2/ fe 2010-11 6.3 7.97 -1.67 2.7889 0.3499 2011-12 8.4 7.97 0.43 0.1849 0.0233 2012-13 9.2 7.97 1.23 1.5129 0.1898 TOTAL 23.9 - - 0.5630 • Degree of freedom= n-1= 3-1=2 • Level of Significance = 5% • Tabulated value = 5.9915
  • 20.
    [4] ASSET TURNOVERRATIO In is basically productivity ratio which measure the output produced from the given input deployed. This include •Total assets Turnover •Net Fixed assets turnover •Networking Capital TurnoverInventory turnover •Debtors turnover
  • 21.
    [3] Debtor ratio Formula:-Debt ratio = Long term debt Total capita employee Year 2014 2015 DEBT Ratio 0 0 0 0 0 0.2 0.4 0.6 0.8 1 2014 2015 DEBT Ratio
  • 22.
    CONCLUSION The study onemployee’s satisfaction at Unifrax India ltd is cased out with full co- operation of the employees and management. As far as possible with in the given limits the study is completed with the satisfaction of many peoples. The data collected are analyzed scientifically and the results obtained are free to nearly 80%. It is assured that the company may got high boosted moral in the organization provided some of the suggestions made in the report in carried out.
  • 23.
  • 24.