This document provides instructions for tracking project progress in Microsoft Project. It describes entering actual start and finish dates, percentages complete, durations, work, and costs to update the project schedule based on work completed. It also explains how to view variances between the baseline schedule and actual progress to determine if the project is on budget and on schedule. Key metrics like earned value are also covered to help analyze project performance.
MS Project - Lesson #1A - Basics of Project Scheduling - Part 1O.docxrosemarybdodson23141
MS Project - Lesson #1A - Basics of Project Scheduling - Part 1
Objectives - MS Project 2010
· Understanding Project Scheduling
· Introduction to Microsoft Project
· Working with Project Tasks
· Basic views, time scales and reports
Whether you are a project manager or not, project management techniques are extremely helpful in meeting goals and objects. Project management techniques define a path to a specified goal and then supervise the implementation.
MS Project can help you establish your initial plan as well as monitor progress. MS Project can quickly produce reports and other information that will help keep management, customers, and your project team informed. To get the most from MS Project, not only do you need to understand project management terminology, you also need to be familiar with the software itself. Therefore, do not attempt to quickly finish the lab, but take your time and read all instructions carefully.
Understanding Project Scheduling
A typical project is composed of tasks and resources. After tasks are identified, you organize the tasks in a logical hierarchy, also called a Work Breakdown Structure (WBS). Eventually, this sequence will show the interdependencies of each task. Then each task is given a duration. In MS Project, this can be in weeks, days, hours or minutes. You can also specify a milestone, which will represent an event that marks the completion of a group of related tasks.
To accomplish any task, you need resources. Resources can include people, equipment, material or special facilities necessary to complete a task. Resource availability and scheduling are important constraints to completing a task.
Once you establish a plan, complete with tasks and resources, you will often need to refine the plan before saving it as a baseline. The baseline is your guideline to help manage the project.
MS Project Basics
When you first start MS Project, a blank project file is displayed in Gantt Chart View. (If you need to open an existing MS Project file, the file extension is .mpp.) Let's take a look at the main window:
Select All
Entry Table
Task ID
Gantt Chart
Divider
View Bar
The above image is the default screen for MS Project 2010. The right side of the screen consists of the area for the Gantt Chart. The left side of the screen is the Entry table where tasks, durations, and other task information is entered. The Entry Table and Gantt Chart are separated by a moveable Divider
Pay particular attention to this layout. The Entry table is where we enter our tasks and durations. The Gantt chart will eventually show our tasks and durations in a graphical bar chart. The other part of significance is the divider. This allows you to show more or less of the Entry table/Gantt chart.
In Project 2010 the menu bar is set up into Ribbons. To access the various ribbons, Tabs are selected across the top of the menu bar. Within the ribbon the various sections are divided into groups:
.
SCM435 – Project Management MICROSOFT PROJECT ASSIGNMENT.docxbagotjesusa
SCM435 – Project Management
MICROSOFT PROJECT ASSIGNMENT (COMBINED)
THE PALMERS GOLF COURSE PROJECT
Project background
Palmers Golf Course is a two-year-old signature golf course based in Auckland, NZ. Being unique, the
number of memberships is increasing and putting strain on the existing information system.
The current system is used only by Accounts Department to process Accounts Payables and Receivables.
With the steep increase in the memberships, Bookings and Maintenance the Human Resource department is
getting overwhelmed with the paper work. Therefore, there is a need to add these functions to a new system.
You are the Project Leader for SoftSystems Ltd., which has been contracted by Palmers Golf Course to
undertake this project. You need to advise how to develop the new system in a tightly constrained time
period. Specifically, you have been advised that the project can start no earlier than Mon, January 4th 2016
and must be completed by Thu, May 19th 2016.
You report to Ms Smith, the Project Manager for SoftSystems Ltd, who liaises with Palmers Golf Course.
You will report your progress and plans of the project to Ms Smith.
Note: There is a lot of information included to provide context for what you will do in this assignment.
Please read carefully, and thoroughly to ensure the directions are followed. Also, to make it more clear, the
steps that you will perform in Microsoft Project are all written in the Courier New font.
Setting the Project Start Date
Click on the Project Tab in the Ribbon, and then go to Project
Information. Set the project start date to Mon, January 4th 2016. Do NOT
enter finish date. Click OK.
Setting default values
Set Current Date
The computer's internal clock initially determines the date listed in the Current Date text box.
To access the Current Date, click again on the Project Tab, then Project
Information.
The current date box appears. Changing this date box has several implications:
• The date determines the location of the dashed (current) date line on the Gantt chart timeline.
• The Current Date appears in the header of the Project Summary standard report. You can also display the
Current Date in headers or footers on other reports.
• You can use the Current Date to track the progress of the project, specifically to record the progress of all
tasks scheduled to be in progress or finished as of the date in the Current Date text box.
For this assignment, you will, initially, leave the Current Date as defined by the computer clock, please
check that it is correct.
Click OK, to close the Project Information box.
Click on File, then in Project Information, choose Advanced Properties,
then Summary tab and in the Title box type PALMERS GOLF COURSE. This names the
project, which will then appear on your printouts. You should also enter your name (Author) and other
optional data.
Set the Calendar
.
Construction Project Schedule Template- Residential BuildingSHAZEBALIKHAN1
The excel template is a ready-to-use project schedule for a residential building construction project. The article gives the basic idea of a project schedule for residential building construction. Download the excel file through the hyperlink in the article.
Learn MS Project Software Free PDF Download - Nice Presentation done by Bhadanis Quantity Surveying Institute Call 9990990844 or visit www.billingengineer.com
Project Priority MatrixProject NameProject Priority MatrixConstrainEnhanceAcceptScopeScheduleBudgetInstructions: Address the question of what is important to project success when Crashing is under consideration. Something has to give; either Scope, Schedule, or Budget. For each of Scope, Schedule, and Budget mark an X in only one of the three columns. Constrain means change is not allowed, Enhance means to improve if possible, and Accept means to allow change as necessary.
Risk ImpactProject NameRisk Impact MatrixConsequencesMajor Risk EventConsequenceLikelihoodImpact PotentialLowMediumHighA.LikelihoodHighB. MediumC. LowD. Instructions: See Chapter 7. These two charts address the four main risks to successful project conclusion.Instructions: Identify each major risk by its letter as to Likelihood of occurance and Consequence as a result.
Risk Response MatrixProject NameRisk Response MatrixMajor Risk EventWhat event would trigger the Risk?Risk Mitigation StrategyPerson ResponsibleA.B.C.D.Instructions: For each major risk to successful project completion, indicate how the problem will be addessed.
MS Project - Lesson #5 - Resource Workloads
Objectives
· View resource workloads
· Locate resource conflicts
· Use automatic leveling to resolve resource overallocations
· Manually resolve resource overallocations
When making resources assignments to tasks, MS Project tries to schedule the appropriate work for that resource; however conflicts can arise if a resource is scheduled to perform more work than the resource can accomplish. These conflicts can occur as a result of a single or multiple task assignment and are often a case of overallocation of the resource. (You can also underallocate a resource). The problem then becomes how to resolve those conflicts. With MS Project, some of these conflicts can be solved automatically or manually.
For this lab, we will be using the MS Project Lab, MyLab4_XXX (where XXX are your initials) from where we left off in Lab 4. Included with this lab is an Addendum, where you can quickly check your project information prior to starting this lab.
Viewing Resource Workloads
Viewing resource workloads helps to identify to what extent a resource is overallocated or underallocated. When a resource is overallocated, the resource text is highlighted in red and a leveling indicator is displayed.
To view the workloads:
1. Log onto Windows.
2. Open your completed file MyLab4_XXX.mpp. Check the addendum at the end of this lesson to make sure your beginning file is correct.
3. Save as MyLab5_XXX.mpp, where XXX are your initials
4. From the Task tab and the Resource Views group, select Resource Usage.
This view shows each resource, total assigned for the entire project, each task the resource is assigned and total hours for each task, and on the right, a time graph showing the detail of how the work is divided up. (You may need to expand the columns and move the time graph to see all details).
5. Noti ...
MS Project - Lesson #4 - Working With CalendarsObjectives - MS.docxrosemarybdodson23141
MS Project - Lesson #4 - Working With Calendars
Objectives - MS Project 2010
· Change the working and non-working time on Standard Calendar
· Change the working and non-working time on a Resource Calendar
· Create new base calendars
· Assign different base calendars to resources
With calendars, you can determine when resources on a project are working and when they are not working. If you do not indicate when resources are available, you may accidentally schedule tasks when resources are not actually available. Calendars are part of determining availability of resources.
In MS Project, calendars define the working and non-working time for the project and for each resource assigned to the task. As a change is made to a calendar, MS Project automatically reschedules all tasks affected by the change.
Using Calendars
There are two types of calendars in Project: base calendars and resource calendars. Base calendars define the working days and working hours for a project or a set of resources. Resource calendars define the working days and working hours for a specific resource.
The default base calendar (also known as the project calendar) is called Standard. This standard calendar is usually set as an 8-hour day, 40-hour week, Monday through Friday, with no holidays. However, you can modify this standard calendar, but it is not recommended. MS Project also comes with two other base calendars: a 24-hour calendar and a night shift calendar. You can also create your own base calendars. You can manipulate such options as default start time and hours per day.
Note: Resource calendars are updated automatically when the base calendar assigned to the resource changes. But changes to the default calendar options are not automatically displayed in the base calendar.
When we first set up this project, MS Project assumed the Standard calendar. As we entered task duration, MS Project calculated the amount of work based upon 8 hours a day, 40 hours per week, Monday through Friday. So when we entered 2 days for the task, Inventory Current Equipment, prior to any resource assignment, MS Project calculated 16 hours of work (8 hours per day), to start at 8 AM, Wednesday morning and concluding 5 PM, Thursday evening. When we assigned resources, each resource was by default also assigned a standard calendar. However, if the resource we assigned had a different working time, the same amount of work would have been calculated, but the actual time of duration would have changed.
Note: When you open dialog boxes that contain calendars, MS Project will also show the current day and month. Therefore you will need to scroll to the correct month for this project/lab.
To view the standard calendar options:
1. Log onto Windows.
2. Open your completed file MyLab3_XXX.mpp. Check the addendum at the end of this lesson to make sure your beginning file is correct.
3. Save as MyLab4_XXX.mpp, where XXX are your initials.
4. Make sure you are in Gantt cha.
CSCI 714 Software Project Planning and EstimationLec.docxmydrynan
*
CSCI 714: Software Project Planning and Estimation
Lecture 4B: Work Breakdown Structure
Gursimran Singh Walia
North Dakota State University
[email protected]
*
The Work Breakdown StructureA work breakdown structure (WBS) is an outcome-oriented analysis of the work involved in a project that defines the total scope of the projectIt is a foundation document in project management because it provides the basis for planning and managing project schedules, costs, and changes
Approaches to Developing WBSsUsing guidelines: Some organizations, like the DOD, provide guidelines for preparing WBSsThe analogy approach: It often helps to review WBSs of similar projectsThe top-down approach: Start with the largest items of the project and keep breaking them downThe bottoms-up approach: Start with the detailed tasks and roll them up
Basic Principles for Creating WBSs*
1. A unit of work should appear at only one place in the WBS.
3. A WBS item is the responsibility of only one individual, even though many people may be working on it.
4. The WBS must be consistent with the way in which work is actually going to be performed; it should serve the project team first and other purposes only if practical.
5. Project team members should be involved in developing the WBS to ensure consistency and buy-in.
6. Each WBS item must be documented to ensure accurate understanding of the scope of work included and not included in that item.
7. The WBS must be a flexible tool to accommodate inevitable changes while properly maintaining control of the work content in the project according to the scope statement. *Cleland, David I. Project Management: Strategic Design and Implementation, 1994
Good WBS Design PrinciplesThe 100% RuleThe WBS defines 100% of the work of the projectAnything that isn’t defined in the WBS is outside the scope of the project.The work content on any item is the sum of what is included under that work itemUpper Levels are Planned outcomes (deliverables), not planned actionsEnds of WBS include the activities needed to create the project deliverablesMutually-exclusive elementsWork should only appear in one place in the WBSWBS must be consistent with the way the project will be performed and controlledMust be easy to update
WBS RolePartition the major project deliverables into smaller components to improve the accuracy of cost estimatesProvide a mechanism for collecting actual costsProvide a mechanism for performance measurement and control
Why create a WBS?Cost EstimatingCost BudgetingResource PlanningRisk Management PlanningActivity Definition
SchedulingScheduling forces:Quantification of discrete effortPlacement of tasks in proper relationshipTwo most common scheduling methodologiesBar Charts (aka Gantt Charts)Critical Path Method (CPM) using Precedence Diagramming Method (PDM)
Bar / Gantt Charts Defined:Analyze and specify the basic approach in executionSegment into reasonable number of activitiesEstimate the time required.
How to change working days and time in MS Project?SHAZEBALIKHAN1
The article gives a detailed solution to set up the project calendar. Go through the article and you will be confident to set a date and time in MS Project. You will also get to know about the task usage and eight methods that are used in MS Project.
Melissa HinkhouseWeek 3-Original PostNURS 6050 Policy and A.docxwkyra78
Melissa Hinkhouse
Week 3-Original Post
NURS 6050: Policy and Advocacy for Improving Population Health
Walden University
In 2010 The Affordable Care Act (ACA) was enacted; the hope was to expand access to medical care, make coverage more affordable, and decrease the number of people without medical insurance. The Affordable Care Act (ACA) expanded and improved health insurance coverage in two primary ways. First, the number of individuals receiving insurance coverage grown by increasing access to coverage through Medicaid expansion and providing subsidies to purchase private insurance on the health care exchanges. Second, the ACA upgraded the quality and scope of coverage by improving benefit design, including implementing the essential health benefits (Willison & Singer, 2017). People who did not have coverage through their employer or Medicaid were required to purchase insurance through the Marketplace. The Marketplace was created as a one-stop-shop for people to view multiple plans and purchase insurance. Just because you have access to health care insurance does not mean you are going to receive quality health care (Teitelbaum, 2018).
Both parties have asked that the ACA be repealed or replaced for multiple reasons. Every Republican presidential candidate for 2016 has called for the repeal of the ACA. Some, but not all, Republican candidates have proposed health policies that they would like to put in place after repeal, but there is no broad agreement on a replacement for the ACA (Buettgens & Blumberg, 2016). The federal government would spend $90.9 billion less on health care for the nonelderly in 2021 if the ACA were repealed (Buettgens & Blumberg, 2016). State governments as a whole would spend $5.2 billion more on health care for the nonelderly in 2021 if the ACA were repealed (Buettgens & Blumberg, 2016). Healthcare is a priority to many Americans for obvious reasons; it was more costly for those with preexisting conditions before the ACA to obtain Medical Insurance. With the ACA the income guidelines for Medicaid where changed so additional people qualified that didn’t prior. As a Behavioral Health Nurse, I am a fan of anyone and everyone having access to Healthcare Services. I have seen to many times my patient not have the money for their medications because insurance was canceled so they go off their medications, they become unstable and ended up in the Emergency Department and admitted Inpatient, costing more money, hurting themselves and their loved ones.
Politicians are aware that election time is the best time to play the tug of war game with the heavy ticket items to capture someone votes. Republicans ran hard on promises to get rid of the law in every election since it passed in 2010. But when the GOP finally got control of the House, the Senate and the White House in 2017, Republicans found
they could not reach agreement
on how to "repeal and replace" the law (Kaiser Health News, 2018). And political strategists s.
Melissa Hinkhouse
Advanced Pharmacology NURS-6521N-43
Professor Dr. Vicki Gardin
Discussion Board Week 1-Original Post
11/30/2020
I have worked in an outpatient behavioral health clinic for the past seven years with many different providers. I live in a rural community, many patients wait six to twelve months to be seen. Patients being treated for Attention Deficit Disorder must be officially tested before being seen by a Psychologist. For this discussion board post, I have changed the name of my patient to Paul to ensure patient confidentially. The provider I worked with this particular patient will also be referred to as PMHNP to ensure provider confidentiality.
Paul was a ten-year-old Caucasian male referred to our clinic diagnosed per DSM criteria, confirmed via Psychologist testing with ADHD. When he saw the Psychologist, he was also diagnosed with mild depression and anxiety. He struggled with concentration, hyperactivity, impulse control, and disorganization. He presented to his appointment with his mother and father, clean, well-nourished, pleasant, interactive with staff, reported no medication allergies, current medication Zyrtec for seasonal allergies. Paul just had his well-child exam and is current on vaccinations and his primary care provider completed lab work to include CBC, CMP, TSH, Vit D, B12, and A1C, all have returned normal. Family history reported father has a history of ADHD (never medicated), brother has a history of depression and anxiety (never medicated treating with psychotherapy), no other significant family history to report. Paul’s current weight at his appointment was 30kg.
PMHNP spent one hour with Paul and his parents for the initial new patient appointment (Thursday). It was decided Paul would be prescribed Strattera (atomoxetine) 40mg once a day for one week then increase to 80mg once a day. I returned to work on Monday and received a call from Paul’s mom, she said he was acting strange. He was tearful, had been in his room with the door closed for most of the weekend, she stated on Sunday she went into his room and he was crying and said he was just thinking about dying and his parents dying. She stated he had already had his meds Sunday so she kept him with her that entire day and made Sunday night a campout night in the Livingroom so he would think it was fun and she could keep a close eye on him. I had a cancelation that morning for him to come to see PMHNP and he was in to see her within twenty minutes and removed from Strattera. His parents decided medications were no longer the route they wanted to try for treatment and a referral was made for psychotherapy.
The only medication Paul takes on occasion is Zyrtec which is in an antihistamine drug class, Strattera is a selective norepinephrine reuptake inhibitor; there is no known drug interaction between the two medications. Reflecting on his age and the medication, Strattera has a black box labeled for suicidal ideation with adolescents dia.
More Related Content
Similar to Project NameCommunication PlanOverviewEffective and .docx
Project Priority MatrixProject NameProject Priority MatrixConstrainEnhanceAcceptScopeScheduleBudgetInstructions: Address the question of what is important to project success when Crashing is under consideration. Something has to give; either Scope, Schedule, or Budget. For each of Scope, Schedule, and Budget mark an X in only one of the three columns. Constrain means change is not allowed, Enhance means to improve if possible, and Accept means to allow change as necessary.
Risk ImpactProject NameRisk Impact MatrixConsequencesMajor Risk EventConsequenceLikelihoodImpact PotentialLowMediumHighA.LikelihoodHighB. MediumC. LowD. Instructions: See Chapter 7. These two charts address the four main risks to successful project conclusion.Instructions: Identify each major risk by its letter as to Likelihood of occurance and Consequence as a result.
Risk Response MatrixProject NameRisk Response MatrixMajor Risk EventWhat event would trigger the Risk?Risk Mitigation StrategyPerson ResponsibleA.B.C.D.Instructions: For each major risk to successful project completion, indicate how the problem will be addessed.
MS Project - Lesson #5 - Resource Workloads
Objectives
· View resource workloads
· Locate resource conflicts
· Use automatic leveling to resolve resource overallocations
· Manually resolve resource overallocations
When making resources assignments to tasks, MS Project tries to schedule the appropriate work for that resource; however conflicts can arise if a resource is scheduled to perform more work than the resource can accomplish. These conflicts can occur as a result of a single or multiple task assignment and are often a case of overallocation of the resource. (You can also underallocate a resource). The problem then becomes how to resolve those conflicts. With MS Project, some of these conflicts can be solved automatically or manually.
For this lab, we will be using the MS Project Lab, MyLab4_XXX (where XXX are your initials) from where we left off in Lab 4. Included with this lab is an Addendum, where you can quickly check your project information prior to starting this lab.
Viewing Resource Workloads
Viewing resource workloads helps to identify to what extent a resource is overallocated or underallocated. When a resource is overallocated, the resource text is highlighted in red and a leveling indicator is displayed.
To view the workloads:
1. Log onto Windows.
2. Open your completed file MyLab4_XXX.mpp. Check the addendum at the end of this lesson to make sure your beginning file is correct.
3. Save as MyLab5_XXX.mpp, where XXX are your initials
4. From the Task tab and the Resource Views group, select Resource Usage.
This view shows each resource, total assigned for the entire project, each task the resource is assigned and total hours for each task, and on the right, a time graph showing the detail of how the work is divided up. (You may need to expand the columns and move the time graph to see all details).
5. Noti ...
MS Project - Lesson #4 - Working With CalendarsObjectives - MS.docxrosemarybdodson23141
MS Project - Lesson #4 - Working With Calendars
Objectives - MS Project 2010
· Change the working and non-working time on Standard Calendar
· Change the working and non-working time on a Resource Calendar
· Create new base calendars
· Assign different base calendars to resources
With calendars, you can determine when resources on a project are working and when they are not working. If you do not indicate when resources are available, you may accidentally schedule tasks when resources are not actually available. Calendars are part of determining availability of resources.
In MS Project, calendars define the working and non-working time for the project and for each resource assigned to the task. As a change is made to a calendar, MS Project automatically reschedules all tasks affected by the change.
Using Calendars
There are two types of calendars in Project: base calendars and resource calendars. Base calendars define the working days and working hours for a project or a set of resources. Resource calendars define the working days and working hours for a specific resource.
The default base calendar (also known as the project calendar) is called Standard. This standard calendar is usually set as an 8-hour day, 40-hour week, Monday through Friday, with no holidays. However, you can modify this standard calendar, but it is not recommended. MS Project also comes with two other base calendars: a 24-hour calendar and a night shift calendar. You can also create your own base calendars. You can manipulate such options as default start time and hours per day.
Note: Resource calendars are updated automatically when the base calendar assigned to the resource changes. But changes to the default calendar options are not automatically displayed in the base calendar.
When we first set up this project, MS Project assumed the Standard calendar. As we entered task duration, MS Project calculated the amount of work based upon 8 hours a day, 40 hours per week, Monday through Friday. So when we entered 2 days for the task, Inventory Current Equipment, prior to any resource assignment, MS Project calculated 16 hours of work (8 hours per day), to start at 8 AM, Wednesday morning and concluding 5 PM, Thursday evening. When we assigned resources, each resource was by default also assigned a standard calendar. However, if the resource we assigned had a different working time, the same amount of work would have been calculated, but the actual time of duration would have changed.
Note: When you open dialog boxes that contain calendars, MS Project will also show the current day and month. Therefore you will need to scroll to the correct month for this project/lab.
To view the standard calendar options:
1. Log onto Windows.
2. Open your completed file MyLab3_XXX.mpp. Check the addendum at the end of this lesson to make sure your beginning file is correct.
3. Save as MyLab4_XXX.mpp, where XXX are your initials.
4. Make sure you are in Gantt cha.
CSCI 714 Software Project Planning and EstimationLec.docxmydrynan
*
CSCI 714: Software Project Planning and Estimation
Lecture 4B: Work Breakdown Structure
Gursimran Singh Walia
North Dakota State University
[email protected]
*
The Work Breakdown StructureA work breakdown structure (WBS) is an outcome-oriented analysis of the work involved in a project that defines the total scope of the projectIt is a foundation document in project management because it provides the basis for planning and managing project schedules, costs, and changes
Approaches to Developing WBSsUsing guidelines: Some organizations, like the DOD, provide guidelines for preparing WBSsThe analogy approach: It often helps to review WBSs of similar projectsThe top-down approach: Start with the largest items of the project and keep breaking them downThe bottoms-up approach: Start with the detailed tasks and roll them up
Basic Principles for Creating WBSs*
1. A unit of work should appear at only one place in the WBS.
3. A WBS item is the responsibility of only one individual, even though many people may be working on it.
4. The WBS must be consistent with the way in which work is actually going to be performed; it should serve the project team first and other purposes only if practical.
5. Project team members should be involved in developing the WBS to ensure consistency and buy-in.
6. Each WBS item must be documented to ensure accurate understanding of the scope of work included and not included in that item.
7. The WBS must be a flexible tool to accommodate inevitable changes while properly maintaining control of the work content in the project according to the scope statement. *Cleland, David I. Project Management: Strategic Design and Implementation, 1994
Good WBS Design PrinciplesThe 100% RuleThe WBS defines 100% of the work of the projectAnything that isn’t defined in the WBS is outside the scope of the project.The work content on any item is the sum of what is included under that work itemUpper Levels are Planned outcomes (deliverables), not planned actionsEnds of WBS include the activities needed to create the project deliverablesMutually-exclusive elementsWork should only appear in one place in the WBSWBS must be consistent with the way the project will be performed and controlledMust be easy to update
WBS RolePartition the major project deliverables into smaller components to improve the accuracy of cost estimatesProvide a mechanism for collecting actual costsProvide a mechanism for performance measurement and control
Why create a WBS?Cost EstimatingCost BudgetingResource PlanningRisk Management PlanningActivity Definition
SchedulingScheduling forces:Quantification of discrete effortPlacement of tasks in proper relationshipTwo most common scheduling methodologiesBar Charts (aka Gantt Charts)Critical Path Method (CPM) using Precedence Diagramming Method (PDM)
Bar / Gantt Charts Defined:Analyze and specify the basic approach in executionSegment into reasonable number of activitiesEstimate the time required.
How to change working days and time in MS Project?SHAZEBALIKHAN1
The article gives a detailed solution to set up the project calendar. Go through the article and you will be confident to set a date and time in MS Project. You will also get to know about the task usage and eight methods that are used in MS Project.
Similar to Project NameCommunication PlanOverviewEffective and .docx (20)
Melissa HinkhouseWeek 3-Original PostNURS 6050 Policy and A.docxwkyra78
Melissa Hinkhouse
Week 3-Original Post
NURS 6050: Policy and Advocacy for Improving Population Health
Walden University
In 2010 The Affordable Care Act (ACA) was enacted; the hope was to expand access to medical care, make coverage more affordable, and decrease the number of people without medical insurance. The Affordable Care Act (ACA) expanded and improved health insurance coverage in two primary ways. First, the number of individuals receiving insurance coverage grown by increasing access to coverage through Medicaid expansion and providing subsidies to purchase private insurance on the health care exchanges. Second, the ACA upgraded the quality and scope of coverage by improving benefit design, including implementing the essential health benefits (Willison & Singer, 2017). People who did not have coverage through their employer or Medicaid were required to purchase insurance through the Marketplace. The Marketplace was created as a one-stop-shop for people to view multiple plans and purchase insurance. Just because you have access to health care insurance does not mean you are going to receive quality health care (Teitelbaum, 2018).
Both parties have asked that the ACA be repealed or replaced for multiple reasons. Every Republican presidential candidate for 2016 has called for the repeal of the ACA. Some, but not all, Republican candidates have proposed health policies that they would like to put in place after repeal, but there is no broad agreement on a replacement for the ACA (Buettgens & Blumberg, 2016). The federal government would spend $90.9 billion less on health care for the nonelderly in 2021 if the ACA were repealed (Buettgens & Blumberg, 2016). State governments as a whole would spend $5.2 billion more on health care for the nonelderly in 2021 if the ACA were repealed (Buettgens & Blumberg, 2016). Healthcare is a priority to many Americans for obvious reasons; it was more costly for those with preexisting conditions before the ACA to obtain Medical Insurance. With the ACA the income guidelines for Medicaid where changed so additional people qualified that didn’t prior. As a Behavioral Health Nurse, I am a fan of anyone and everyone having access to Healthcare Services. I have seen to many times my patient not have the money for their medications because insurance was canceled so they go off their medications, they become unstable and ended up in the Emergency Department and admitted Inpatient, costing more money, hurting themselves and their loved ones.
Politicians are aware that election time is the best time to play the tug of war game with the heavy ticket items to capture someone votes. Republicans ran hard on promises to get rid of the law in every election since it passed in 2010. But when the GOP finally got control of the House, the Senate and the White House in 2017, Republicans found
they could not reach agreement
on how to "repeal and replace" the law (Kaiser Health News, 2018). And political strategists s.
Melissa Hinkhouse
Advanced Pharmacology NURS-6521N-43
Professor Dr. Vicki Gardin
Discussion Board Week 1-Original Post
11/30/2020
I have worked in an outpatient behavioral health clinic for the past seven years with many different providers. I live in a rural community, many patients wait six to twelve months to be seen. Patients being treated for Attention Deficit Disorder must be officially tested before being seen by a Psychologist. For this discussion board post, I have changed the name of my patient to Paul to ensure patient confidentially. The provider I worked with this particular patient will also be referred to as PMHNP to ensure provider confidentiality.
Paul was a ten-year-old Caucasian male referred to our clinic diagnosed per DSM criteria, confirmed via Psychologist testing with ADHD. When he saw the Psychologist, he was also diagnosed with mild depression and anxiety. He struggled with concentration, hyperactivity, impulse control, and disorganization. He presented to his appointment with his mother and father, clean, well-nourished, pleasant, interactive with staff, reported no medication allergies, current medication Zyrtec for seasonal allergies. Paul just had his well-child exam and is current on vaccinations and his primary care provider completed lab work to include CBC, CMP, TSH, Vit D, B12, and A1C, all have returned normal. Family history reported father has a history of ADHD (never medicated), brother has a history of depression and anxiety (never medicated treating with psychotherapy), no other significant family history to report. Paul’s current weight at his appointment was 30kg.
PMHNP spent one hour with Paul and his parents for the initial new patient appointment (Thursday). It was decided Paul would be prescribed Strattera (atomoxetine) 40mg once a day for one week then increase to 80mg once a day. I returned to work on Monday and received a call from Paul’s mom, she said he was acting strange. He was tearful, had been in his room with the door closed for most of the weekend, she stated on Sunday she went into his room and he was crying and said he was just thinking about dying and his parents dying. She stated he had already had his meds Sunday so she kept him with her that entire day and made Sunday night a campout night in the Livingroom so he would think it was fun and she could keep a close eye on him. I had a cancelation that morning for him to come to see PMHNP and he was in to see her within twenty minutes and removed from Strattera. His parents decided medications were no longer the route they wanted to try for treatment and a referral was made for psychotherapy.
The only medication Paul takes on occasion is Zyrtec which is in an antihistamine drug class, Strattera is a selective norepinephrine reuptake inhibitor; there is no known drug interaction between the two medications. Reflecting on his age and the medication, Strattera has a black box labeled for suicidal ideation with adolescents dia.
Meiner, S. E., & Yeager, J. J. (2019). Chapter 17Chap.docxwkyra78
Meiner, S. E., & Yeager, J. J. (2019).
Chapter 17
Chapter_017.pptx
Chapter 18
Chapter_018.pptx
Chapter 19
Chapter_019.pptx
Chapter 20
Chapter_020.pptx
Watch
None.
Supplemental Materials & Resources
Visit the
CINAHL Complete
under the
A-to-Z Databases
on the
University Library's
website and locate the article(s) below:
O’Keefe-McCarthy, S. (2009). Technologically-mediated nursing care: The impact on moral agency. Nursing Ethics, 16(6), 76-796.
Teutsch, S., & Rechel, B. (2012). Ethics of resource allocation and rationing medical care in a time of fiscal restraint: US and Europe. Public Health Reviews, 34(1), 1-10.
QUESTION
Define presbycusis, name signs and symptoms, etiology and differential diagnosis.
Create 3 interventions-education measures with a patient with Presbycusis.
List, define and elaborate on three different retinal and macular diseases age-related.
Submission Instructions:
Your initial post should be at least 500 words, formatted and cited in current APA style with support from at least 2 academic sources
Your assignment will be graded according to the grading rubric.
.
member is a security software architect in a cloud service provider .docxwkyra78
member is a security software architect in a cloud service provider company, assigned to a project to provide the client with data integrity and confidentiality protections for data in transit that will be using applications in the cloud. Your client is an HR company that is moving HR applications and HR data into a community cloud, sharing tenancy with other clients. Your company has set up a software as a service, SAS, offering for its client base.
The data that the HR company will be pushing to and from the cloud will contain sensitive employee information, such as personally identifiable information, PII. You will have to address sensitive data and transit issues of the client data using the HR applications stored in the cloud, and provide a life cycle management report that includes solutions to the cloud computing architect of your company.
Software Development Life Cycle
Technology development and implementation usually follow a software development life cycle (SDLC) methodology. This approach ensures accuracy of information for analysis and decision making, as well as appropriate resources for effective technology management.
You and your team members will use components of the SDLC methodology to develop a
life cycle management report
for the cloud computing architect of a company. This is a group exercise, representing the kind of collaboration often required in the cybersecurity technology community.
There are 11 steps to lead you through this project. Similar steps are typically used in organizational SDLC projects. Most steps should take no more than two hours to complete, and the entire project should take no more than three weeks to complete. Begin with the workplace scenario, and then continue with Step 1: “Initiating the Project.”
Life Cycle Management Report:
A 10- to 15-page double-spaced Word document on data protection techniques for a cloud-based service with citations in APA format. The page count does not include figures or tables. There is no penalty for using additional pages if you need them. Include a minimum of six references. Include a reference list with the report.
As the cloud security architect, you must understand the security development life cycle process. Review the following resources to learn about the security development life cycle process:
security development life cycle
software development methodologies
Click the following links to learn more about critical infrastructure sectors:
Critical Infrastructure Sectors
. Read their descriptions and consider which sector you support in your role.
Process Control Systems: Cybersecurity and Defense
To be completed by a designated team member:
You will begin your Life Cycle Management Report now.
Choose a fictional or actual organization. Describe the mission of the organization and the business need to move to a cloud environment.
Identify the scope of the security architecture and include a topology. To narrow your scope, focus on is.
Melissa ShortridgeWeek 6COLLAPSEMy own attitude has ch.docxwkyra78
Melissa Shortridge
Week 6
COLLAPSE
My own attitude has changed from lack of understanding to enlightenment over the years. In elementary school I never experienced students with disabilities in my classrooms, growing up. But as the years went on and legislation changed students with disabilities started trickling into general education classrooms. They were always ignored by other students and often times had an aide to assist them with assignments. As an adult my heart has opened up to accept all types of people. In the Pennhurst documentary, it was reiterated, they are just people (Baldini, 1968). Which is my outlook on how to treat everyone. Every single person is a human being, treat them the way you wish to be treated. Everyone no matter their race, disability or socio-economic status deserves to be treated humanely.
As an educator I have worked with several different types of students. Students from low socio-economic areas, behavioral issues, vision impairments, hearing impairments, with autism, hyper activity and down syndrome, and with all of these students I have given them my best effort to show them that they are students first. Slavin and Schunk (2017) said it best, “Each student has many characteristics, and the disability is only one of them. To define the child in terms of the disability does him or her an injustice” (p. 235). It is our role as an educator to incorporate different learning styles to give each student, regardless of disabilities, the education that they deserve.
Welcoming students with disabilities into my classroom will be an important aspect in my role as an educator. Allowing each student to feel love and acceptance by peers is important for any students success. Van Brummelen (2009) states, “ It is important to appreciate students with special needs for who they are. Always look beyond their disabilities and teach them as whole persons” (p. 208). Being an advocate for my students with learning disabilities will garner them respect and dignity that they need to be self sufficient. In the Pennhurst documentary, the children did not have complete proper advocacy from the people that worked with them. They were simply shuffled along and not given the proper education and care that they needed to be self-sufficient (Baldini, 1968). “Defend the weak and the fatherless; uphold the cause of the poor and oppressed. Rescue the weak and the needy; deliver them from the hand of the wicked” (Psalm 82:3-4, New International Version). It is our Godly duty to defend individuals who can not defend themselves. In His eyes we are all created equal and in that we all deserve equal treatment and opportunities.
References
Baldini, B. (1968). Suffer the Little Children: Pennhurst Pennsylvania State Home for Disabled Children [Video file]. Retrieved from
https://youtu.be/YG33HvIKOgQ
Slavin, R.E., & Schunk D.H. (2017). Learning Theories: EDUC 500 (1st ed.) Boston, MA: Pearson.
Van Brummelen, H. (2009). Walking wit.
Melissa is a 15-year-old high school student. Over the last week.docxwkyra78
Melissa is a 15-year-old high school student. Over the last week, she had been feeling tired and found it difficult to stay awake in class. By the time the weekend had arrived, she developed a sore throat that made it difficult to eat and even drink. Melissa was too tired to get out of bed, and she said her head ached. On Monday morning, her mother took her to her doctor. Upon completing the physical exam, he told Melissa the lymph nodes were enlarged in her neck and she had a fever. He ordered blood tests and told Melissa he thought she had mononucleosis, a viral infection requiring much bed rest.
Innate and adaptive immune defenses work collectively in destroying invasive microorganisms. What is the interaction between macrophages and T lymphocytes during the presentation of antigen?
Melissa’s illness is caused by a virus. Where are type I interferons produced, and why are they important in combating viral infections?
Humoral immunity involves the activation of B lymphocytes and production of antibodies. What are the general mechanisms of action that make antibodies a key component of an immune response?
.
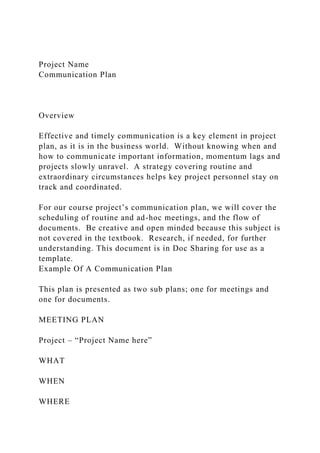
Measurement
of
the
angle
θ
For
better
understanding
I
am
showing
you
a
different
particle
track
diagram
bellow.
Where
at
point
C
particle
𝜋! 𝑎𝑛𝑑 Σ!
are
created
and
the
Σ!
decays
into
𝜋∓ 𝑎𝑛𝑑 K!
particles
The
angle
θ
between
the
π−
and
Σ−
momentum
vectors
can
be
determined
by
drawing
tangents
to
the
π−
and
Σ−
tracks
at
the
point
of
the
Σ−
decay.
We
can
then
measure
the
angle
between
the
tangents
using
a
protractor.
Alternative
method
which
does
not
require
a
protractor
is
also
possible.
Let
AC
and
BC
be
the
tangents
to
the
π−
and
Σ−
tracks
respectively.
Drop
a
perpendicular
(AB)
and
measure
the
distances
AB
and
BC.
The
ratio
AB/BC
gives
the
tangent
of
the
angle180◦−θ.
It
should
be
noted
that
only
some
of
the
time
will
the
angle
θ
exceed
90◦
as
shown
here.
Determining
the
uncertainty
of
Measurements
In
part
B,
It
is
asked
to
estimate
the
uncertainty
of
your
measurements
of
𝜃
and
r.
Uncertainty
of
measurement
is
the
doubt
that
exists
about
the
result
of
any
measurement.
You
might
think
that
well-‐made
rulers,
clocks
and
thermometers
should
be
trustworthy,
and
give
the
right
answers.
But
for
every
measurement
-‐
even
the
most
careful
-‐
there
is
always
a
margin
of
doubt.
It
is
important
not
to
confuse
the
terms
‘error’
and
‘uncertainty’.
Error
is
the
difference
between
the
measured
value
and
the
‘true
value’
of
the
thing
being
measured.
Uncertainty
is
a
quantification
of
the
doubt
about
the
measurement
result
Since
there
is
always
a
margin
of
doubt
about
any
measurement,
we
need
to
ask
‘How
big
is
the
margin?’
and
‘How
bad
is
the
doubt?’
Thus,
two
numbers
are
really
needed
in
order
to
quantify
an
uncertainty.
One
is
the
width
of
the
margin,
or
interval.
The
other
is
a
confidence
level,
and
states
how
sure
we
are
that
the
‘true
value’
is
within
that
margin.
You
can
increase
the
amount
of
information
you
get
from
your
measurements
by
taking
a
number
of
readings
and
carrying
out
Measurement of the angle θ For better understanding .docxwkyra78
Measurement of the angle θ
For better understanding I am showing you a different particle track diagram bellow. Where at
point C particle 𝜋 − 𝑎𝑛𝑑 Σ− are created and the Σ− decays into 𝜋 ∓ 𝑎𝑛𝑑 K− particles
The angle θ between the π− and Σ− momentum vectors can be determined by drawing tangents
to the π− and Σ− tracks at the point of the Σ− decay. We can then measure the angle between
the tangents using a protractor. Alternative method which does not require a protractor is also
possible. Let AC and BC be the tangents to the π− and Σ− tracks respectively. Drop a
perpendicular (AB) and measure the distances AB and BC. The ratio AB/BC gives the tangent of
the angle180◦−θ. It should be noted that only some of the time will the angle θ exceed 90◦ as
shown here.
Determining the uncertainty of Measurements
In part B, It is asked to estimate the uncertainty of your measurements of 𝜃 and r.
Uncertainty of measurement is the doubt that exists about the result of any measurement. You
might think that well-made rulers, clocks and thermometers should be trustworthy, and give
the right answers. But for every measurement - even the most careful - there is always a margin
of doubt.
It is important not to confuse the terms ‘error’ and ‘uncertainty’.
Error is the difference between the measured value and the ‘true value’ of the thing being
measured.
Uncertainty is a quantification of the doubt about the measurement result
Since there is always a margin of doubt about any measurement, we need to ask ‘How big is the
margin?’ and ‘How bad is the doubt?’ Thus, two numbers are really needed in order to quantify
an uncertainty. One is the width of the margin, or interval. The other is a confidence level, and
states how sure we are that the ‘true value’ is within that margin.
You can increase the amount of information you get from your measurements by taking a
number of readings and carrying out some basic statistical calculations. The two most
important statistical calculations are to find the average or arithmetic mean, and the standard
deviation for a set of numbers.
The ‘true’ value for the standard deviation can only be found from a very large (infinite) set of
readings. From a moderate number of values, only an estimate of the standard deviation can be
found. The symbol s is usually used for the estimated standard deviation.
Suppose you have a set of n readings. Start by finding the average:
For the set of readings x={16, 19, 18, 16, 17, 19, 20, 15, 17 and 13}, the average is �̅� =
∑ 𝑥𝑖
𝑛
=
17.
Next find (𝑥𝑖 − �̅�)
2
Then 𝑠 = √
(𝑥𝑖−�̅�)
2
𝑛−1
= 2.21
Lifetime calculation
In part C you are asked to determine the life time of the neutral particles from their
momentums.
The Σ− lifetime can be approximately determined using the measured values of the Σ− track
lengths. The average momentum of the Σ− particle can be found from its initial and fin
Meaning-Making Forum 2 (Week 5)Meaning-Making Forums 1-4 are thi.docxwkyra78
Meaning-Making Forum 2 (Week 5)
Meaning-Making Forums 1-4 are this course's unique final project.
Be fully engaged in Phase Two!
After reviewing the readings, presentations, lecture notes, articles, and web-engagements, and previous assignments, artificially move your predetermined careseeker (i.e., Crossroads’ Careseekers: Bruce, Joshua, Brody, Justin, or Melissa) through Phase Two.
NOTE: These research-based forums require that you draw upon ALL
of the course readings and learning activities to date, in order to substantively develop each phase in our
Solution
-based, Short-term, Pastoral Counseling (SbStPC) process. Noticeably support each core assertion.
Rapport and Relational Alignment.
Briefly discuss how you will continue to build rapport and shift your relational style in order to best align with the careseeker’s style (i.e., use DISC language) and current behavioral position (i.e., attending, blaming, or willing).
Phase Two Distinctive Features.
Narrate movement of careseeker through Phase Two’s distinctive features (i.e., purpose, goal, chief aim, role/responsibility, use of guiding assumptions) and apply pertinent insights and techniques from ALL the readings, previous assignments, and the Bible.
Supportive Feedback Break.
What portrait, definition(s), key thought(s), and/or assessment insight from the
Quick Reference Guide
might be utilized in the supportive feedback technique?
Phase Two Marker.
Describe a marker that indicates you have collaboratively ‘imagineered” a picture of life without the problem. In what way does this marker indicate the careseeker is in a willing position and ready for Phase Three?
Food for Thought:
When learning a new people skill or counseling technique, is it normal to “feel” awkward and fake? Use at least 1 example and thoughtfully explain how this “feeling” might be normalized.
TIPS:
Carefully Follow Meaning-Making Forum Guidelines & Tips!
Make sure to use headings (5) so that the most inattentive reader may easily follow your thoughts.
Use the annotated outline approach. Bullets should have concise, complete, well-developed sentences or paragraphs.
Foster a “noble-minded” climate for investigating claims through well-supported core assertions (i.e., consider the validation pattern of the Bereans; Acts 17:11).
Noticeably support assertions to facilitate further investigation and to avoid the appearance of plagiarism.
Since you have the required materials (e.g.,
Masterpiece)
, abridge any related citations (Nichols, p. 12) and do not list the required source in a References’ section.
Secondary sources must follow current APA guidelines for citations and References.
Make every effort to prove that you care about the subject matter by proofreading to eliminate grammar and spelling distractions.
A substantive thread (at least 450 words)
.
MBA6231 - 1.1 - project charter.docxProject Charter Pr.docxwkyra78
MBA6231 - 1.1 - project charter.docx
Project Charter
Project Charter
Student Name
Institution
Course Code
Project Title: Michael Joseph Place, The place to be
Project Start Date: 25/7/2018
Projected Finish Date: 25/12/2018
Budget Information: $ 4,500.00
Project Manager: Student name,[email protected], 210- 105 - 6676
Business Need
The project manager will be hosting an evening lounge event that will be targeting the clientele to an upscale lounge to be built in downtown. Through such an event the city will have a positive exposure.
There will be need for effective marketing, music, modern décor and most likely investors. The menu for food and drinks will need to be within budget. The venue needs to have amiable space and adequate seats for all guests.
The first step to this project involves coming up with a plan on a piece of paper. Once this is done the next step will involve selection of vendors to various goods and services. Once everything has been put to perspective the next stage will be to involve investors who will include local business owners. These investors will be encouraged to do so with the exchange for them to market and advertise their products at the event. We will have three packages for investors including Silver, Gold and Platinum packages.
Project Objectives
The proposal is to have a social entertainment evening lounge in Chicago. The project managers will be showcasing the new concept of entertainment by holding a series of events known as “The Place to be!”
· The events will be used to showcase the atmosphere that the new lounge will be offering
· The events will offer the professional audiences an opportunity to network while at the same time being entertained.
· The events will be targeting an audience of 150 attendants
· To have an environment where attendants can dance, dine and drink socially while discussing business.
Approach
This project will be managed in accordance with the PMI approach as modified.
Assumptions/Constraints/Dependencies
The assumption is that with the provision of an exquisite and upscale venue that is mature in Chicago, IL, will be successful due to the fact that there is no such a venue within a 100 mile radius.
One of the likely constraint is finding a venue that grabs attention of the targeted crowd.
The success of these events depends on attracting two sets of individuals. One of them is investors and the other is private professionals who will attend a social event at night.
Initial Risk Factors
· Obtaining a liquor license on time for the event is the major risk factor.
· Failure of attendees despite investing money and time is another risk.
· Failing to complete the organizational plans within 30 days before the event series begin.
· Not attracting any viable investors
Regulatory cost/impact
One of the needed licensing is from the city council where I will be required to get a special event license. This will enable us to have alcohol i.
Medication Errors Led to Disastrous Outcomes1. Search th.docxwkyra78
Medication Errors Led to Disastrous Outcomes
1. Search the internet and learn about the cases of nurses Julie Thao and Kimberly Hiatt.
2. List and discuss lessons that you and all healthcare professionals can learn from these two cases.
3. Describe how the principle of beneficence and the virtue of benevolence could be applied to these cases. Do you think the hospital administrators handled the situations legally and ethically?
4. In addition to benevolence, which other virtues exhibited by their colleagues might have helped Thao and Hiatt?
5. Discuss personal virtues that might be helpful to second victims themselves to navigate the grieving process.
.
Meet, call, Skype or Zoom with a retired athlete and interview himh.docxwkyra78
Meet, call, Skype or Zoom with a retired athlete and interview him/her about his or her transition experiences.
Please use this
interview guide
Actions
when conducting your interview.
Submit a minimum 400 word written reflection with the following:
Brief summary of the athlete's sport career transition
Main takeaways from the conversation
Advice you received and what you learned
Connection to course material
.
Medication Administration Make a list of the most common med.docxwkyra78
Medication Administration
Make a list of the most common medication administration errors and suggest steps that can be taken to prevent these errors.
APA format is required for this written assignment. This is a safe assign homework, no more that 20% of similarities permitted.
.
media portfolio”about chapter 1 to 15 from the book Ci.docxwkyra78
“media portfolio”
about chapter 1 to 15
from the book
Ciccarelli, S., & White, J. (2017).
Psychology
(5th Edition), Pearson.
which can include
newspaper,
magazine clippings
, and other media
that illustrate
psychological concepts covered in this course.
o
It is encouraged to be creative as possible and consider a wide variety of
sources which include: newspapers, magazines, editorials, advice and
medical columns, cartoons, etc. The sky is the l
imit!
o
A minimum of 15 clippings
should be included and should cover each
chapter
in the text book
(Chapters 1 through 15).
o
Each clipping should be explained by providing the source and how it is
related to a particular psychological concept, theory, or research finding
from the text or class lectures.
o
Sources should be in APA format!
Each “media clipping” should be on letter sized (8 ½ x 11) sized paper,
Paper can colored, etc...be creative!
.
Mediation
Name
AMU
Date
Mediation
Recently, I had a dispute with a friend based on sharing of roles and duties at work. If I were to use a mediation to solve the conflict I would have used facilitative mediation instead of evaluative mediation. Facilitative mediation refers to the types of solving conflicts where the mediator creates a process to assist the parties in reaching into a mutual agreement. Evaluative mediation on the other hand refers to the type of mediation where the judge helps the parties in reaching into a resolution through using the weakness of the case (Shrout & Bolger, 2017). The nature of the dispute plays a very huge role when choosing the type of mediation style to use. Since some cases can not fit well or makes it hard to find a solution when using a certain mediation style. For instance work related disputes and family related disputes require mediation that won’t seem to favor one party.
I would use transformative mediation, since it is mostly bases on improving the personal power of each party (Folberg & Taylor, 2016). Also transformative mediation mainly helps in creating a sense of understanding between the two parties through communication so as to solve the dispute. And lastly the reason why I would use the mediation is because; the process that is used does not favor one party. During the process, the mediator listens to both parties and from this he or she is able to help in making the two understand each other and be able to come into a mutual agreement.
References
Folberg, J., & Taylor, A. (2016). Mediation: A comprehensive guide to resolving conflicts without litigation.
Preacher, K. J., & Hayes, A. F. (2014). SPSS and SAS procedures for estimating indirect effects in simple mediation models. Behavior research methods, instruments, & computers, 36(4), 717-731.
Shrout, P. E., & Bolger, N. (2017). Mediation in experimental and nonexperimental studies: new procedures and recommendations. Psychological methods, 7(4), 422.
.
Media coverage influences the publics perception of the crimina.docxwkyra78
Media coverage influences the public's perception of the criminal justice system and the policy agendas of those within the system. This often results in changes within the operational structure of the police, courts, and corrections centers. These changes include the firing of employees, the initiation of internal investigations, and the privatization of services. Respond to the following questions, and support your positions using credible research:
Assignment Guidelines
Address the following in 1,250–1,750 words:
How is the criminal justice system portrayed in the media? Explain.
What impact do the media have on a viewer's perception as to the system's efficacy in dealing with crime? Explain.
Does coverage of sensationalistic and violent crime create fear among the general public? Explain.
Does this fear influence criminal justice policy attitudes? Explain in detail.
Is there a correlation between gender, education, income, age, and perceived neighborhood problems and police effectiveness in dealing with crime? Explain in detail.
In this assignment, external research is essential to successful submission. You must utilize at least 5–7 academic or scholarly external resources to support your arguments.
Be sure to reference all of your sources using APA style.
.
Media Content AnalysisPurpose Evaluate the quality and value of.docxwkyra78
Media Content Analysis
Purpose: Evaluate the quality and value of claims made and information presented by various authors.
Task: Write an essay in which you critically analyze at least 3 published commentaries/presentations related to an issue connected to social media. For each commentary/presentation, your analysis must include an evaluation of the evidence and reasoning presented as well as an examination of the value the commentary/presentation has for its intended audience and others. Compare and contrast various authors’ claims and perspectives.
Points: 200 (160 points from rubric-based assessment; 40 points for submitting a Reviewed Draft*).
Requirements:
Review a minimum of three substantive articles, videos, or presentations that have been published in major print or multimedia sources (e.g., a magazine article; a blog; a YouTube video),
Provide a brief, meaningful summary of each of the published presentations.
Analyze the quality of the claim, evidence, and reasoning in each presentation, with a focus on the validity and value of the presentations.
Use APA format – including in-text parenthetical citations along with a reference list at the end of the assignment.
Answer the following questions in your analysis:
What are the purpose, claims, evidence, and reasoning of each presentation?
What are the qualifications and authority of each author?
In what ways do the authors reflect bias? How do the authors account for their bias?
Are there any significant statements or omissions that might affect the reliability of the information or arguments presented?
Presentation Format:
1000 - 2,000 words
12 point, Times New Roman or Arial Font
Double-Spaced
APA format for body and References page
Follow the paragraph format below to be sure that you have covered all the requirements for the topic you have chosen:
Paragraph #1 1st article title, author and their qualifications along with a summary of it. 20 points
Paragraph #2 2nd article title/presentation, author and their qualifications along with a summary of it 20 points
Paragraph #3 3rd article title/presentation, author and their qualifications and of course a summary of it. 20 points
Paragraph #4 compare and contrast the purpose and the claims of each of the three authors 20 points
Paragraph #5 compare and contrast the evidence shown and the reasoning of each author/presentation 30 points
Paragraph #6 in what ways do the author's reflect bias/fallacies and how do they account for them? 20 points
Paragraph #7 Are there any significant statements or omissions that might affect the reliability of the
information or arguments presented? Which one drew your attention and why? 20 points
APA References alphabetized, double spaced and indented on t.
Mayan gods and goddesses are very much a part of this text. Their i.docxwkyra78
Mayan gods and goddesses are very much a part of this text. Their interactions with one another and later with humans form a major part of our reading. How are the gods and goddesses portrayed in this text? How are those portrayals similar to or different from other representations of gods we have encountered?
.
Media and SocietyIn 1,100 words, complete the followingAn.docxwkyra78
Media and Society
In 1,100 words, complete the following:
Analyze two ways that media affect culture and society. Identify at least one positive and one negative implication arising from technology’s effect on society.
Media has changed exponentially over the past 25 years with the introduction of the Internet and social media. How can people enhance their media literacy? Identify one to two challenges that media will introduce for society in the next 20-30 years and how people can use their media literacy to meet these challenges.
Prepare this assignment according to the guidelines found in the APA Style Guide, located in the Student Success Center. An abstract is not required.
This assignment uses a rubric. Please review the rubric prior to beginning the assignment to become familiar with the expectations for successful completion.
You are required to submit this assignment to LopesWrite. Refer to the
LopesWrite Technical Support articles
for assistance.
FOLLOW THE RUBRIC- CHECK YOUR FINAL PAPER WITH THE ATTACHED RUBRIC!
.
MBA 5110 – Business Organization and ManagementMidterm ExamAns.docxwkyra78
MBA 5110 – Business Organization and Management
Midterm Exam
Answer each of the following questions in this document, inserting your answers between each question. You may use your textbook and notes, but you may not consult with another individual. You may not use the Internet for assistance in answering these questions. Each question should be answered with a minimum of one paragraph, properly formatted according to APA 6th edition guidelines and referencing your textbook. Please list your textbook in a reference section at the end of this document. Submit this Word document with your answers to Moodle.
1. How have organizational structures and management styles changed over the past century?
2. Explain the concept of open and closed systems and how this relates to organization theory.
3. Define each of Porter’s Competitive Strategies and give an example of a company using each of these strategies.
4. Compare vertical and horizontal organizational structures in terms of effectiveness and adaptability in the rapidly changing business environment.
5. Choose one of the following theories and explain the theory. Give an example of a company that demonstrates the chosen theory and how the company uses the theory.
Theories: Chaos Theory, Resource-Dependence Theory, Population-Ecology Perspective, Contingency Theory, or Organizational Learning Theory
Response 1 PD
Question 1
A set of beliefs, norms and values that is shared by a group, culture is a systemic sense that can create a common commitment to an organization’s mission. With identifying markers that extend beyond the individual, it can be represented in a fabric of shared themes and feelings. Whether displayed in forms of dress, symbols, verbal phrases or typical behaviors, its permeance can be silent in its mode of action, yet quite visible to internal and external stakeholders (Daft, 2018).
Serving two fundamental and critical functions, the culture of an organization can be a catalyst in uniting members in how they relate to one another within the organization and how the members follow the same process in relation to the outside environment (Daft, 2018). However, although it is often associated with ethical decision making (Kara, Rojas-Mendez & Turan), the element of inequality can create fear and discourse if an unrealistic and bias culture themes are dictated, thus resulting in disagreement or conflict with management. Therefore, the perception of stakeholders or groups of interest regarding the cultural practices of the organization may not be entirely correct (Gonzalez-Rodriguez, Diaz-Fernández & Biagio, 2019).
Directly related to the perception of the value system of the organization and its management, the acceptable cultural differences that shape the internal behavior of members can have an impact in external relationships (Gonzalez-Rodriguez, Diaz-Fernández & Biagio, 2019). However, as Daft (2018) noted, a mechanistic or controlling system may block any organic input,.
The French Revolution, which began in 1789, was a period of radical social and political upheaval in France. It marked the decline of absolute monarchies, the rise of secular and democratic republics, and the eventual rise of Napoleon Bonaparte. This revolutionary period is crucial in understanding the transition from feudalism to modernity in Europe.
For more information, visit-www.vavaclasses.com
Ethnobotany and Ethnopharmacology:
Ethnobotany in herbal drug evaluation,
Impact of Ethnobotany in traditional medicine,
New development in herbals,
Bio-prospecting tools for drug discovery,
Role of Ethnopharmacology in drug evaluation,
Reverse Pharmacology.
Synthetic Fiber Construction in lab .pptxPavel ( NSTU)
Synthetic fiber production is a fascinating and complex field that blends chemistry, engineering, and environmental science. By understanding these aspects, students can gain a comprehensive view of synthetic fiber production, its impact on society and the environment, and the potential for future innovations. Synthetic fibers play a crucial role in modern society, impacting various aspects of daily life, industry, and the environment. ynthetic fibers are integral to modern life, offering a range of benefits from cost-effectiveness and versatility to innovative applications and performance characteristics. While they pose environmental challenges, ongoing research and development aim to create more sustainable and eco-friendly alternatives. Understanding the importance of synthetic fibers helps in appreciating their role in the economy, industry, and daily life, while also emphasizing the need for sustainable practices and innovation.
This is a presentation by Dada Robert in a Your Skill Boost masterclass organised by the Excellence Foundation for South Sudan (EFSS) on Saturday, the 25th and Sunday, the 26th of May 2024.
He discussed the concept of quality improvement, emphasizing its applicability to various aspects of life, including personal, project, and program improvements. He defined quality as doing the right thing at the right time in the right way to achieve the best possible results and discussed the concept of the "gap" between what we know and what we do, and how this gap represents the areas we need to improve. He explained the scientific approach to quality improvement, which involves systematic performance analysis, testing and learning, and implementing change ideas. He also highlighted the importance of client focus and a team approach to quality improvement.
Welcome to TechSoup New Member Orientation and Q&A (May 2024).pdfTechSoup
In this webinar you will learn how your organization can access TechSoup's wide variety of product discount and donation programs. From hardware to software, we'll give you a tour of the tools available to help your nonprofit with productivity, collaboration, financial management, donor tracking, security, and more.
Unit 8 - Information and Communication Technology (Paper I).pdfThiyagu K
This slides describes the basic concepts of ICT, basics of Email, Emerging Technology and Digital Initiatives in Education. This presentations aligns with the UGC Paper I syllabus.
How to Create Map Views in the Odoo 17 ERPCeline George
The map views are useful for providing a geographical representation of data. They allow users to visualize and analyze the data in a more intuitive manner.
How libraries can support authors with open access requirements for UKRI fund...
Project NameCommunication PlanOverviewEffective and .docx
1. Project Name
Communication Plan
Overview
Effective and timely communication is a key element in project
plan, as it is in the business world. Without knowing when and
how to communicate important information, momentum lags and
projects slowly unravel. A strategy covering routine and
extraordinary circumstances helps key project personnel stay on
track and coordinated.
For our course project’s communication plan, we will cover the
scheduling of routine and ad-hoc meetings, and the flow of
documents. Be creative and open minded because this subject is
not covered in the textbook. Research, if needed, for further
understanding. This document is in Doc Sharing for use as a
template.
Example Of A Communication Plan
This plan is presented as two sub plans; one for meetings and
one for documents.
MEETING PLAN
Project – “Project Name here”
WHAT
WHEN
WHERE
2. OWNER
ATTENDEES
Project Status Meetings
Ad-Hoc Meetings
Other – be specificDOCUMENT PLAN
Project – “Project Name here”
WHAT
DUE WHEN
METHOD OF DELIVERY
SENDER
RECEIVERS
Action Item Log
Meeting Agenda
Meeting Minutes
Other – be specific
Status Reports to Project Manager
Updates to Project Schedule
3. MS Project - Lesson #7 - Tracking Project Progress
Objectives - MS Project 2010
· Track the actual progress of tasks
· Updating a Project
· Compare baseline data to actual and scheduled data
· Viewing a Network Diagram
· Earned Value Overview
Once the project starts, it's time to begin tracking the actual
progress of tasks and resources. Tracking is the process of
gathering and entering task information into the schedule. You
can track progress by entering all or some of the actual
information.
In the previous lesson, we complete our scheduling and resource
assignments. For this lesson, we will assume our project is
underway and that several tasks have either finished or are
partially finished. We will then determine if our project is
behind or ahead of schedule.
Tracking Progress
Before we can begin tracking progress, the project schedule
should be fully developed and a baseline plan should be set.
Once work begins, progress should be tracked throughout the
project. The more often we update the information, the easier it
is to identify problems and take corrective action.
When actual information is entered, the project is automatically
recalculated. For this reason, task progress should be entered
starting at the top of the task list and continuing down the list.
There are three types of dates stored for each task:
Scheduled: Tasks that haven't started yet or are in progress.
4. Actual: Tasks that are in progress or are completed.
Baseline: Originally planned dates. These dates are used to
compare the original plan with the actual dates and scheduled
dates. Baseline dates do not change.
There are five types of actual data that can be entered in MS
Project:
Actual start and finish dates
Percentage completion
Actual duration and remaining duration
Actual and remaining work
Actual and remaining costs
Our project was scheduled to begin on October 9 2013 and end
on November 26, 2013. For the purposes of this lesson, we will
assume that it is now Monday, November 11, 2013 and the
project is underway
1. To ensure that all students are starting from the same
scheduling parameters, download the following file:
Lesson7Base.mpp. DO NOT use your project file from week 6.
2. Open the above file in MS Project. If you receive a
scheduling error select “Continue: Allow the scheduling
conflict” and then immediately…
3. Save as MyLab7_XXX.mpp, where XXX are your initials.
4. Under File > Project Information >Advanced Properties,
change the author's name and the manager's name to yourname.
5. Change the name of the main summary task (task #1) to
reflect your name.
5. 6. Once you have made those changes, make sure the file is
saved with abaseline! File > Project Information >Project
Statistics). If your file does not have a baseline then save one
(Project tab > Schedule > Set Baseline).
7. Finally, before continuing, under Project tab in the Status
group, select Status Date.
8. Change the Status Date to November 11, 2013. (Important:
You must do this every time you open this file!)
9. If you receive a Planning Wizard, allow the Scheduling
Conflict.
Entering Actual Dates
1. Select task 3, Inventory Current Equipment.
2. From the Task tab and the Schedule group click on the arrow
next to Mark on Track and select Update Tasks. The Update
Tasks dialog box appears:
Figure 1
Do Not Click on the “Mark on Track” as this will automatically
update the status as 100% complete. If you did this then use the
Undo button to roll back the change.
3. In the Actual area, click the Finish down arrow.
4. Select/Enter October 10, 2013 and click OK.
5. If the Planning Wizard appears, click the radial, "Continue.
Allow the scheduling conflict."
6. The actual finished date is entered and a checkmark is
displayed in the indicator field, and a progress bar is displayed
on the Gantt chart.
6. 7. Go back to the Task tab and the Schedule group click on the
arrow next to Mark on Track and select Update Tasks.
8. Notice the actual start date has been entered, the actual
duration was 2 days, the % complete is 100% and the remaining
duration is 0d. Click Cancel.
9. Position your mouse on the checkmark in the indicator field
and a tip box will open showing you when the task was
completed.
10. With completed tasks, you can either enter the actual
finished date or enter 100% complete or both!
Entering Actual and Remaining Durations
1. Select task #7, Research Products and Services.
2. From the Task tab and the Schedule group click on the arrow
next to Mark on Track and select Update Tasks
3. Click the Actual Duration up arrow until 2 days (2d) is
displayed.
4. Click the Remaining Duration down arrow until 2 days (2d) is
displayed. Click OK.
Figure 2
Figure 2 shows the completed Update Tasks window for task 7.
The duration is 3.5 days, the actual duration is 2 days and the
Remaining duration is also 2 days.
5. Still on task #7 Select UpdateTasks again.
6. Notice the actual start date is entered as October 24 and
7. percentage completion is 50%. (Note, since this task was
originally at 3.5 days, you have just added one-half day to the
duration. That is an additional 4 hours of work for each System
Analyst. Therefore you just added 8 hours of additional work to
your overall Project. The baseline, however, will still be at the
original 3.5 days. Obviously this task took longer than you
expected.
7. You will notice there is no icon in the task information
column, but if you look at your Gantt chart for this task, you
will see that the task is partially filled in with a black bar
(indicating progress).
8. With partially completed tasks, you can either enter the
actual duration with remaining duration or enter the percentage
completed. You can also enter any different start date than that
reflected. However to affect the change you must press OK.
Entering Percentage Completion
1. There is also a Tracking table and a Tracking toolbar that you
can also use to update task information.
2. On the View tab, in the Resource Views group, click on
Other Views then More Views…and then select Task Sheet.
Press Apply. (See figure 3).
Figure 3
3. Notice the Gantt chart has been removed from your view.
4. Still in the View tab, go to Tables in the Data group point to
Table and select Tracking.
5. Your table should look similar to Figure 4.
8. Figure 4
Figure 4 shows the Tracking Table. The columns are: Task
Name, Actual Start, Actual Finish, % Complete, Physical %
Complete, Actual Duration, Remaining Duration, Actual Cost
and Actual Work. Based on the status entered, the Actual Start
of the project is 10/9/2013, the % complete is 8%, actual
duration 2.95 days, remaining duration 34.55 days, the actual
cost $2,720 and the actual work 80 hours.
6. Go back to the Task tab. On the Schedule group you should
see:
Figure 5
Figure 5 is a screen capture of the schedule area of the ribbon.
It includes icons to update task completion by 0%, 25%, 75% or
100% complete.
7. Selecttask 4, Assess Current Department Needs, on the Task
table.
8. On the Tracking toolbar, click the 75% button. This will
complete 75% of the work.
9. The actual start date is entered as scheduled (October 10)
since the predecessor was completed on time. The actual and
remaining durations are updated as scheduled; 2.25 days has
been completed (75% of 3 days) and there is .75 days remaining
on the task. Your overall project completion percentage is 12%
and this phase of the project (Proposal Creation) is 33%
complete.
Note: using percentage completion data for tracking can be
somewhat subjective and should only be used when everyone
involved understands what the percentage means.
9. Entering Actual Work
Sometimes, you need to update or report actual work hours
performed on a task. There are times the work that you
projected for a resource or resources may be different than what
they actually performed.
1. From the Task tab and View group, click on Task Usage.
2. Your screen should now appear as in Figure 6. (You may
have to widen the task name column to see the entire task
name).
Figure 6
3. From the Format tab, in the Details group, check Actual
Work box.
4. Notice the Detailscolumn splits into two rows: Work and
Actual Work.
5. Go to task 7, Research Products and Services, and scroll, if
necessary, until you see the hours work for the System Analyst.
(See Figure 7).
Figure 7
6. In the row for Systems Analyst, select the cell with 16 hours
for Thursday (Oct 24) that is in the Actual Work row
(Act.Work). (DO NOT change the Work row!).
7. Change the 16 hours to 24 hours. If you receive a Planning
Wizard, Allow the Scheduling Conflict.
8. Note the icon that appears in the IndicatorColumn. This
indicates that the work assignment has been changed.
10. On your own, do the following:
1. Edit/track task 5, Design and Diagram New System, as 2 days
actual duration with remaining 3 days duration. (Hint: Do NOT
press OK…continue with next step…)
2. Edit task 5 for an actualstartdate of Tuesday, October 15,
2013. (Hint: Now, press OK.)
3. Edit/track task 6, Proposal to Accounting, as 50% completed.
4. For task6, Proposal to Accounting, indicate that the Project
Manager's actual work for Tuesday, October 22 from 11 to 7
hours.
5. At this point in time, the project team has also met for the
first 5 meetings. Show these meetings as being 100% complete.
Entering Changes in Fixed Costs
To enter changes to fixed costs, after you have begun a project,
do the following:
1. Change to Gantt chart view. From the View tab, in the Data
group point to Tables and select Cost.
2. Move the Gantt chart so you can see all the columns of this
table.
3. Go to task #14, Install Wiring.
4. In the Fixed Cost column, change $4,000 to $6,000
5. Notice the column Baseline still says $4,000, but the total
cost column says $6,000 for a variance of $2,000. (Note the
variance column).
11. Tracking actual costs, other than fixed costs, can only be done
after the task is completed or the remaining work is zero. In
our lesson, the only task that is completed is task #3. To
change that task's actual cost would require changing the details
of our task sheet to add cost information and then change that
information. For this lab, we will not be doing this.
(Note: MS Project automatically calculates actual costs, so you
must turn off this option to manually change actual costs.)
Comparing the Baseline to Actual Data
When we save our project with a baseline, we did so because we
need to have something to serve as a basis for comparing costs,
work and dates for task and resources. It is the only way we
can know if we are on-schedule, within budget, etc.
Project baselines and actual data can be viewed graphically in
charts or numerically in tables. The following describes the
tools in MS Project to analyze and compare baseline, actual and
scheduled data:
Tool
Type
Description
Tracking Gantt
Chart
Displays the actual and baseline information for tasks in a
graphical format
Variance
Table
Displays the difference between actual information and baseline
information
Work
Table
12. Displays the difference between actual and baseline work hours
Cost
Table
Displays the difference between actual and baseline costs
Cost Over budget
Task Filter
Displays all tasks with a cost greater than baseline cost
Slipping Tasks
Task Filter
Displays all tasks that are behind in schedule
Work Over budget
Resource Filter
Displays all resources with scheduled work greater than
baseline work.
You can quickly see overall progress by displaying project
statistics:
1. From the Project menu, click Project Information.
2. Click Statistics. Note: You may also use the icon on the
Tracking toolbar to display these statistics.
3. You should see the information as in figure 8. The Percent
Complete is for the entire project.
Figure 8
Or you can view the Tracking Gantt Chart:
1. From the View tab, select Tracking Gantt.
2. The Gantt chart now is displayed showing actual versus
baseline scheduling information.
13. 3. Another graphical representation of your project is the
Network Diagram. The Network Diagram view displays tasks
and task dependencies in a network or flowchart format. A box
(sometimes called a node) represents each task, and a line
connecting two boxes represents the dependency between the
two tasks. By default, the Network Diagram view displays one
diagonal line through a task that is in progress and crossed
diagonal lines through a completed task.
4. To see the Network Diagram, select Network Diagram from
the View tab. Your screen will look something like this:
5. You can change to zoom levels to see the more of the
diagram, but for now leave it at 100%.
6. MS Project’s Network Diagram is similar to a PERT chart.
You may want to view the legend on this diagram to see what
each shape and color means.
Understanding Earned Value
Another way to view information about the baseline are in
Earned Values. Earned value is a measure of cost of the work
performed up to a given date in a project. Earned value
information is based on three pieces of information. This
information is:
· Planned Value (PV) - This is the amount of budget planned to
be spent during a given period of time.
· Earned Value (EV) - This is a value indicating how much of
the budgeted cost should have been spent given the amount of
work actually completed.
14. · Actual Cost (AC) - This is the amount of money actually spent
on the completed work.
Knowing these numbers can help you understand if the task (or
project) is on, over or under cost and on, behind or ahead of
schedule, by calculating variances.
To calculate the cost variance (CV) the formula used is EV-AC.
A zero, "0", indicates the task (or project) is right on budget. A
negative number indicates the task (or project) is over budget
and a positive number indicates the task (or project) is under
budget.
Likewise to calculate a Schedule Variance (SV), the formula is
EV-PV. A zero, "0", indicates the task (or project) is right on
schedule. A negative number indicates the task (or project) is
behind schedule and a positive number indicates the task (or
project) is ahead of schedule.
The shortcut rule for variances is a negative number bad (over
budget or behind schedule) and a positive number is good
(under budget or ahead of schedule).
1. To see the Earned Value numbers in MS Project, first switch
back to the Gantt chart view and then from the View tab and the
Data group, select Tables then More Tables, from the list select
Earned Value. The PV, EV, AC and SV and CV are now
displayed.
2. Notice three other columns, EAC, BAC and VAC
a. EAC is "Estimated Cost at Completion". This is the new
forecast value of the final budget, based on current actual
values.
b. BAC, "Budgeted Cost at Completion" is the baseline value.
c. VAC, "Variance at Completion" is the difference between the
BAC and EAC (BAC-EAC). As with SV and CV, negative
15. numbers represent an over budget condition and positive
numbers represent below budget.
The project's current PV = $22,919.23. What do you think this
means? (NOTE: If your value is $0, then make sure you have
set the Status Date to 11/11/2013, per step 4, page 2.) If your
EV amounts do not match, then the status information has been
entered incorrectly.
It means that if we had worked according to the plan, we would
have completed $22,919.23 worth of budgeted work. What do
the EV and AC mean?
Note the positive VAC. As of this date, we expect our project
to be $1,710.01 under budget at completion.
There are 2 other values which can be calculated from the PV,
EV and AC. These are SPI (Schedule Performance Index) and
CPI (Cost Performance Index). These values are ratios and can
be used for trend data.
To calculate SPI, divide the EV by the PV (EV/PV=SPI). When
the SPI is at 1, the project (or task) is right on schedule, when
the SPI is less than 1, the project (task) is behind schedule and
when the SPI is greater than 1, the project (task) is ahead of
schedule.
To see the SPI values, again go to More Tables and this time,
select Earned Value Schedule Indicators.
Note the project has an SPI value of 0.31. This means the
project has completed 31% of scheduled work… or that for
every $1 worth of work scheduled, only $0.31 worth of
scheduled work has been completed. Do you know why this is?
Hint: Look for those tasks with negative SV's. Note the task
that has a particularly large SV.
16. The last value we are going to look at is the CPI or Cost
Performance Index.
To calculate CPI, divide the EV by the AC (EV/AC=SPI).
When the CPI is at 1, the project (or task) is right on budget,
when the CPI is less than 1, the project (task) is over budget
and when the CPI is greater than 1, the project (task) is below
budget.
To see the CPI values, again go to More Tables and this time,
select Earned Value Cost Indicators.
The Project's CPI is 1.05. This indicates the project is ahead of
schedule. For every $1, the project team completed $1.05 worth
of work. Not bad so far! See if you can identify the tasks that
helped the project to be under budget.
At this point:
1. Save your file
2. Printout the following reports: (use proper header/footer
information)
1. Project Summary
2. Overbudget Tasks
3. Earned Value
This concludes our survey of MS Project 2010. MS Project is a
great tool to help manage projects. It does take effort, but with
proper usage the effort will pay off with better project results.
There is much more to explore and learn. We hope this will
encourage you to explore more about the tool.
When submitting required printouts, if you are not bringing
them to class, from the Print Preview Page, take a screen shot
(in Windows <ALT><Prt Scr>) of the report and paste the
17. screen shot to a MS Word Document. Make sure to crop the
screen to show only the report. After cropping, resize the image
appropriately. If the printout is on more than 1 page, paste each
page individually. Save the Word document containing printouts
as Week_7_Printouts_XXX.docx (where XXX are your initials)
and submit this file to the Weekly iLab Dropbox.
When you have completed this lesson please save it as
MyLab7_xxx.mpp and submit the file to the Weekly iLab
Dropbox.
Also complete the following page and submit the Review
Question sheet to the Weekly iLab Dropbox.
Review Questions
Name ____________________________
Answer the following questions:
1) Why is it best not to enter a percentage (%) completion?
2) According to your Project Summary, is this project on
schedule? Will you be over or under budget and by how much?
3) After printing out the Earned Value report, define (you may
use MS Project help) the following terms and write in the Total
Values of each from your Earned Value Report (Make sure your
current date is properly set to 11/11/2013).
PV:
18. EV:
AC:
SV:
CV:
EAC:
BAC:
VAC:
Turn in this sheet with your MS Project file to the Week 7 iLab
Dropbox.
MS Project Lesson #7 Page 1
MS Project - Lesson #6 - Task Constraints and Baselines
Objectives - MS Project 2010
19. · Use constraints to set date limitations
· Set a project schedule baseline
A task constraint is a restriction or limitation that you or MS
Project set on the start or finish date of a task. During the
course of a project, limitations may have to be placed upon a
start or finish date of a task. For example, while you can start
doing your income taxes at any time, you must complete them
by April 15 (assuming you do not file for an extension). Do not
confuse task constraints with task dependencies. While you
may schedule two tasks to start at the same time (dependency),
you may not specify a certain starting date (constraint).
All tasks are assigned constraints. A constraint is either
flexible or inflexible. A flexible constraint is not tied to a
specific date; whereas an inflexible constraint is tied to a
specific date.
Task constraints can help create a more accurate schedule by
using detailed information to control start and finish dates of
important tasks. But they can restrict your flexibility in
scheduling. You should make sure that any constraint for a task
is necessary before assigning that constraint, particularly if the
task is part of the critical path.
For this lab, we will be using the MS Project Lab,
MyLab5_XXX (where XXX are your initials) from where we
left off in Lab 5. You may use your previous file or download
MyLab5_XXX.mpp from Doc Sharing.
Applying Flexible Constraints
The following table lists the flexible constraints and when they
are flexible:
20. Constraint
Description
Flexible for…
As Soon As Possible (ASAP)
Starts the task as soon as possible based on other constraints
and dependencies
All projects
As Late As Possible (ALAP)
Starts the task as late as possible based on other constraints and
dependencies
All projects
Finish No Earlier Than (FNET)
Finishes the task on or after an entered date
Projects scheduled based on a start date
Start No Earlier Than (SNET)
Starts the task on or after an entered date
Projects scheduled based on a start date
Finish No Later Than (FNLT)
Finishes the task on or before an entered date
Projects scheduled based on a finish date
Start No Later Than (SNLT)
Starts the task on or before an entered date
Projects scheduled based on a finish date
The As Soon As Possible constraint is the default constraint for
projects that are scheduled from a start date. Therefore, our
project's tasks all currently are assigned the ASAP constraint.
(If project is scheduled from a finish date, As Late As Possible
is the default constraint.)
1. Log onto Windows.
2. Open your completed file MyLab5_XXX.mpp. Check the
addendum at the end of this lesson to make sure your beginning
file is correct.
21. 3. Save as MyLab6_XXX.mpp, where XXX are your initials.
4. Make sure you are in Gantt chart view, with the Entry table
appearing.
5. Click on task #6, Proposal To Accounting.
6. Double click to open the Task Information dialog box.
7. Be sure that the General tab is selected and view the
currently scheduled start and finish dates for this task. (The
task is scheduled to begin on Monday, October 21 and finish on
Wednesday, October 23).
8. Click the Advanced tab.
9. Click the Constraint type down arrow and select Finish No
Earlier Than.
10. Click the Constraint date down arrow and select Wednesday,
October 23, 2013. (See Figure 1).
Figure 1
11. If the Effort Driven box is not checked, do so now and then
Click OK.
12. If you get a Planning Wizard, select “Continue. Allow the
scheduling conflict.”
13. The constraint is set for this task. We have said that this
task cannot finish prior to October 23, 2013 but can finish any
time beginning with October 23 (or later!).
14. You will notice beside the task, Proposal To Accounting, a
flexible constraint indicator icon. Notice that a similar icon is
next to the task, Install Software. What is its constraint? When
was this constraint applied? (Hint: these are the tasks we
22. manually leveled to avoid resource conflicts, MS Project helped
us in changing the constraint on one of these tasks to meet our
needs).
15. Save the file.
Applying Inflexible Constraints
Inflexible constraints are tied to a specific date and should be
used less often because they take flexibility away from the
schedule. Inflexible constraints are generally applied if the
project's start or finish date is absolute and beyond your
control. But be careful! The following table lists the inflexible
constraints and when they are inflexible:
Constraint
Description
Inflexible for…
Must Finish On (MFO)
Finishes task on an entered date
All projects
Must Start On (MSO)
Starts the task on an entered date
All projects
Finish No Earlier Than (FNET)
Finishes the task on or after an entered date
Projects scheduled based on a finish date
Start No Earlier Than (SNET)
Starts the task on or after an entered date
Projects scheduled based on a finish date
Finish No Later Than (FNLT)
Finishes the task on or before an entered date
Projects scheduled based on a start date
Start No Later Than (SNLT)
Starts the task on or before an entered date
Projects scheduled based on a start date
1. From the Gantt View, select the task, Issue RFPs. Open the
23. Task Information dialog box for this task.
2. Click the General tab and view the currently scheduled start
and finish dates for this task. The task is scheduled to begin
Monday, October 28 and finish on Tuesday, November 12,
2013.
3. Eleven days should be sufficient to issue and receive replies
to our Requests for Proposals. Although we should receive all
the responses by Tuesday, November 12, we do not want to wait
beyond Monday, November 11, 2013. Therefore, we are going
to mark this task with a Finish No Later Than constraint for
November 11.
4. Click the Advanced tab.
5. Click the Constraint Type down arrow and select Finish No
Later Than.
6. Click the Constraint Date down arrow and select Monday,
November 11, 2013. (See Figure 2.)
Figure 2
7. Click OK.
8. The Planning Wizard dialog box appears. (Figure 3)
Figure 3
9. The Planning Wizard indicates a possible conflict and offers
us three options. One, to just cancel the request. Another to
continue, but change to a better constraint. Or finally, to
continue with our original selection. Generally, you should
either cancel or accept the advice on how to avoid the conflict.
24. Only when absolutely necessary, continue with your selection;
however, it could possibly affect your project's finish date.
10. Select the “Continue. A Finish No Later Than constraint
will be set.” option, and click OK.
11. A Scheduling Conflict message may appear. Select
"Continue. Allow the scheduling conflict." and click OK.
12. The constraint is set. An inflexibleconstraint indicator icon
is displayed in the Indicated field. Note the "red" square versus
the “blue" square for a flexible constraint.
13. Please Note: MS Project will, by default, honor constraint
dates over scheduled dates unless you remove this default from
the Tools-Options menu, then select the Schedule tab and
uncheck Tasks Will Always Honor Their Constraint Dates.
Bottom line, it is best to wisely use constraints and preferably
flexible constraints.
14. Save your file.
When task constraints are set, conflicts can occur that can affect
the project finish date or a task dependency. When a conflict
occurs, the Planning Wizard appears, indicating a conflict (or a
potential conflict) will exist if the constraint is applied. The
Planning Wizard monitors scheduling activities and offers
suggestions when appropriate.
1. Click on the task, Evaluate Bids.
2. Open the Task Information dialog box for this task. Click the
General tab and note the start date for this task is Monday,
November 11, 2013, finish date is November 14, 2013.
3. Click the Advanced tab.
25. 4. Click the Constraint Type down arrow and select Must Start
On.
5. Click the Constraint Date down arrow and select Monday,
November 11, 2013.
6. Click OK.
7. The Planning Wizard dialog box appears again.
8. This time select the Cancel option. No constraint will be set
on "Evaluate Bids".
9. Save your file.
10. From the View tab select Tables from the Data group. Then
select More Tables. The More Tables dialog box opens.
11. Select Constraint Dates from the list and click Apply.
12. Move the Gantt chart to the far side of your screen. Widen
the table columns so all information can be seen.
13. Printthistable. Include all the columns of the Table:
Constraint Dates but NOT the Gantt chart. Be sure to include
proper project header information. Make sure you widen the
columns showing task information. This will be Printout 1.
14. Save the file.
Establishing a Baseline
Once the project schedule is completed and all resource and
task conflicts have been resolved, your current schedule
26. represents the best estimate of how the project should proceed
and what resources it will take. The emphasis is estimate.
When entering any type of project, regardless of experience, no
one knows exactly what will really happen; we can only give it
our "best guess".
Before the first task in the project begins, a baseline should be
set. (Notice we have always saved our project files without one
in the past.) A baseline is a record or "snapshot" taken of our
forecast or expectations. Without a baseline, we cannot
measure progress of a project. A baseline is useful for
comparing the planned schedule with later versions of the
schedule. A project baseline should be viewed also as a
learning tool. Comparing the baseline to actual progress on a
project can help you identify upcoming problems on the project
as well as helping future projects with better duration estimates
and more accurate resource assignments.
Think of a baseline as a forecast. If I predict that on my
vacation I will spend $400, I will make that my baseline or
prediction. At the end of my vacation, if I discovered that I
spent $450, I know that I was over budget (by $50) because I
had a baseline ($400) to compare to my actual progress ($450).
Note: Once you save a project with a baseline, any changes to
the baseline should not be made. However, if a baseline is
saved before the schedule planning is finished, a new baseline
can be saved over the existing baseline. If this is necessary,
you would access the Tools menu, point to tracking and then
click Save Baseline. This should only be done to reset a
baseline that was saved by accident.
We are now ready to save this project with a baseline. Read the
following instructions carefully, because once saving a project
with a baseline, it is difficult to undo any mistakes previously
made.
27. 1. First, save your current file asMyBaseline_XXX.mpp (where
XXX are your initials), without a baseline. This way, if you
made any mistakes, you can go back to MyLab5_XXX.mpp.
2. On the Project tab and the Schedule group select SetBaseline.
3. From the drop down select Set Baseline.
4. The Set Baseline window appears.
5. In the For area, be sure that the Entire Project option is
selected. Press OK.
6. Once you set a baseline, you can quickly monitor baseline
statistics for your project.
7. On the Project menu, click Project Information. In the
Project Information dialog box, click Statistics. The Project
Statistics window should appear.
Figure 4
8. The Project Statistics window will compare basic progress of
your project with your baseline. This information comprises
your Project Summary Report. (Notice that the fields for
baseline now contain information).
9. Close this window and save your file.
10. Print your ProjectSummaryReport, (from this file,
28. MyBaselineXXX.mpp). Make sure it has all appropriate
information. This will be Printout 2.
At this point, you have been introduced to the basics of project
scheduling and resource management. There is much more to
the software, but you should be encouraged to experiment and
discover on your own using on-line help or books on MS
Project.
Now that we have set a baseline for our project all that is left to
do is to implement our project and track our progress.
However, a little review before we do…
When submitting required printouts, if you are not bringing
them to class, from the Print Preview Page, take a screen shot
(in Windows <ALT><Prt Scr>) of the report and paste the
screen shot to a MS Word Document. Make sure to crop the
screen to show only the report. After cropping, resize the image
appropriately. If the printout is on more than 1 page, paste each
page individually. Save the Word document containing printouts
as Week_6_Printouts_XXX.docx (where XXX are your initials)
and submit this file to the Weekly iLab Dropbox.
Addendum
Task Information for the Beginning of Lesson 6
Project Information Statistics at the Beginning of Lesson 6
When you have completed this lesson please save it as
MyBaseline_XXX.mpp and submit the file to the Weekly iLab
Dropbox.
29. Also complete the following page and submit the Review
Question sheet to the Weekly iLab Dropbox.
Review Questions
Name ____________________________
Answer the following questions:
1) What is the difference between a task dependency and a task
constraint?
2) Give a real-world situation when you might used the
following task constraints:
a) Start No Earlier Than
b) Start No Later Than
c) Finish No Later Than
d) Finish No Earlier Than
e) Must Finish On
30. f) Must Start On
g) As Late As Possible
3) What is the importance of a baseline?
4) What is an interim plan?
Turn in this sheet with your MS Project file to the Week 6 iLab
Dropbox.
MS Project Lesson #6 Page 7