Downloaded 149 times


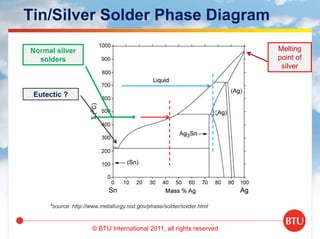


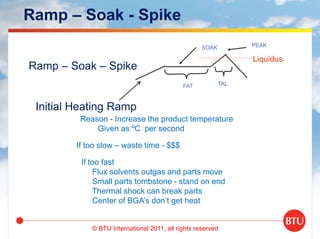


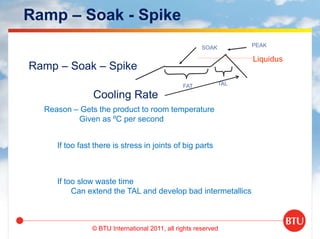


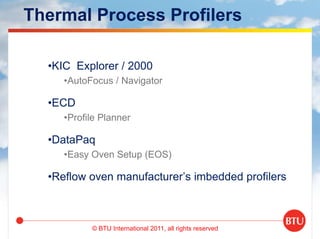


This document outlines the significance of thermal profiles in solder reflow processes, emphasizing the relationship between profiles and recipes, material properties, and factors affecting solder quality. It discusses key parameters such as peak temperatures, soak times, and cooling rates for eutectic and lead-free solders, as well as the necessary adjustments in oven settings. The presentation also explains the importance of accurate temperature measurements and profiling equipment to optimize the soldering process and ensure reliable joint formation.


