Downloaded 13 times
![Productivity measurement of the contract type listed as
number 1, is not significantly different in agile projects than in
traditional projects. In both approaches, the difficulty lies in
measuring all functional changes properly in order to measure
the actual project size.
The focus of this paper is on the contract type described
under number 2. A team is working for an indefinite period of
time, which is divided into sprints of 2, 3 or 4 weeks length each,
on a product backlog. The product backlog is prioritized in such
a way that the product backlog items (PBI’s) with the highest
importance are planned to be delivered first. The PBI’s are also
rated in story points, which are assigned in a team effort.
II. PRODUCTIVITY MEASUREMENT IN TRADITIONAL
SOFTWARE PROJECTS
Productivity measurement in traditional software
development projects is quite straightforward [1]. The customer
and the supplier have to agree on a few items beforehand, the
most important being:
Which (variant of which) size measurement method to
use;
Which performance metrics to use;
Which activities are in scope and which activities are
out of scope for the performance measurement;
Which are the benchmarks or targets to use per metric;
Who is measuring, who is reviewing, how to deal with
differences of opinion.
To give an example, let’s look at a performance
measurement contract that a government agency and a supplier
used to measure the performance in a specific Java development
project with an indicative size of around 400 Nesma [2] function
points (FP). The items above were addressed in the following
way:
Size measurement: Estimated Nesma [3] ;
Performance metrics:
o Productivity: PDR (h/FP);
o Functional Quality: Defects/FP Acceptance
Test + 1st month production;
o Delivery Speed: FP per calendar month.
Activities in scope: Technical design, Coding,
Programmer test, System test, Support acceptance test,
Project management, Quality assurance;
Activities out of scope: Functional design, delivery
management, acceptance test, implementation;
Benchmarks targets: A relevant subset from the ISBSG
repository New Developments & Enhancements [4]
(e.g. Java projects, Government, size between 300 and
500 FP)
o PDR: ISBSG subset median PDR;
o Defects/FP: ISBSG subset percentile 25%;
o Speed of deliver: ISBSG subset median PDR.
The supplier measures the functional size, the customer
reviews the size measurement. The metrics can be
audited by the customer periodically. Independent third
parties may be used to solve differences of opinion.
Because of the specific set of requirements and the fact that
the goal of the project is clear (to realize that specific set of
requirements), the performance measurement is pretty
straightforward. As it is a Java development project for a
government agency, it is easy to select a proper subset from the
ISBSG repository to set the targets and benchmarks for this
project. If there are specific non-functional requirements that are
expected to have a significant influence on the performance, the
benchmarks and targets may need to be re-evaluated and agreed
upon.
After the project has finished, the project size is determined,
the performance metrics are calculated and it becomes clear if
the performance targets are met or not..
III. WHY ARE AGILE PROJECTS DIFFERENT?
Most people in the software industry know the four main
principles of the agile manifesto [5]:
Individuals and interactions over processes and tools;
Working software over comprehensive documentation;
Customer collaboration over contract negotiation;
Responding to change over following a plan.
Although the items on the right of the word ‘over’ are still
important, the items on the left are considered more important.
In practice, an agile project can be described in the following
general way:
A very important role is played by the product owner, who
is a representative of the customer/user organization. This
product owner needs to be knowledgeable about the
functionality of the product and the business value it offers to
the users. Also, the product owner needs to have a mandate from
the customer organization to make decisions and he needs to be
committed to fulfill his role. This means that he is able to devote
the time needed to carry out his role, this means that he is able
to meet with the team when necessary, make decisions when
necessary and prioritize the backlog items by business value.
There is a product backlog available which lists the product
backlog items identified by the product owner. These backlog
items are either functional or non-functional by nature. The
effort needed to realize the product backlog items are estimated
by the team members using story points. Although many people
in the agile community think the story point measure is a size
measure, it is in fact an effort measure. It is a relative measure
which gives an estimate of how many hours the team thinks they
need to spend on a particular product backlog item, compared to](https://image.slidesharecdn.com/iwsmpaper2015vanheeringen-productivitymeasurementofagileteams-151008092915-lva1-app6891/75/Productivity-measurement-of-agile-teams-IWSM-2015-2-2048.jpg)
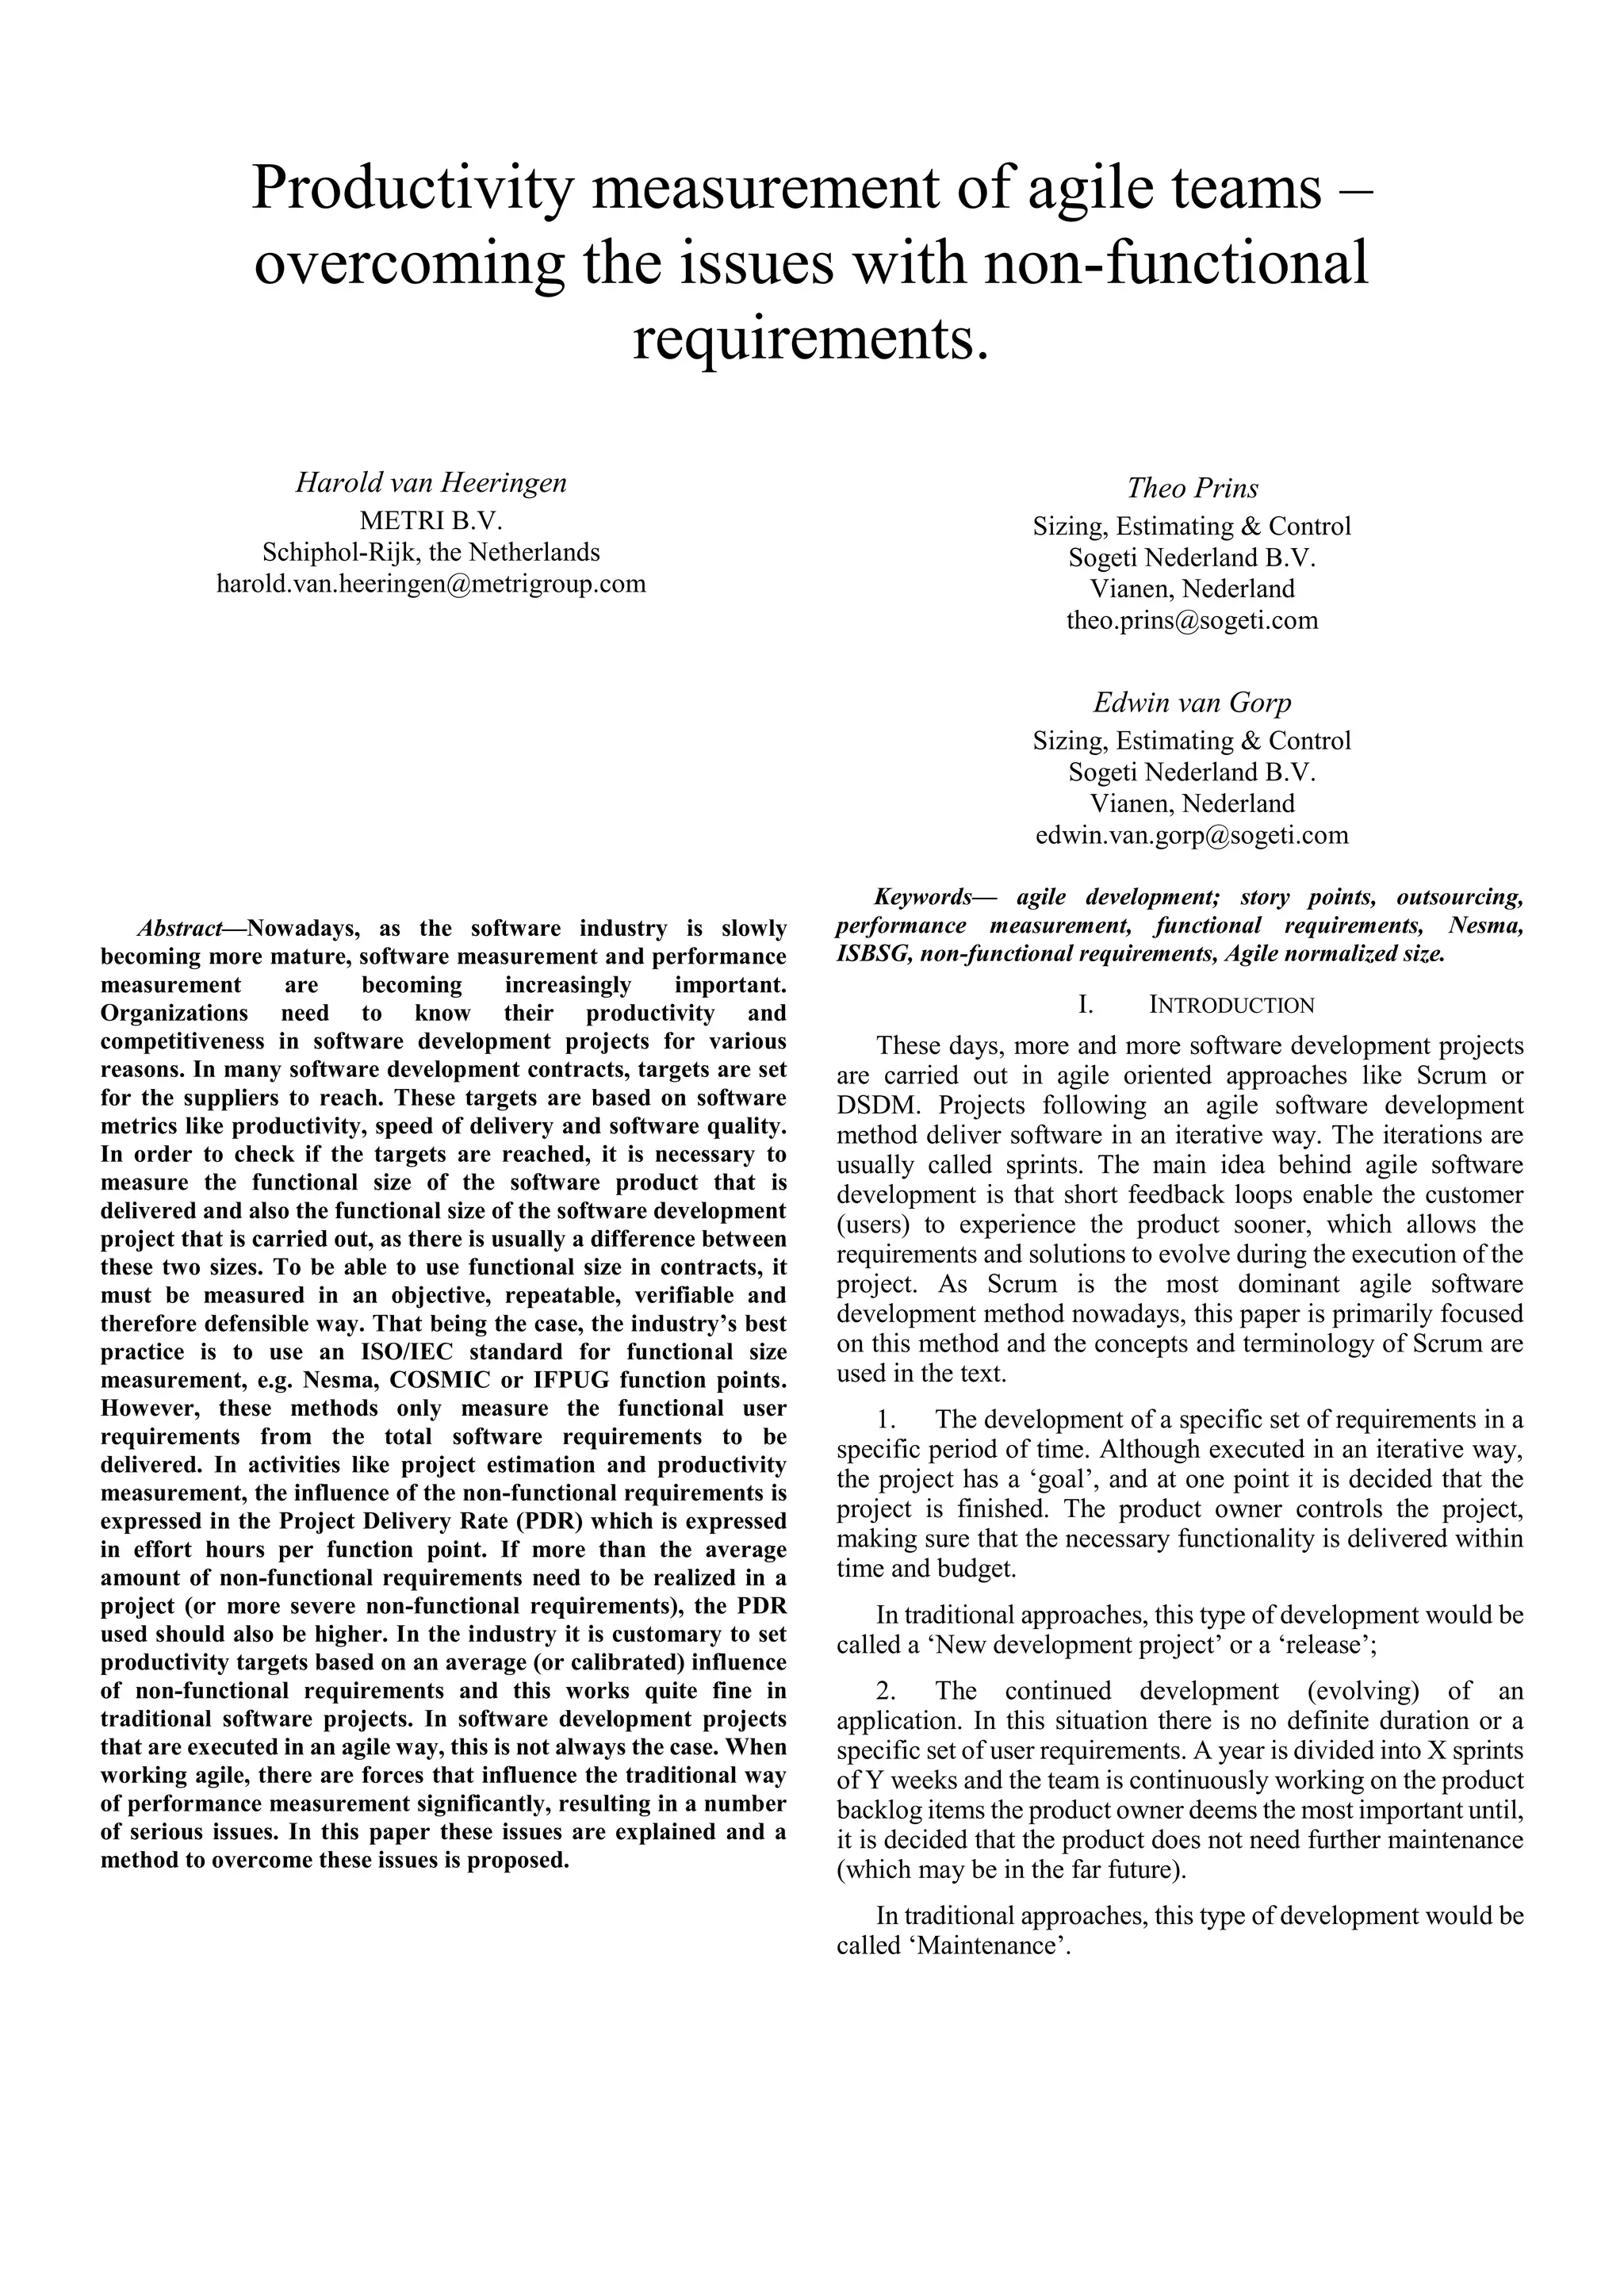
![Fig. 1. PDR actual vs. target
The productivity realized shows a very uneven view. In the
next paragraph a method is proposed that should give better
insight into the suppliers capabilities and performance.
An option to overcome the issues mentioned would be to
only use the effort hours spent on functional backlog items for
the performance measurement. In practice, it is very hard to
identify these effort hours. Furthermore, this approach makes it
easy to manipulate the performance measurement simply by
booking more hours on non-functional backlog items (assuming
that there is no control on the effort hours booked). Instead of
normalizing the effort hours to match the functional size, the
method proposed in this paper is to normalize the functional size
to match the total effort.
IV. PROPOSED METHOD
The performance measurement method that is proposed in
this paper is to normalize the functional size in order to
determine the functional size that the team could have realized
if they would not have been instructed to realize any non-
functional backlog items.
This method enables organizations to use the standard
methods and techniques for performance measurement and
benchmarking , while almost no extra data or effort is necessary.
The method is not totally objective, but possibilities of
manipulation (consciously or unconsciously) are very limited.
In order to carry out this normalization activity, one extra
activity needs to be performed. The Scrum team assigns story
points to the backlog items, so the number of story points that is
realized in a specific sprint is known. Of each of the sprint
backlog items, the team should decide if the nature of the item
is (mainly) functional or non-functional. The ratio between the
functional and the non-functional story points is used to
normalize the functional size.
Examples of functional backlog items could be: Add a field
to the database table ‘User’ named ‘twitter username’, add a
field to the ‘manage user’ screen in which the administrator can
enter the ‘twitter username’ and Add a twitter icon to the screen
if the user has a ‘twitter username, linking to user’s twitter page.
Examples of non-functional backlog items could be:
Improve the performance of the batch job in order to have it run
in under 2 hours, Improve the code quality of the application to
be to compliant to SQALE rating A [6] or Upgrade the
development environment to the next version, because the
supplier stops supporting the current version any time soon’
The proposed method contains the following steps:
1. Measure the functional size of the functional sprint
backlog items that were ready at the end of the sprint
using one of the mentioned ISO/IEC standards for
functional sizing;
2. Determine for all sprint backlog items that were ready
at the end of the sprint, if these were functional or non-
functional by nature. In case of a hybrid nature, try to
assess the ratio functional/non-functional;
3. Determine the number of story points that were
assigned to the functional backlog items that were
ready at the end of the sprint;
4. Determine the total number of story points that were
assigned to all backlog items that were ready at the end
of the sprint;
5. Calculate the Agile Normalized Size (ANS) using this
formula:
ANS = (functional size / functional story points) *
total story points
Example: In a sprint, five backlog items were realized (see
table 3). Three of them are functional by nature, the other two
non-functional. The functional size of the functional backlog
items is measured using Nesma function point analysis.
Sprint X Nature Nesma FP Story points
BLI 1 Functional 4 4
BLI 2 Non-functional 0 6
BLI 3 Non-functional 0 2
BLI 4 Functional 5 3
BLI 5 Functional 4 3
Total 13 18
Table 3
The ANS in this example is: (13 / 10) * 18 = 23,4 FP. The
ANS represents the equivalent of the functional size that could
have been realized if only functional backlog items would have
been included in the sprint.
0,0
20,0
40,0
60,0
80,0
100,0
120,0
140,0
160,0
3 4 5 6 7 8 9 10
PDR (h/FP) Target PDR (h/FP)](https://image.slidesharecdn.com/iwsmpaper2015vanheeringen-productivitymeasurementofagileteams-151008092915-lva1-app6891/75/Productivity-measurement-of-agile-teams-IWSM-2015-4-2048.jpg)
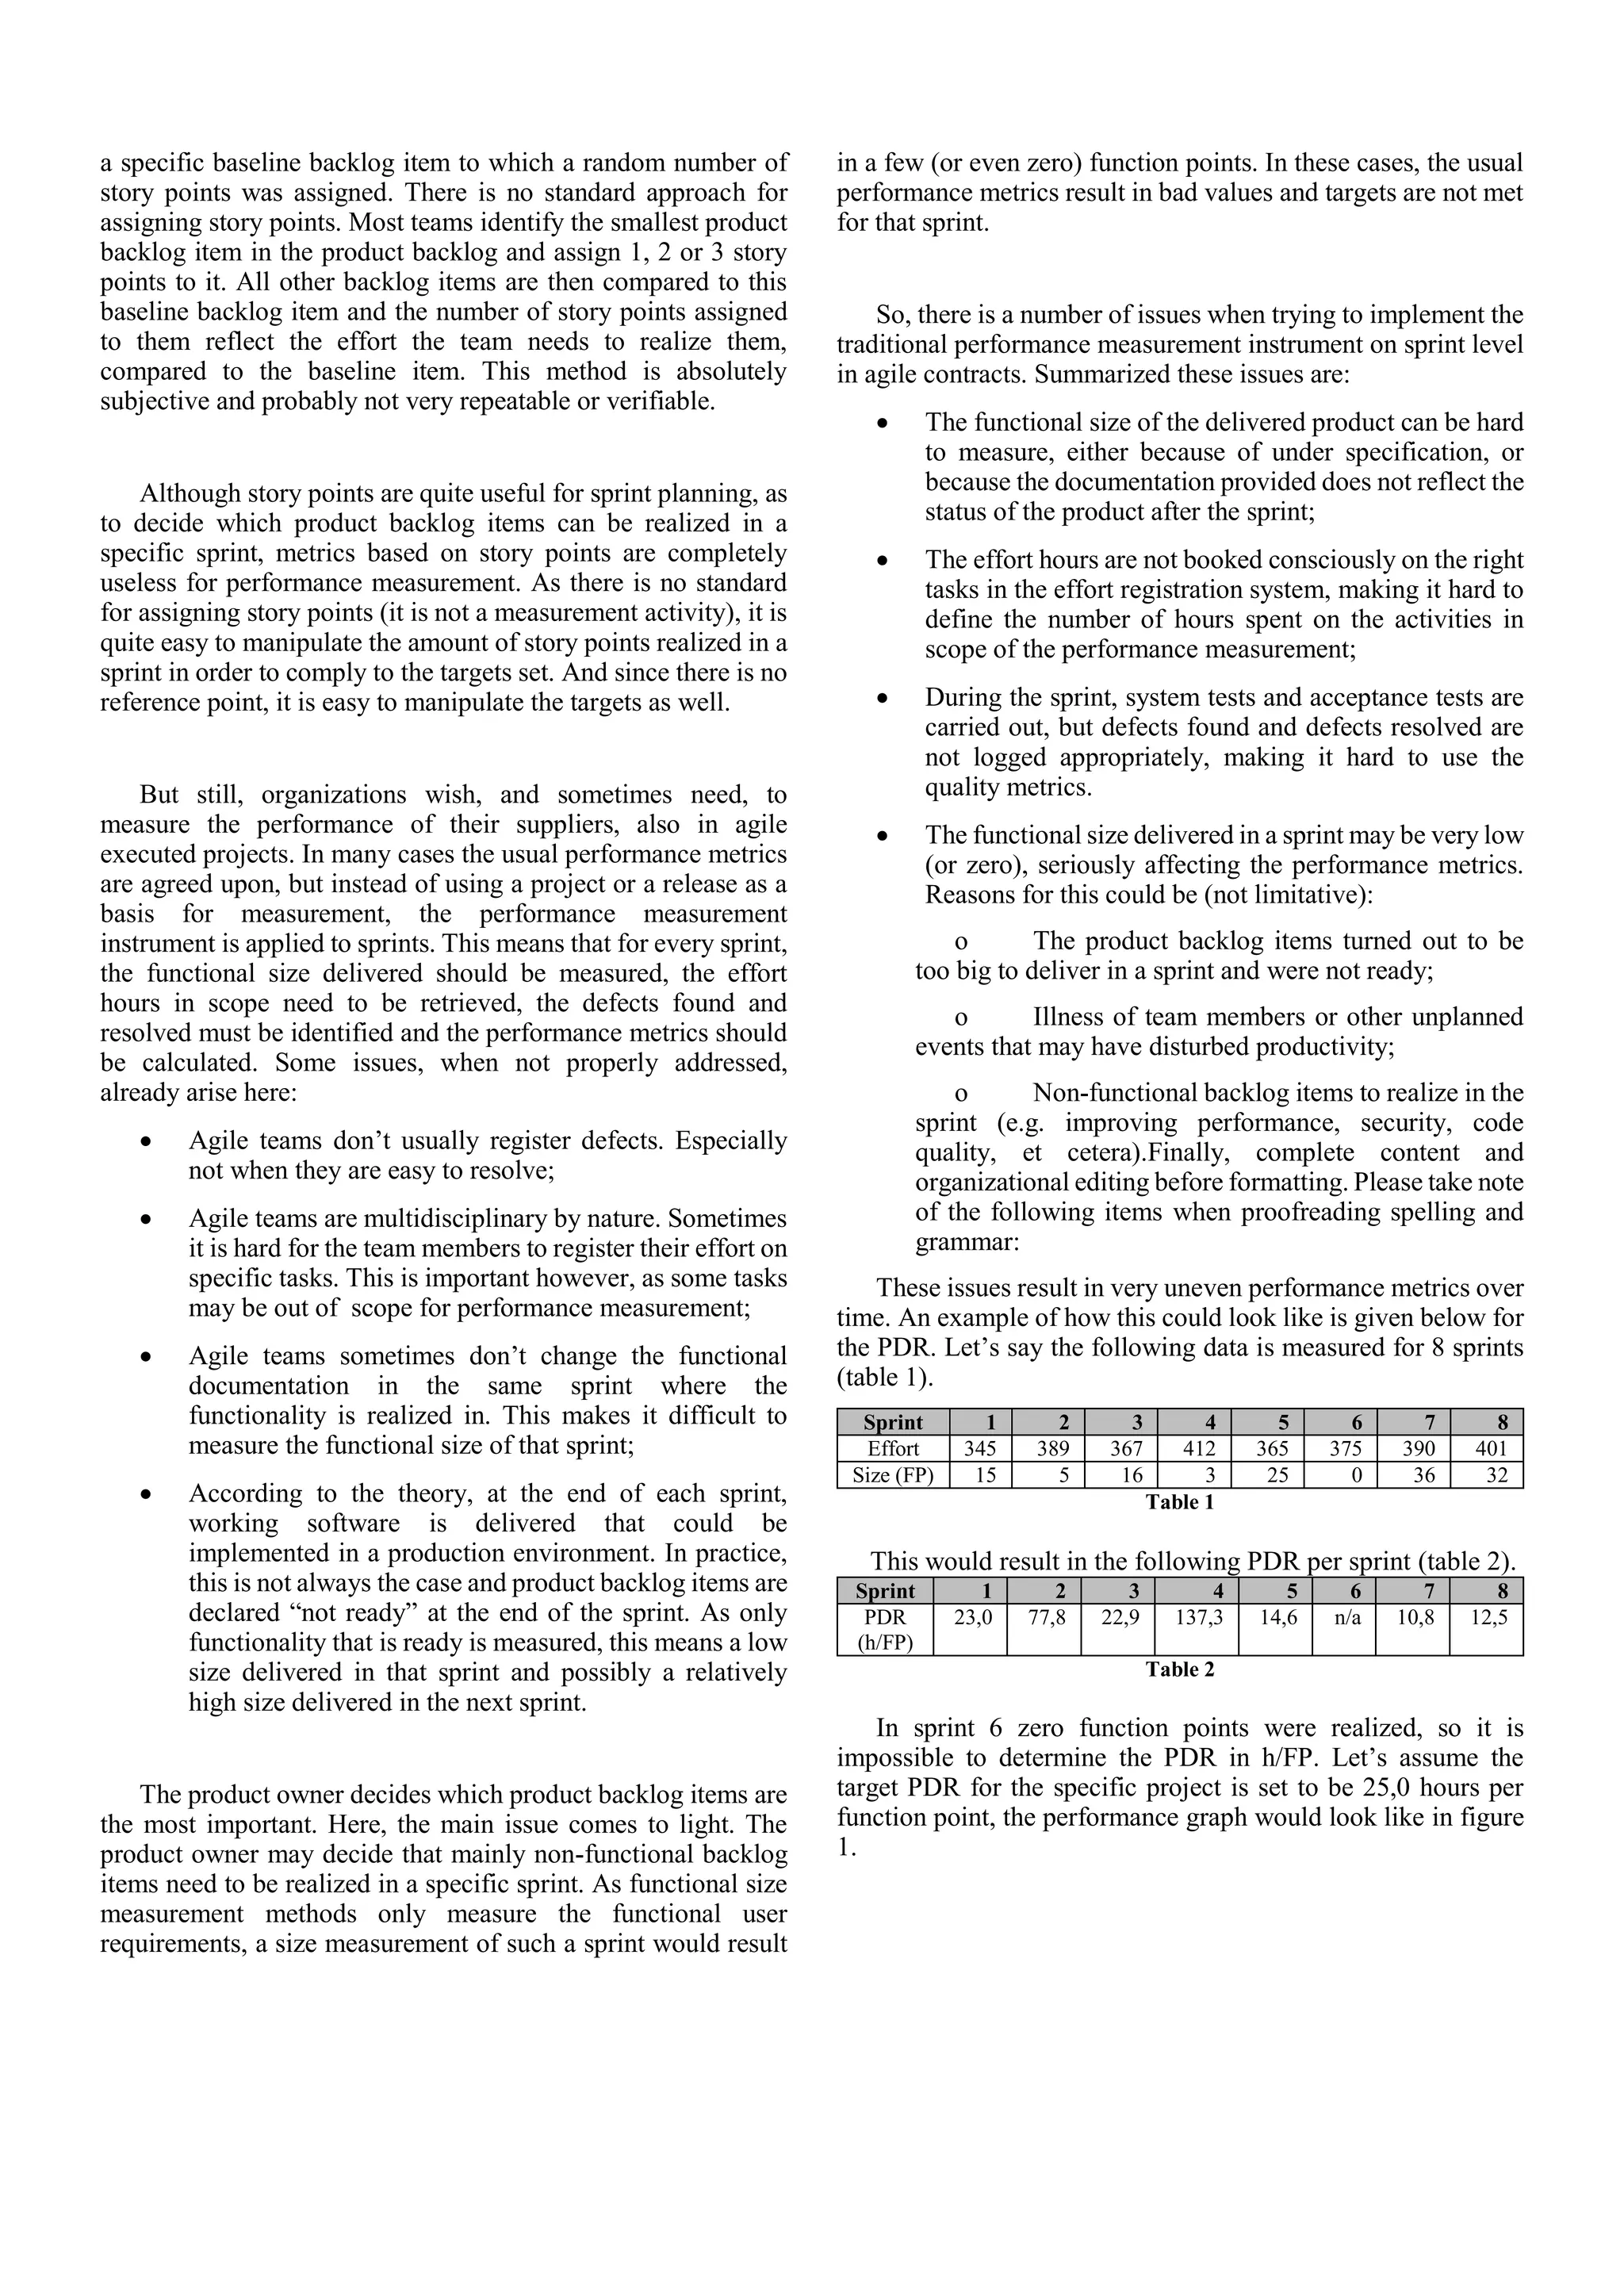
![Fig. 2. Hours/FP vs. Hours per nFP
V. THE PROGRESSIVE APPROACH
One of the aforementioned disadvantages of the proposed
method is that it’s not possible to determine the normalized size
for sprints in which no functional backlog items were realized.
This can be obviated by using the progressive approach.
The progressive approach divides the sum of the functional
sizes of all completed sprints by the sum of the functional story
points of these sprints. The result hereof is then multiplied with
the sum of all story points of all completed sprints. This
approach makes it possible to take sprints into account in which
no functional backlog items were realized. In table 6, the
example used earlier has been elaborated to explain the
progressive approach:
Sprint
Functionalsize(FP)
Functionalstorypoints
Non-functionalstorypoints
Totalstorypoints
Agilenormalizedsize(nFP)
Hours/nFP
Hoursspent(cumulative)
ANS(progressive)
Hours(cum)/nFP(progressive)
1 20 32 12 44 27,5 18,2 500 27,5 18,2
2 25 28 16 44 39,3 12,2 980 66 14,8
3 18 24 20 44 33 16,1 1.510 99 15,3
4 29 35 4 39 32,3 14,5 1.978 132,2 15
5 4 6 36 42 28 19,1 2.512 163,6 15,4
6 15 16 24 40 37,5 13,9 3.034 199,2 15,2
7 0 0 41 41 n/a n/a 3.546 231,4 15,3
8 18 24 20 44 33 15,4 4.054 264,3 15,3
Table 6
The productivity expressed in hours/nFP and the
productivity in hours (cum)/ nFP(progressive) can be
benchmarked against the traditional internal and external
hours/FP benchmarks, like for instance the ‘New Developments
and Enhancements repository of the International Software
Benchmarking Standards Group [4].
In the figure 3, the figures from the example are shown. The
benchmark PDR in this example is set on 20 hours/FP.
Fig. 3. The progressive apprach results
The main benefits of the proposed method are clearly
visible in sprints 5 (in which mainly non-functional backlog
items were realized) and 7 (in which only non-functional
backlog items were realized).
Starting points
In order to use the proposed method in the proper way, a
number of starting points have to be taken into account.
Effort administration
The effort hours need to be booked in the effort
administration in such a way that it is possible to
clearly identify the effort hours in scope and out of
scope of the performance measurement;
All effort hours spent on the project must be booked,
also overtime;
Hours spent on other projects should not be booked on
the project that is being measured;
The team members need to understand the importance
of an accurate and correct time administration.
Documentation
After each sprint the functional documentation should
be made up-to-date and it must be clear:
o Which functionality was added in the sprint;](https://image.slidesharecdn.com/iwsmpaper2015vanheeringen-productivitymeasurementofagileteams-151008092915-lva1-app6891/75/Productivity-measurement-of-agile-teams-IWSM-2015-6-2048.jpg)
![o Which functionality was changed in the sprint
and in which way;
o Which functionality was deleted in the sprint.
Size Measurement
The effort hours need to be booked in the effort
administration in such a way that it is possible to
clearly identify the effort hours in scope and out of
scope of the performance measurement
Product backlog and sprint backlog
The product backlog consists of functional and non-
functional backlog items. For each item it is known
which type it concerns;
All items have been assigned story points to in a
realistic way;
The product owner decides which product backlog
items will be placed on the sprint backlog of the
sprints;
After each sprint it is decided which backlog items are
ready (meet the definition of done1
) and which items
are not (or not completely);
Data collection
After each sprint, a data collection form (DCF) must be
filled in by the Scrum master. In this DCF at least the
following information must be filled in:
o the effort hours per activity;
o the backlog items declared ready and their
associated type;
o the story points assigned to these backlog
items.
Performance Measurement
The productivity is determined using the method
described above;
The functional size, the data and the results of the
productivity measurement is stored in a central
location;
Standard reports are created in which the productivity
measurement is shown and compared to predefined
internal and external benchmarks. Also trends in
productivity within the projects are reported.
VI. CONCLUSIONS
More and more organizations adopt agile software
development methodologies to deliver new functionality in a
faster way to their customer. In the meantime, in the slowly
maturing software industry, the need for productivity
measurement is becoming more and more important, especially
in outsourcing contracts. As long as the most important
objective of agile projects remains delivering new or changed
functionality, the traditional productivity measurement
instruments can still be used in an effective way. In projects, or
contracts, that are mainly about evolving a certain application,
without a specific end date or a specific scope, the productivity
is sometimes hard to measure in ISO/IEC standards for
functional size measurements. The influence of non-functional
requirements can really impact the productivity and the product
owner (customer) is the only one who can control this. Some
attempts have been made in the recent past to normalize the
effort hours in order to capture only effort hours that were spent
on functional user requirements. However, in practice it seems
impossible to do so. Instead, this paper proposes to normalize
the functional size in such a way that the functional size is
calculated that could have been realized in a sprint if the product
owner only put functional backlog items on the sprint backlog.
Whether this method really is going to solve all the issues in
productivity measurement of agile projects still has to be
proven.
REFERENCES
[1] Bundshuh, M. and Dekkers, C, The IT Measurement Compendium,
Estimating and benchmarking success with functional size measurement,
page 313, Spinger, ISBN: 978-3-540-68187-8
[2] NESMA: ISO/IEC 24570:2005 Software engineering - NESMA function
size measurement method version 2.1 - Definitions and counting
guidelines for the application of Function Point Analysis, ISBN: 978-90-
76258-19-5
[3] Early Function Point Counting, http://nesma.org/themes/sizing/function-
point-analysis/early-function-point-counting/
[4] International Software Benchmarking Standards Group (ISBSG) New
Developments & enhancements R13, released February 22015,
www.isbsg.org
[5] Beck, Kent et al. (2001). "Manifesto for Agile Software Development".
Agile Alliance. Retrieved 14 June 2010
[6] Letouzey, J-L, The SQALE Method for Evaluating Technical Debt,
proceedings of the 3rd
international workshop on managing technical debt
(ICSE 2012), Zurich (Switzerland) june 9-12 2012.
1
The Definition of done is determined before the start of an
agile project. Only if all characteristics of that definition have
been met, the item is considered ‘ready’.](https://image.slidesharecdn.com/iwsmpaper2015vanheeringen-productivitymeasurementofagileteams-151008092915-lva1-app6891/75/Productivity-measurement-of-agile-teams-IWSM-2015-7-2048.jpg)

The document discusses the challenges of measuring productivity in agile software development, particularly regarding the impact of non-functional requirements on performance metrics. It emphasizes that while traditional productivity measurement methods work well for fixed-scope projects, agile projects face unique difficulties, such as fluctuating functional sizes and issues with effort tracking. A proposed solution is to normalize functional size based on story points associated with backlog items, allowing for more accurate performance assessments within agile frameworks.