State of the U.S. Online Retail Economy in Q2 2010 comScore
comScore Chairman Gian Fulgoni presents his quarterly review of the state of the U.S. online retail economy during this webinar from Thursday, August 19. This installment includes an overview of e-commerce trends in the second quarter of 2010 and survey findings that highlight consumer sentiment about the current state of the economy.
State Of The Us Online Retail Economy Q2 2012Ann Honomichl
The document summarizes key findings from a comScore report on the state of the U.S. online retail economy in Q2 2012. It finds that online retail spending grew 16% year-over-year through June 2012, totaling $87 billion in sales. Consumer perceptions of the economy remained negative, though online retail provided a small boost. Top product categories and retailers are reviewed, along with trends in mobile commerce and social media. The report provides insights on economic indicators and consumer online shopping behavior in Q2 2012.
This was a handout at the IBPA Publishing University Conference in San Francisco on 3-10-12 as part of David Marshall's presentation: Positioning Your Digital Strategy for Maximum Profits. #ibpau12
Q3 2003 Motorola Inc. Earnings Conference Call Presentationfinance7
- Motorola reported Q3 2003 earnings with total sales of $6.8 billion, a 4.5% increase over Q3 2002. Earnings per share remained flat at $0.06 excluding special items.
- Gross margin declined due to increased handset competition and pricing pressures in Asia combined with sales of discontinued low-margin products. However, SG&A and R&D expenses as a percentage of sales improved.
- Operating margin remained flat at 4.4% compared to Q3 2002. Cash flow was strong with $1.1 billion in operating cash flow and $0.9 billion in free cash flow.
The document summarizes the Electro & Communications Business (ECB) at 3M. It discusses how the ECB has improved its business footprint through a focus on customers, growth initiatives, and operational excellence. Key highlights include stronger financial results from a more balanced portfolio, growth opportunities in infrastructure and electronics markets, and initiatives to shift activities closer to customers through global centers of excellence. The ECB is well positioned for continued accelerating growth.
Eletropaulo reported strong financial results in the 2nd quarter of 2005. Net income increased significantly to R$136.8 million compared to a loss in the previous quarter, due to higher operating revenue and lower net financial expenses. Revenue grew due to a tariff adjustment and the completion of a tariff review from 2003. The company also issued bonds of R$474 million in the international market and had its credit rating upgraded.
The document discusses the challenges facing the printing and publishing industries due to economic recession and technological changes. It notes declining revenues and employment in these sectors. However, it argues that opportunities still exist for companies that innovate and gain market share through new business models, platforms like web-to-print and cloud computing, customization, and cost efficiencies. The presentation recommends strategies like developing the best team, continuous innovation, geographic expansion, reducing costs, expanding product/service offerings, and making technology investments to achieve growth and create sustainable value in this changing environment.
The document discusses Ireland's need for fiscal consolidation given its large budget deficit and rising debt levels. It notes that without policy changes, Ireland's general government budget deficit will exceed 10% of GDP in 2009 and its gross government debt will reach around 50% of GDP. If annual borrowing remains above 10% of GDP, Ireland's debt could reach 100% of GDP fairly quickly. The document argues that significant cuts to current and capital government spending are required to reduce borrowing and contain the growth of debt. Further tax increases may also be needed to achieve fiscal consolidation.
Why has multifamily investment been so hot, especially in D.C.? What are some of the underlying economic and demographic fundamentals driving the multifamily market?
This document discusses the economic crisis and recession. It analyzes multiple factors that contributed to the problems, including the housing crisis, overleveraged financial institutions, falling asset prices, and a weak household balance sheet both in the US and globally. It examines trends in areas like inflation, interest rates, home prices, mortgage originations, derivatives, and consumer spending to explain how imbalances developed over time. The document concludes that this crisis is more secular and global in nature rather than a "normal" crisis, and will take time to work through reduction of debt and risk.
The document summarizes Bill Johnson's presentation at the Morgan Stanley Global Electricity & Energy Conference on April 3, 2008. The presentation outlines Progress Energy's strategy to secure its energy future through operational excellence, growth prospects like rate base expansion, and maintaining constructive regulation. It highlights Progress Energy's two regulated utilities with strong growth prospects and discusses key strategic issues like US climate change policy and needed new baseload capacity like the proposed Levy County nuclear project.
- The real estate market statistics document provides data on home sales, listings, prices, and absorption rates for March 2009 compared to March 2008 for the overall MLS area as well as the Aurora North and Aurora South submarkets.
- Key findings include declines in home sales, listings, and prices year-over-year for March 2009 in the overall market as well as both submarkets. Absorption rates also decreased across the board.
- Average home prices fell 8.4% overall and condo prices dropped 12.6% in March 2009 compared to the previous year. Both Aurora North and Aurora South saw price decreases as well as significant drops in active listings and new listings.
The document summarizes a report on the state of lending in America and its impact on U.S. households. It finds that while total debt levels remain high, the types of debt have shifted to mortgages and student loans. Consumer spending is key to the U.S. economy, but many families have little financial breathing room after covering expenses and debt payments each month. Predatory lending contributed to depleted household assets during the recession, with a $7 trillion drop in home equity alone.
This document provides an overview of The Sherwin-Williams Company to investors. It discusses the coatings industry and Sherwin-Williams' position as a top manufacturer. It highlights Sherwin-Williams' diversified customer base in architectural, industrial, and OEM coatings. It also outlines the company's controlled distribution network, leading brands, investment in technology, acquisition strategy, and financial strength.
The real estate market in Stamford, CT saw declines in October 2011 compared to the previous month and year. Median and average sales prices were down 24% and 15% respectively from the previous month and down 16-25% from October 2010. Only 30 properties sold, a 50% decrease from the previous month and 23% decrease from the prior year. Average days on market increased 34% from the previous month, indicating a shift towards a buyer's market. Overall the data shows the market weakening further in October 2011.
This investor presentation provides an overview of Office Depot's business, including industry trends, financial performance, strategic priorities, and business updates. Key points include:
- Office Depot is a leading global provider of office supplies and services with $14.5 billion in annual sales.
- Macroeconomic weakness negatively impacted 2007 results, though strategic actions have improved profitability.
- Strategic priorities focus on cash management, growing services, inventory management, and reducing costs.
- Business unit updates outline actions to pursue small/medium businesses, improve margins, and reduce operating expenses.
- Global sourcing initiatives aim to increase private brand penetration and margins.
The ViSalus Sciences compensation plan offers various ranks for distributors to achieve based on monthly qualification volume (QV) requirements. Distributors earn commissions on product sales and bonuses for recruiting new distributors. Commissions are paid on a weekly or monthly cycle depending on the type of earnings. The plan utilizes a unilevel structure with compression where earnings are paid through multiple levels of a distributor's downline organization.
The document provides an investor briefing for Bemis Company. It summarizes Bemis' business profile including its global presence, vertical integration, and key financial metrics. The briefing also outlines Bemis' strategic priorities to optimize its scale, grow in target areas like medical packaging, and accelerate innovation in materials and packaging features. Guidance is given for 2013 with adjusted EPS expected between $2.30 to $2.45 and cash flow from operations above $430 million.
Activate is the strategy consulting firm redefined, and "What Matters" is our look at the ideas that will help companies at the intersection of media, technology and entertainment grow their businesses.
The document discusses opportunities in Mexico's aerospace industry for foreign investment. It notes that aerospace companies are increasingly locating operations in Mexico to take advantage of lower wages and an increasingly skilled workforce. Mexico's aerospace exports have more than tripled since 2004. Companies like Bombardier and Goodrich have established new factories in Mexico to manufacture aircraft parts at significantly lower costs. The electronics and automotive industries have also seen major investment and growth in Mexico due to competitive advantages like labor costs and geographic proximity to the US market.
This document provides real estate market data for Hilton Head Island and Bluffton-Mainland communities, showing the number of homes sold and median sales price from 2001-2011. Graphs display trends in units sold and median price for individual communities. Links are provided for more information on each community. The document aims to analyze and compare real estate market performance across the area.
The document summarizes key points from a presentation given at a ULI Fall Meeting in Miami Beach, FL in October 2008 regarding the global credit crunch and its impacts. Some of the key points include: construction completions in the US are much lower now than in the 1980s and will not likely cause overbuilding; commercial mortgage debt outstanding in the US grew significantly as a percentage of GDP leading up to the credit crunch; global investment sales transaction volumes and property values have declined significantly due to the credit crunch; and the world's reliance on oil from the Persian Gulf region has significant geopolitical implications.
National Press Club: DCBIA DC Office Leasing Outlookkottmeier
The document provides an economic update for the DC metro commercial real estate market. It notes that job growth has slowed significantly since early 2012. In the office market, vacancy is rising as demand for space has declined and rents are flat or falling. Confidence in the market is low due to uncertainty around fiscal policy issues like the upcoming "fiscal cliff." While federal spending is slowing, the DC metro remains an important economic center with strengths like highly educated workforce and population growth. The outlook calls for continued weak conditions over the next 18 months but a return to stronger growth starting in 2014 if fiscal issues are resolved.
The document appears to be a website URL for www.gazzetta.gr, which is likely a Greek news website. The URL provides no other context or information about the content on the website.
This document appears to be a list of 10 words from a 3rd period class. The words include: bird, burn, first, fur, girl, her, hurt, shirt, sir, and were.
The Washington DC office market saw limited growth in the third quarter of 2012, with net absorption of only 12,000 square feet. Vacancy rates fell slightly to 10.3% despite uncertainty around elections and government spending keeping demand cautious. Average asking rents rose modestly by 1.2% over the quarter. Small to mid-size private sector tenants such as law firms and non-profits drove the limited demand while the public sector remained stalled awaiting policy decisions. No new supply was delivered in the quarter and vacancy is expected to remain flat with modest rental growth over the next 18 months due to a lack of significant demand drivers.
This document appears to be a list of Greek news website URLs. It includes www.gazzetta.gr and www.nooz.gr, two Greek news sites. The document provides two website addresses for Greek news but does not contain any other text.
- The median home price in the Portland area declined 13.9% over the last year to $246,200 as of Q2 2009, continuing a weakening trend.
- Local job losses over the last year were sharp at -56,800 (-5.5%), contributing to weak housing demand.
- Mortgage rates remain low while affordability is improving, with the monthly mortgage payment-to-income ratio at a historically strong 15.4% in Q2 2009.
- Foreclosure rates on prime loans are low at 0.4% while rates on subprime and Alt-A loans show large local increases compared to a year ago but remain below national averages.
The local housing market report for Austin, Texas in the third quarter of 2009 found:
- The median home price was $189,100, down slightly from a year ago but higher than the national median of $177,900.
- Existing home sales growth remained sluggish at -1.9% compared to 5.9% nationally.
- Job losses continued in Austin but at a lower rate than the national average, and the unemployment rate of 7.2% was below the 9.8% national rate.
- Housing affordability was better than historical averages and stronger than the national market due to lower mortgage payments as a percentage of income.
Commercial real estate toronto, office space toronto, toronto office space, office search toronto, office space in toronto, office rentals toronto, office space price in toronto, office rent downtown toronto, office rent toronto, toronto offices for lease, small office space toronto, toronto recent listings, toronto office rentals, toronto office lease, cost of downtown toronto space, office lease price toronto downtown, toronto office leases, office lease prices toronto, toronto office rent, toronto loft spaces for rent, office space for rent in toronto, Toronto office real estate blog, office space for rent toronto,
office space in toronto price, rent office toronto, offices for lease toronto, sublet office toronto, leasing companies downtown toronto, LinkedIn
Loopnet Local Quarterly Insight Report Q1, 2009aporrazzo
The document provides market data on industrial, office, multifamily, and retail properties in Reno for the first quarter of 2009. Some key points:
- Median asking sale prices for industrial properties were $2.8 million for manufacturing and $1.1 million for flex/R&D. Average rents were $4.38/sf and $8.53/sf respectively.
- For office properties, the median asking sale price was $1.1 million with an average size of 9,611 sf. Rents averaged $22.92/sf.
- Multifamily properties had a median sale price of $818,975 for garden-style units and $1.1 million for
The document provides market data for industrial, office, multifamily, and retail properties in Reno, Nevada for the fourth quarter of 2008. Some key points:
- For industrial properties, the average asking sale price per square foot was $122.63. Manufacturing buildings had the highest average size at 59,352 square feet.
- For office properties, the average asking sale price per square foot was $215.52. Office buildings had the highest average size at 10,848 square feet.
- For multifamily properties, garden/low-rise buildings had the highest median asking sale price at $887,000. Mid/high-rise buildings had the highest average number of units at 147.
office space toronto, toronto office space, office search toronto, office space in toronto, office rentals toronto, commercial office space, commercial real estate toronto, office rent toronto, toronto offices for lease
This document provides an agenda for the CONNECTIONS Summit event happening on November 8, 2011. The agenda includes sessions on smart TV trends, video across multiple screens, consumer demand for energy services, the personal cloud, and a networking reception. Topics will explore shifts in viewing habits, content delivery across devices, opportunities for new energy services providers, the transition to cloud storage, and networking.
Dt east office market dashboard 2011 q1Chris Fyvie
office space toronto, toronto office space, office search toronto, office space in toronto, office rentals toronto, commercial office space, commercial real estate toronto, office rent toronto, toronto offices for lease
The document provides an overview of India's large population and growing economy. Some key points:
- India has a population of over 1.21 billion people, with over 60% under age 35 and urban population contributing 60% of GDP.
- Household income is increasing significantly across income brackets, fueling more discretionary spending.
- Many sectors like FMCG, retail, healthcare and hospitality are experiencing strong growth of 6-15% annually.
- Television is a major advertising medium due to its large reach, though distribution challenges remain due to a fragmented market of over 50,000 cable operators.
- The document introduces Prime Connect as an independent distribution platform that aims to organize channel distribution through various digital platforms
The document summarizes an open house for a commercial redevelopment study in Midtown Fort Collins. It provides information on the project team from Fregonese Associates and Economic & Planning Systems. It analyzes retail and housing demand, opportunity sites, conceptual plans including prototypes, and discusses redevelopment of Foothills Mall. Next steps outlined include evaluating feasibility, financing options, recommendations, and an implementation action plan.
This document summarizes commercial real estate market trends in the Puget Sound area for the fourth quarter of 2012. Key points include:
- Total vacancy rates were 15.41% across the region, with the highest submarket vacancies in the Southend (20.5%) and Northend (22.7%).
- Average asking lease rates ranged from $21.42/sq ft in the Southend to $32.29/sq ft in Downtown Seattle.
- Positive net absorption totaled 928,177 sq ft across the region over the last four quarters, with the largest gains in Downtown Seattle.
- Total under construction was 474,955 sq ft, with
A taster of the results from IAB & MMA supported research into the UK mobile advertising market (June 2009).
If you want to buy the full report then contact James Cameron on james@camerjam.com
- Century Aluminum reported financial results for the first quarter of 2009 with a net loss of $115 million compared to a net loss of $694 million in the fourth quarter of 2008.
- Operations have been impacted by weak end markets with plants performing safely though further capacity curtailments may be required to balance the aluminum market.
- The company has taken aggressive actions to reduce costs including full curtailment of the Ravenswood plant, curtailment of a potline at Hawesville, and production cuts at other facilities. Liquidity was also improved through an equity offering and tax refunds providing $267 million of cash on hand.
- While signs of potential market stabilization are emerging, the macro
The document summarizes the state of lending in America and its impact on U.S. households. It discusses how the mortgage market evolved in the 2000s, with the rise of subprime and Alt-A loans, private label mortgage backed securities, and weak regulation of abusive lending practices. This led to a foreclosure crisis in the late 2000s that disproportionately impacted minority homeowners. The challenges going forward include protecting financial reforms, preventing unnecessary foreclosures, and preserving affordable homeownership opportunities.
Finding the Sweet Spot: A Case Study on the Display Advertising Revolution (S...Signal Chicago 2012
This document discusses how display advertising is poised to surpass search advertising in the next 2-3 years. It highlights how real-time bidding has grown from 4% to 27% of display budget spending from 2010 to 2015. The opportunity lies in unifying measurement data and targeting to move from traditional segmentation to understanding individual consumer behavior dynamics. Quantcast captures 500 billion moments of online relevance each month to help clients like U.S. Cellular achieve a 35% conversion rate from 20% of impressions and 46% lower costs per acquisition. Big data combined with innovative ideas can revolutionize digital advertising.
Cleantech 3.0: Urbanization and Supply Chains Ontario and Masdar as Transfo...MaRS Discovery District
The document discusses how population growth, urbanization, and increasing resource demands will lead to 10 billion people and 400 megacities by 2050. It also notes that private capital investment in cleantech innovation has topped $100 billion. Finally, it proposes that Ontario and Masdar could be transformative partners in addressing these challenges through a cleantech accelerator that identifies client goals and barriers, recommends target partners, and accelerates cleantech solutions.
The document discusses the growth of e-commerce and internet usage. It notes that the number of online buyers has grown significantly from 128 million in 2002 to over 500 million projected for the end of 2003. The document also emphasizes that having an online presence for a business is increasingly important, as statistics show 60,000 new internet users per day and Bill Gates has stated that businesses without an online presence by 2005 will likely fail. The document promotes the website www.justclickit.net.my for helping businesses embrace this new era of online opportunities.
QLogic Corporation is a leading provider of converged networking solutions. It has significant market opportunities in areas like intelligent converged networks, InfiniBand, and Fibre Channel. The company has competitive advantages through its established Fibre Channel stack and intellectual property portfolio. QLogic also has a highly attractive financial model with strong financials, consistent profitability, and ongoing stock buybacks. It is a market leader in key areas like Fibre Channel adapters, emerging FCoE adapters, and iSCSI hardware offload adapters.
Small cap companies outperform large capsJustin Case
Small companies have historically outperformed large companies over long periods of time. Two studies from the 1980s and 1990s both showed that smaller companies achieved higher average annual returns than larger companies. In a study of returns from 1963-1980, the smallest company decile achieved an average annual return of 32.8%, significantly higher than the 23.5% return of the largest companies. Similarly, a 1951-1996 study found that companies with market capitalizations under $100 million achieved average annual returns around 11-12%, higher than the 7.8% of the largest companies over $1 billion. However, the very smallest companies can be difficult to invest in due to low liquidity.
Similar to Procurement Spending in the DC Region (20)
The suburban Maryland office market saw continued negative absorption during the third quarter of 2012, with net demand registering at -39,000 square feet. The vacancy rate remained at 15.5% despite the negative absorption. Notable lease renewals by the GSA helped boost Montgomery County absorption numbers. While overall market conditions were sluggish, some areas like Bethesda saw continued leasing activity and positive absorption. Landlords have increased concessions to attract tenants in a slow leasing environment.
IT and the Federal Government - Doing More with Lesskottmeier
The federal government spends around $78.9 billion annually on information technology (IT), accounting for over 6% of discretionary spending. However, the IT budget has remained flat in recent years due to budget cuts and efforts to optimize spending through data center consolidation and increased adoption of cloud computing. Nearly half of all federal IT spending goes to the Department of Defense. Cybersecurity is also a priority and the Department of Homeland Security's cybersecurity budget is increasing. The shift to more mobile and virtual work environments could decrease demand for physical office space.
The U.S. economy created 227,000 seasonally adjusted, non-farm jobs in February, according to the latest employment report from the BLS. This is the third consecutive month of net job gains over 200,000. After flirting with a retrenchment in payroll growth this past summer, the U.S. economy has added 201,000 monthly payrolls, on average, since September. The latest metropolitan area employment figures show that the DC region added 13,400 office-using jobs on an annual basis in 2011.
2012 State Of The Capital Markets: DC Metrokottmeier
The document discusses the state of the capital markets in Washington DC in 2011 and 2012. It notes that while 2011 saw job growth and economic recovery, political uncertainty led to average or guarded levels of real estate activity. The DC metro remained one of the top performing markets, adding jobs and seeing high office investment sales volumes and prices, though federal spending growth is expected to slow in the coming years.
Impacts of Federal Spending Changes on DC Commercial Real Estatekottmeier
Federal spending impacts the DC region's economy and commercial real estate market. While cuts are proposed for FY2011 and FY2012, key agencies for the region like HHS saw increases in 2011. Long term trends still point to overall growth in federal budgets. The region has historically fared well even when federal spending slows as the private sector picks up. Defense remains important for Northern Virginia but the region has diversified. Federal employment declines may slow absorption temporarily but the office market typically performs well as private sector demand recovers.
Implications of Tax Cuts on Commercial Real Estatekottmeier
The document discusses the implications of various tax cut scenarios on the commercial real estate industry. Extending current income tax cuts for two years is the most likely outcome and would cost between $200-500 billion. This could shift some commercial real estate transactions to 2010 due to potentially higher capital gains taxes in 2011. Limiting itemized deductions and changes to estate tax laws could also impact commercial real estate markets and property values. Both short-term and long-term tax cuts carry economic and public debt implications.
Mid Term Elections & Commercial Real Estatekottmeier
The 2010 mid-term elections resulted in Republican control of the House while Democrats retained the presidency, dividing government. This document discusses several implications for commercial real estate, including that a divided government may delay decisions around fiscal stimulus and employment, prolonging recovery in real estate markets. Additionally, debates around tax cuts, federal spending, healthcare reform, and financial reform could impact demand for office and medical space. While employment is slowly improving, decisions made by Congress will influence future projections and commercial real estate demand over the next 5 years is estimated at 550-925 million square feet of office space.
The document discusses the impacts of the 2005 Base Realignment and Closure (BRAC) Commission recommendations. Key points:
- BRAC will result in the relocation of tens of thousands of jobs and federal agencies from the Washington D.C. area to military bases in Virginia and Maryland.
- Arlington County, Virginia will be most significantly affected, with over 5 million square feet of office space and 17% of its total office inventory impacted.
- Fort Belvoir in Fairfax County, Virginia will gain nearly 20,000 new jobs and 6 million square feet of new office space from relocated agencies like the National Geospatial Intelligence Agency.
- Other areas that will see impacts are Alexandria, Virginia
This report examines the market for energy efficient products and services in the residential sector. It analyzes demand drivers like green certification programs, legislation, incentives and financing programs. It also assesses new home/remodeling industries, products/appliances, energy audits and utility services. Key topics covered include the American Recovery Act, ENERGY STAR appliances, green building techniques, tax credits and auditing/verification. Market forecasts are provided for areas like home improvement spending and smart meter installations through 2014. The report concludes the market is still developing but will grow as homes age, utility prices rise and smart grid builds out, creating opportunities for energy efficiency.
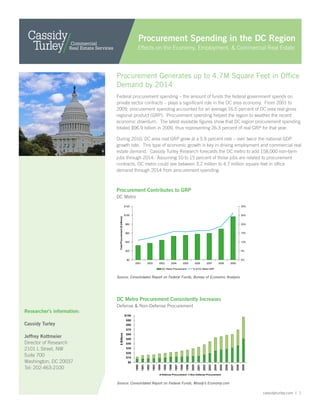
1. Procurement Spending in the DC Region
Effects on the Economy, Employment, & Commercial Real Estate
Procurement Generates up to 4.7M Square Feet in Office
Demand by 2014
Federal procurement spending – the amount of funds the federal government spends on
private sector contracts – plays a significant role in the DC area economy. From 2001 to
2009, procurement spending accounted for an average 16.5 percent of DC area real gross
regional product (GRP). Procurement spending helped the region to weather the recent
economic downturn. The latest available figures show that DC region procurement spending
totaled $96.9 billion in 2009, thus representing 26.3 percent of real GRP for that year.
During 2010, DC area real GRP grew at a 5.9 percent rate – over twice the national GDP
growth rate. This type of economic growth is key in driving employment and commercial real
estate demand. Cassidy Turley Research forecasts the DC metro to add 158,000 non-farm
jobs through 2014. Assuming 10 to 15 percent of those jobs are related to procurement
contracts, DC metro could see between 3.2 million to 4.7 million square feet in office
demand through 2014 from procurement spending.
Procurement Contributes to GRP
DC Metro
$120 30%
$100 25%
Total Procurement ($ billions)
$80 20%
$60 15%
$40 10%
$20 5%
$0 0%
2001 2002 2003 2004 2005 2006 2007 2008 2009
DC Metro Procurement % of DC Metro GRP
Source: Consolidated Report on Federal Funds, Bureau of Economic Analysis
DC Metro Procurement Consistently Increases
Defense & Non-Defense Procurement
Researcher’s information:
$100
$90
Cassidy Turley $80
$70
$60
$ Billions
Jeffrey Kottmeier $50
Director of Research $40
2101 L Street, NW $30
$20
Suite 700 $10
Washington, DC 20037 $0
1990
1991
1992
1993
1994
1995
1996
1997
1998
1999
2000
2001
2002
2003
2004
2005
2006
2007
2008
2009
Tel: 202-463-2100
Defense Procurement Non-Defense Procurement
Source: Consolidated Report on Federal Funds, Moody’s Economy.com
cassidyturley.com | 1
2. Procurement Spending in the DC Region
Effects on the Economy, Employment, & Commercial Real Estate
DC Procurement
With an increased focus on federal debt reduction, there is always What Happens in DC Stays in DC
the possibility that private sector contracts will decrease over the next DC Metro Procurement % of US Total
few years. Though, DC region procurement spending has increased
every single year for the past 20 years. In fact, DC region procurement 20%
18%
spending has grown 11 percent annually, more than double the national 16%
rate. 14%
12%
What happens in DC stays in DC. As the amount of federal procurement 10%
8%
contracts increased for the nation, a larger percentage of these contracts 6%
has shifted to the DC region. Over the past 25 years, the DC region 4%
captured an average of 11.3 percent of all procurement spending in the 2%
0%
US. The latest figures show that the DC region captured over 18 percent
1984
1985
1986
1987
1988
1989
1990
1991
1992
1993
1994
1995
1996
1997
1998
1999
2000
2001
2002
2003
2004
2005
2006
2007
2008
2009
of all procurement expenditures in 2009. The largest amount of DC
DC % of total US procurement
region procurement is spent with Department of Defense contractors,
which accounts for approximately half of all DC procurement spending. Source: Consolidated Report on Federal Funds, Moody’s Economy.com
Federal Contractors
Recent passage of key legislation and an increased focus on federal deficit reduction could potentially affect procurement spending. These
changes in budgeting and funding for defense, healthcare and commerce will affect private sector employment in the DC region and,
subsequently, local office market demand.
Defense – the Department of Defense (DoD) accounts for a significant
Procurement Spending by Agency
portion of overall procurement spending. DC metro defense
National Totals
procurement increased to over $50 billion in 2009, a 15 percent
increase over the previous year. Defense
Others
$20 $400
Northern Virginia is the recipient of a majority of these funds. But $18 $350
changes mandated by the Base Realignment and Closure (BRAC) $16
$300
$14
process have the potential to impact private sector contractor business $250
$12
billion $
billion $
in Northern Virginia. BRAC was enacted by the Federal Government $10 $200
to reorganize and consolidate military bases to meet increased $8 $150
national security requirements. Many expected that private contractors $6
$100
would move as federal agencies relocated by the statutory deadline $4
$2 $50
of September 15, 2011. But not all federal government moves have
$0 $0
taken place as scheduled, and there are still 3.2 million square feet 2003 2004 2005 2006 2007 2008 2009
of federal leases set to expire beyond 2011 in Arlington County alone. Homeland Security Commerce Treasury Health & Human Services Defense
Thus, any private sector moves would occur over a longer period of
time than originally expected. Source: Consolidated Report on Federal Funds, Moody’s Economy.com
The top five private sector companies receiving DoD procurement dollars all have a significant presence in the DC region. These companies
accounted for $101 billion in procurement contracts – or 28 percent of all DoD procurement in 2009. Refer to the Appendix for a list of the
top national contractors, most of which have a presence in the DC region.
Federal debt has climbed to historical highs over the past few years. National defense spending has come under increased scrutiny. After
many years of significant expansion, growth in defense spending is expected to slow in 2011. Most industry experts predict defense spending
to grow at a slower rate in the DC metro area. Additionally, defense spending may shift from military-based projects to initiatives in IT, cyber
security and intelligence, which bode well for the DC region. Although there is always the potential for DC defense procurement to slow, it has
not declined in the DC metro area for the past 20 years.
cassidyturley.com | 2
3. Procurement Spending in the DC Region
Effects on the Economy, Employment, & Commercial Real Estate
Health - the Department of Health and Human Services (HHS) awarded just under $19 billion in procurement contracts during 2009.
With the enactment of national healthcare reform in 2010, HHS-related business is expected to expand. For example, HHS took 70,500
square feet of space in suburban Maryland in 2010 due to healthcare reform. Some private sector contractors have expressed an interest in
additional office space, although there remains uncertainty in some aspects of healthcare reform which have not been fully funded yet.
In 2009, the top contractor recipients of HHS procurement dollars were global pharmaceutical companies (Novartis, Merck, Sanofi-Aventis,
GlaxoSmithKline) that are headquartered outside of the DC metro area. Northern Virginia-based SAIC (a scientific, engineering and technology
company) received $825 million in 2009 HHS procurement contracts, equal to 4.1 percent of all HHS procurement.
Suburban Maryland is expected to experience future growth with developments in healthcare industries and services. The National Cancer
Institute (NCI) has broken ground on a new 575,000 square foot building expected to deliver in the first quarter of 2013. Opportunities
exist for healthcare research and medical offices with proximity to NCI and the National Institutes of Health. Depending on which areas of
healthcare reform are fully funded, future demand in the private sector will be for office space suitable for medical offices, research, IT,
accounting, and administrative services.
Finance and Commerce - the Departments of Commerce and Treasury have expanded due to new financial regulation, reform, and consumer
protection. These two agencies combined accounted for just under $8 billion in federal government procurement spending during 2009.
Approximately half of this amount was spent in the DC region.
In 2009, Harris Corporation and Lockheed Martin (both of which have a strong local presence in DC) accounted for $639 million, or 20
percent, of the Department of Commerce procurement spending in the US. Northern Virginia-based Computer Sciences Corporation (CSC)
and Northrop Grumman were two of the top five contractors for the Department of Treasury.
Legislation, such as the Wall Street Reform and Consumer Protection Act (referred to usually as “Dodd-Frank”), has spurred office leasing
activity in the public sector during 2010 and will continue to do so in 2011. The Securities and Exchange Commission (SEC) leased 900,000
square feet during the summer of 2010 at Constitution Center in DC. The Office of the Comptroller of the Currency (OCC) has since leased
640,000 square feet of the SEC’s space. Future opportunities may exist for private companies providing outsourcing services in finance,
accounting, and IT services.
IT - Information technology is required across all areas and levels of government. In an era of cost consciousness, federal agencies are
seeking to outsource IT services. Agencies such as the General Services Administration (GSA) expect to save $15 million over the next five
years by outsourcing IT1. Cloud computing2 has been one solution to the Federal Government’s need to shift IT services and infrastructure
to a third party. For instance, by Fiscal Year 2012, the Department of Homeland Security plans on shifting 100,000 e-mailboxes into “the
cloud.” Increased demand for IT services bodes well for Northern Virginia’s private sector technology companies.
1
Johnson, Nicole Blake. FederalTimes.com, 28 Feb 2011.
2
Cloud computing is where IT services and storage are provided over the Internet (or “cloud”)
cassidyturley.com | 3
4. Procurement Spending in the DC Region
Effects on the Economy, Employment, & Commercial Real Estate
Employment
Commercial real estate demand is closely linked with job growth. The past year showed an improvement in both the public and private sector
employment. According to the Bureau of Labor Statistics, the DC metro area added 8,700 non-farm jobs on a non-seasonally adjusted,
annualized basis in 2010. DC regional employment in the Healthcare and Professional and Business Services sectors grew in 2010, while the
Financial Services sector still continued to shed jobs.
Moving forward, Cassidy Turley Research forecasts job growth in 2011-2014 to be steady as economic and business conditions in the private
sector continue to improve. We expect the Financial Activities sector to show some improvement after four years of consecutive downsizing.
Initiatives in the Departments of Commerce and Treasury may contribute to this growth, although the sector still faces some risk due to the
uncertain fate of Fannie Mae and Freddie Mac.
With the exception of 2010, scientific and IT sectors have performed well in the DC region. We expect employment in Computer Systems
Design and Management, Scientific, and Consulting Services to pick up as more demand shifts back to IT-related services as result of
increased cyber security and government spending for IT services.
Employment in the Healthcare sector will continue to expand. Over the past 20 years, the sector has added jobs in the DC region every single
year. On average, healthcare employment grows 3.2 percent annually, or by 4,600 jobs.
Employment Changes Professional & Business Services Employment
DC Metro, Year over Year Change DC Metro, Year over Year Change
30
15 35
130
25
Sector Employment Change (000)
PBS Employment Change (000)
25
Total Private Employment Change (000)
110
10
Sector Employment Change (000)
20
90
15
15 70 5
5
10 50
0
30 (5)
2000
2001
2002
2003
2004
2005
2006
2007
2008
2009
2010
5
10
(5)
0 (15)
(10)
2000
2001
2002
2003
2004
2005
2006
2007
2008
2009
2010
(5) (10) (25)
(30)
(10) (50) Legal Accounting
Financial Activities Health Computer Systems Design Mgmt, Scientific & Consulting Services
Professional & Business Services Total Private Employment Employment Services Total Professional & Business Services (PBS)
Source: Bureau of Labor Statistics, Moody’s Economy.com Source: Bureau of Labor Statistics, Moody’s Economy.com
cassidyturley.com | 4
5. Procurement Spending in the DC Region
Effects on the Economy, Employment, & Commercial Real Estate
Appendix - Top Contractors, 2009 US Totals
Department of Defense
Rank Global Vendor Name Total Dollars % of Total Agency
Procurement
1 Lockheed Martin Corporation $31,348,453,591 8.7%
2 The Boeing Company $20,604,690,107 5.7%
3 Northrop Grumman Corporation $18,293,375,394 5.1%
4 General Dynamics Corporation $15,662,063,160 4.3%
5 Raytheon Company $15,332,423,922 4.2%
6 United Technologies Corporation $7,047,569,735 1.9%
7 L-3 Communications Holdings Inc. $6,841,410,117 1.9%
8 BAE Systems plc $6,704,063,087 1.9%
9 Oshkosh Truck Corporation $6,379,043,578 1.8%
10 KBR Inc. $4,635,422,289 1.3%
11 SAIC Inc. $4,338,700,255 1.2%
12 General Electric Company $3,442,880,553 1.0%
13 Humana Inc. $3,437,897,070 0.9%
14 Health Net Inc. $2,833,980,613 0.8%
15 Computer Sciences Corporation $2,752,215,384 0.8%
16 ITT Corporation $2,740,731,493 0.8%
17 Macandrews & Forbes Holdings Inc. $2,726,138,648 0.8%
18 Triwest Healthcare Alliance Corporation $2,672,212,524 0.7%
19 Bell Boeing Joint Project Office $2,620,340,066 0.7%
20 Bechtel Group Inc. $2,297,043,828 0.6%
21 Booz Allen Hamilton Inc. $2,272,314,245 0.6%
22 Agility $2,010,685,577 0.6%
23 Royal Dutch Shell plc $1,905,472,234 0.5%
24 DRS Technologies Inc. $1,884,448,151 0.5%
25 URS Corporation $1,838,845,209 0.5%
Source: Federal Procurement Data System
cassidyturley.com | 5
6. Procurement Spending in the DC Region
Effects on the Economy, Employment, & Commercial Real Estate
Department of Health and Human Services
Rank Global Vendor Name Total Dollars % of Total Agency
Procurement
1 Novartis AG $1,549,934,149 7.8%
2 Merck & Co. Inc. $1,367,338,968 6.9%
3 Sanofi-Aventis $1,346,629,103 6.8%
4 GlaxoSmithKline PLC $950,995,875 4.8%
5 SAIC Inc. $825,083,617 4.1%
6 Wyeth-Ayerst International Inc (Now Part Of Pfizer) $678,537,227 3.4%
7 Astrazeneca PLC $512,052,035 2.6%
8 Westat Inc. $341,385,546 1.7%
9 Blue Cross and Blue Shield Of South Carolina $318,217,501 1.6%
10 McKesson Corporation $295,630,849 1.5%
11 Veritas Capital Fund II L.P. $285,055,356 1.4%
12 Lockheed Martin Corporation $268,067,215 1.3%
13 Electronic Data Systems Corporation $227,888,458 1.1%
14 CSL Biotherapies Inc. $200,452,127 1.0%
15 Emergent Biosolutions Inc. $192,441,276 1.0%
16 Northrop Grumman Corporation $178,589,206 0.9%
17 Research Triangle Institute Inc. $169,826,366 0.9%
18 Human Genome Sciences Inc. $161,056,235 0.8%
19 Wellpoint Inc. $156,498,189 0.8%
20 Booz Allen Hamilton Inc. $146,339,413 0.7%
21 International Business Machines Corporation $141,121,505 0.7%
22 Roche Holding AG $134,750,493 0.7%
23 Bearingpoint Inc. $113,763,984 0.6%
24 SRA International Inc. $107,263,652 0.5%
25 STG International Inc. $96,747,677 0.5%
Source: Federal Procurement Data System
cassidyturley.com | 6
7. Procurement Spending in the DC Region
Effects on the Economy, Employment, & Commercial Real Estate
Department of Commerce
Rank Global Vendor Name Total Dollars % of Total Agency
Procurement
1 Harris Corporation $379,382,622 12.0%
2 Lockheed Martin Corporation $259,362,586 8.2%
3 True North Communications Inc. $203,207,944 6.4%
4 International Business Machines Corporation $126,408,589 4.0%
5 Raytheon Company $70,597,211 2.2%
6 Reed Elsevier Group PLC $70,497,934 2.2%
7 ICS Nett Inc. $52,591,577 1.7%
8 SAIC Inc. $45,740,353 1.4%
9 Earth Resources Technology Inc. $44,559,690 1.4%
10 Nana Regional Corporation Inc. $34,517,201 1.1%
11 Industries For The Blind Inc. $31,741,025 1.0%
12 Riverside Technology Inc. $28,536,730 0.9%
13 Veritas Capital Fund II L.P. $28,150,782 0.9%
14 I.M. Systems Group Inc. $27,351,450 0.9%
15 The Aerospace Corporation $26,583,095 0.8%
16 Computer Sciences Corporation $24,525,520 0.8%
17 RS Information Systems Inc. $22,537,308 0.7%
18 Integrated Solutions LLC $22,442,369 0.7%
19 Dell Inc. $21,995,971 0.7%
20 Diversified Global Partners JV LLC $21,566,260 0.7%
21 Arctic Slope Regional Corporation $17,958,358 0.6%
22 The Mitre Corporation $17,729,383 0.6%
23 Fugro N.V. $17,170,623 0.5%
24 Sabre Systems Inc. $17,111,843 0.5%
25 SI International Inc. $16,450,766 0.5%
Source: Federal Procurement Data System
cassidyturley.com | 7
8. Procurement Spending in the DC Region
Effects on the Economy, Employment, & Commercial Real Estate
Department of the Treasury
Rank Global Vendor Name Total Dollars % of Total Agency
Procurement
1 Afinsa Bienes Tangibles SA $925,324,294 19.8%
2 Sunshine Minting Inc. $348,011,140 7.4%
3 Mitsui & Co. Ltd. $198,787,092 4.3%
4 Computer Sciences Corporation $140,506,913 3.0%
5 Northrop Grumman Corporation $136,326,452 2.9%
6 Crane & Co. Inc. $129,214,160 2.8%
7 Accenture Ltd. $99,721,668 2.1%
8 Booz Allen Hamilton Inc. $94,005,930 2.0%
9 Lockheed Martin Corporation $90,354,242 1.9%
10 Apptis Inc. $72,830,328 1.6%
11 Cookson Group plc $70,454,392 1.5%
12 Integrated Solutions LLC $65,255,807 1.4%
13 The Mitre Corporation $62,686,289 1.3%
14 Global Metals LLC $62,676,075 1.3%
15 True North Communications Inc. $61,326,809 1.3%
16 International Business Machines Corporation $60,960,829 1.3%
17 Poongsan Corporation $54,050,777 1.2%
18 Government Acquisitions Inc. $43,386,423 0.9%
19 URS Corporation $40,000,017 0.9%
20 Unisys Corporation $38,934,436 0.8%
21 L-3 Communications Holdings Inc. $37,578,340 0.8%
22 BAE Systems plc $36,042,244 0.8%
23 Deloitte & Touche Usa LLP $35,479,332 0.8%
24 GTSI Corporation $34,338,396 0.7%
25 AT&T Inc. $32,021,279 0.7%
Source: Federal Procurement Data System
Disclaimer
This report and other research materials may be found on our website at www.cassidyturley.com. This is a research
document of Cassidy Turley in Washington, DC. Questions related to information herein should be directed to the
Research Department at 202-463-2100. Information contained herein has been obtained from sources deemed
reliable and no representation is made as to the accuracy thereof. Cassidy Turley is a leading commercial real estate
services provider with 3,000 professionals in 60 offices nationwide. The firm completed transactions valued at $17
billion in 2010, manages 430 million square feet on behalf of private, institutional and corporate clients and supports
over 25,000 domestic corporate services locations. Cassidy Turley serves owners, investors and occupiers with a full
spectrum of integrated commercial real estate services—including capital markets, tenant representation, corporate
services, project leasing, property management, project and development services, and research and consulting.
cassidyturley.com | 8