More Related Content
Similar to Loopnet Q4 2009 Insight Report 1 16 09 (20)
Loopnet Q4 2009 Insight Report 1 16 09
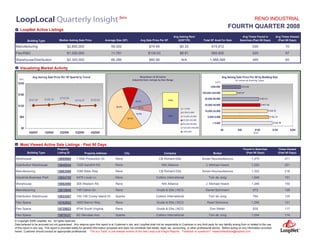
- 1. RENO INDUSTRIAL
FOURTH QUARTER 2008
LoopNet Active Listings
Avg Asking Rent Avg Times Found in Avg Times Viewed
Median Asking Sale Price Average Size (SF) Avg Sale Price Per SF ($/SF/YR) Total SF Avail for Sale Searches (Past 90 Days) (Past 90 Days)
Building Type
Manufacturing $2,800,000 59,352 $74.49 $5.34 474,812 535 70
Flex/R&D $1,250,000 11,781 $135.03 $8.81 565,502 520 57
Warehouse/Distribution $2,300,000 66,286 $80.98 N/A 1,988,566 495 65
Visualizing Market Activity
Avg Asking Sale Price Per SF by Building Size
Avg Asking Sale Price Per SF Quarterly Trend Breakdown of All Active
($/sf) Industrial Sale Listings by Size Range A ll Ind ust rial B uild ing T yp es
(sq ft)
$240
>250,000 $ 53.06
100,000-249,999 $ 41.27
$180
11.4%
$132.85 50,000-99,999 $ 103.51
$125.10
$121.97 $122.63
$119.37 2.9%
16.2%
25,000-49,999 $ 107 .85
$120 35.2% 5.7% < 5,000
$ 12 8.12
10,000-24,999
5,000-9,999
13.3%
2.9% 10,000-24,999
$60 5,000-9,999 $ 132.31
18.1%
25,000-49,999
$ 142.10
< 5,000
50,000-99,999
100,000-249,999
$0
$0 $50 $100 $150 $200
>250,000
4Q2007 1Q2008 2Q2008 3Q2008 4Q2008 ($ /sf)
Most Viewed Active Sale Listings - Past 90 Days
Property Found in Searches Times Viewed
Building Type Listing ID (Past 90 Days) (Past 90 Days)
Property Address City Company Broker
Warehouse 15895960 11500 Production Dr. Reno CB Richard Ellis Aiman Noursoultanova 1,475 271
Distribution Warehouse 15648544 1025 Sandhill Rd. Reno NAI Alliance J. Michael Hoeck 1,220 221
Manufacturing 15663069 1085 Bible Way Reno CB Richard Ellis Aiman Noursoultanova 1,302 216
Industrial-Business Park 15824755 5475 Louie Ln. Reno Colliers International Tom de Jong 1,848 191
Warehouse 15882060 305 Western Rd. Reno NAI Alliance J. Michael Hoeck 1,346 150
Manufacturing 15818949 145 Catron Dr. Reno Grubb & Ellis | NCG Daniel Buhrmann 973 129
Distribution Warehouse 15833557 152-156 Coney Island Dr. Sparks Colliers International Tom de Jong 794 125
Flex Space 15762922 3550 Barron Way Reno Grubb & Ellis | NCG Reed Simmons 1,256 121
Flex Space 15725823 9744 South Virginia Reno Grubb & Ellis | NCG Don Welsh 835 117
Flex Space 15876337 50 Glendale Ave. Sparks Colliers International Tom de Jong 1,034 114
© Copyright 2008 LoopNet, Inc. All rights reserved.
Data believed to be accurate but not guaranteed. Any reliance upon this report is at Customer’s risk, and LoopNet shall not be responsible to Customer or any third party for any liability arising from or related to the use
of this report in any way. This report is provided solely for general information purposes and does not constitute real estate, legal, tax, accounting, or other professional advice. Before acting on any information provided
herein, Customer should consult an appropriate professional. This is a quot;betaquot; or pre-release version of the new LoopLocal Insight Reports. Feedback or questions? researchfeedback@loopnet.com
- 2. RENO OFFICE
FOURTH QUARTER 2008
LoopNet Active Listings
Avg Asking Rent Avg Times Found in Avg Times Viewed
Median Asking Sale Price Average Size (SF) Avg Sale Price Per SF ($/SF/YR) Total SF Avail for Sale Searches (Past 90 Days) (Past 90 Days)
Building Type
Office Building $1,100,000 10,848 $208.75 $19.87 1,269,235 472 57
Medical Office $795,000 13,670 $191.60 $19.94 191,375 494 62
Office-R&D $1,622,500 11,096 $142.30 $12.86 22,192 842 167
Visualizing Market Activity
Breakdow n of All Active Avg Asking Sale Price Per SF by Building Size
Avg Asking Sale Price Per SF Quarterly Trend
Office Sale Listings by Size Range A ll Of f ice B uild ing T yp es
($/sf) (sq ft)
$400 >250,000
100,000-249,999
$300
50,000-99,999
18.0% $ 178.27
$224.77
$220.71 $219.73
$217.04 $215.52 28.6%
8.1%
25,000-49,999 $ 169.83
$200 11.8%
< 5,000
$ 168.44
10,000-24,999
5,000-9,999
5,000-9,999 $ 23 4.45
$100 41.6% 3.7%
10,000-24,999
$ 235.21
< 5,000
25,000-49,999
$0 $0 $80 $160 $240 $320
50,000-99,999
4Q2007 1Q2008 2Q2008 3Q2008 4Q2008 ($ /sf)
Most Viewed Active Sale Listings - Past 90 Days
Property Found in Searches Times Viewed
Building Type Listing ID (Past 90 Days) (Past 90 Days)
Property Address City Company Broker
Office Building 15882104 216 Stewart St. Reno Liberty Realty Rob Simpson 3,501 334
Office-R&D 16002387 1140 Corporate Bl. Reno Colliers International Tom de Jong 1,478 311
Office Building 15933700 160 Hubbard St. Reno Keller Realty, Inc. David Larson 1,971 247
Office Condo 15982877 50 N. Sierra St. Reno NAI Alliance Dominic Brunetti 1,812 177
Office Building 16017772 923 Tahoe Bl. Incline Village Wells & Bennett Realtors Barry Bennett 355 153
Office Condo 15787636 5474 - 5572 Longley Ln. Reno TD Realty Advisors Kevin Annis, CCIM 1,047 153
Medical Office 15903734 10593 Double R Bl. Reno Commercial Partners of Nevada Frank S. Gallagher 1,121 150
Medical Office 15852134 236 W. 6th St. Reno NAI Alliance Dominic Brunetti 1,236 143
Office Building 15865243 10451 Double R Bl. Reno Grubb & Ellis | NCG Don Welsh 1,141 140
Office Building 15982152 590 Lakeshore Bl. Incline Village Intero Commercial Bridget Evans 488 135
© Copyright 2008 LoopNet, Inc. All rights reserved.
Data believed to be accurate but not guaranteed. Any reliance upon this report is at Customer’s risk, and LoopNet shall not be responsible to Customer or any third party for any liability arising from or related to the use
of this report in any way. This report is provided solely for general information purposes and does not constitute real estate, legal, tax, accounting, or other professional advice. Before acting on any information provided
herein, Customer should consult an appropriate professional. This is a quot;betaquot; or pre-release version of the new LoopLocal Insight Reports. Feedback or questions? researchfeedback@loopnet.com
- 3. RENO MULTIFAMILY
FOURTH QUARTER 2008
LoopNet Active Listings
Avg Times Found in Avg Times Viewed
Building Type Median Asking Sale Price Avg Number of Units Average Sale Price Per Unit Total SF Avail for Sale Searches (Past 90 Days) (Past 90 Days)
Garden/Low-Rise $887,000 28 $86,693 1,344,785 1,038 116
Mid/High-Rise $750,000 147 $55,318 1,326,480 2,373 228
Duplex/Triplex/Fourplex $375,000 3 $138,759 68,888 936 73
Visualizing Market Activity
Breakdow n of All Active
Avg Asking Sale Price Per Unit Quarterly Trend Avg Asking Price Per Unit by Unit Mix
Multifam ily Sale Listings by Unit Mix A ll M ult if amily B uild ing T yp es
($/unit) (units/bldg)
$200,000 >50 Units $86,570
35 to 49 Units $1 ,339
01
3.1%
$150,000 18.8%
$118,947
20 to 34 Units $ 64,747
13.5%
$106,855
$99,177
10 to 19 Units $79,844
19.8%
$100,000 $114,103 <5 Units
12.5%
$99,939 9.4% 5-9 Units 5 to 9 Units $87,676
10-19 Units
$50,000 35.4% <5 Units $136,085
20-34 Units
35-49 Units $0 $40,000 $80,000 $120,000 $160,000
$0
>50 Units ($ /unit)
4Q2007 1Q2008 2Q2008 3Q2008 4Q2008
Most Viewed Active Sale Listings - Past 90 Days
Property Found in Searches Times Viewed
Building Type Listing ID (Past 90 Days) (Past 90 Days)
Property Address City Company Broker
Mid/High-Rise 15990728 260 Island St. Reno Metzker Johnson Group Richard Johnson 2,649 400
Garden/Low-Rise 15733618 350 Harbour Cove Dr. Sparks CB Richard Ellis Leonard Ramos 1,681 351
Garden/Low-Rise 15868814 100 Ralston St. Reno CB Richard Ellis Alex Mellinger, CCIM 2,146 334
Mid/High-Rise 15714493 28-34 W. Second St. Reno Drake Realty, Inc. Daryl Drake 3,553 305
Garden/Low-Rise 15858924 820 Spokane St. Reno CB Richard Ellis Alex Mellinger, CCIM 2,138 297
Garden/Low-Rise 15970735 2400 Sutro St. Reno Keller Realty, Inc. David Larson 2,713 280
Garden/Low-Rise 15739322 460 E. Grove St. Reno CB Richard Ellis Alex Mellinger, CCIM 1,852 263
Garden/Low-Rise 15809279 438 E. Taylor St. Reno CB Richard Ellis Alex Mellinger, CCIM 1,927 262
Garden/Low-Rise 15809437 3700 Kings Row Reno CB Richard Ellis Leonard Ramos 1,485 237
Garden/Low-Rise 15779625 550 S. Wells Ave. Reno CB Richard Ellis Alex Mellinger, CCIM 1,794 234
© Copyright 2008 LoopNet, Inc. All rights reserved.
Data believed to be accurate but not guaranteed. Any reliance upon this report is at Customer’s risk, and LoopNet shall not be responsible to Customer or any third party for any liability arising from or related to the use
of this report in any way. This report is provided solely for general information purposes and does not constitute real estate, legal, tax, accounting, or other professional advice. Before acting on any information provided
herein, Customer should consult an appropriate professional. This is a quot;betaquot; or pre-release version of the new LoopLocal Insight Reports. Feedback or questions? researchfeedback@loopnet.com
- 4. RENO RETAIL/SHOPPING
FOURTH QUARTER 2008
LoopNet Active Listings
Avg Asking Rent Avg Times Found in Avg Times Viewed
Median Asking Sale Price Average Size (SF) Avg Sale Price Per SF ($/SF/YR) Total SF Avail for Sale Searches (Past 90 Days) (Past 90 Days)
Building Type
Free Standing Bldg $1,291,082 12,992 $262.38 $22.23 441,718 1,212 119
Street Retail $1,175,000 9,888 $166.87 $22.23 59,327 1,078 87
Neighborhood/Strip $4,350,000 24,281 $240.22 $23.49 291,374 362 52
Visualizing Market Activity
Avg Asking Sale Price Per SF by Building Size
Avg Asking Sale Price Per SF Quarterly Trend Breakdown of All Active
Retail/Shopping Center Sale Listings by Size Range A ll R et ail/ Sho p p ing B uild ing T yp es
$600 (sq ft)
>250,000 $ 28.14
100,000-249,999 $ 27.96
$450
21.4%
$312.06 $312.49 50,000-99,999 $ 193.57
$305.79
$300.56 $294.01 2.9%
11.7%
25,000-49,999
$300 $ 172.79
23.3%
5.8%
< 5,000
1.0% $ 276 .16
10,000-24,999
5,000-9,999
$150 10,000-24,999 5,000-9,999 $ 251.19
37.9% 1.9%
25,000-49,999
$ 395 .2 2
< 5,000
50,000-99,999
$0 100,000-249,999
$0 $150 $300 $450 $600
>250,000
4Q2007 1Q2008 2Q2008 3Q2008 4Q2008 ($/sf)
Most Viewed Active Sale Listings - Past 90 Days
Property Found in Searches Times Viewed
Building Type Listing ID (Past 90 Days) (Past 90 Days)
Property Address City Company Broker
Free Standing Bldg 15214089 199 E. Moana Ln. Reno Staubach Retail Sara Sanders 717 429
Restaurant 15923247 1544 Stanford Sparks 39 Commercial Realty Inc. Phil Tripoli 2,198 402
Anchor 15925752 6139 S. Virginia St. Reno Retail West John DuBois 2,264 396
Restaurant 16008712 5015 Pyramid Way Sparks Sperry Van Ness Kase Abusharkh 2,047 371
Restaurant 15927528 9786 S. Virginia St. Reno Sperry Van Ness Dan Gluhaich 2,158 330
Free Standing Bldg 15985418 10140 N. McCarran Bl. Reno Faris Lee Investments Chris Tramontano 2,344 325
Restaurant 16008673 4995 Galleria Pwy. Sparks Sperry Van Ness Kase Abusharkh 2,108 300
Service/Gas Station 15896928 1600 Victorian Sparks 39 Commercial Realty Inc. Phil Tripoli 2,094 284
Free Standing Bldg 15921030 24 California Ave. Reno CB Richard Ellis Aiman Noursoultanova 2,414 270
Free Standing Bldg 15923665 595 Booth St. Reno CB Richard Ellis Aiman Noursoultanova 2,671 266
© Copyright 2008 LoopNet, Inc. All rights reserved.
Data believed to be accurate but not guaranteed. Any reliance upon this report is at Customer’s risk, and LoopNet shall not be responsible to Customer or any third party for any liability arising from or related to the use
of this report in any way. This report is provided solely for general information purposes and does not constitute real estate, legal, tax, accounting, or other professional advice. Before acting on any information provided
herein, Customer should consult an appropriate professional. This is a quot;betaquot; or pre-release version of the new LoopLocal Insight Reports. Feedback or questions? researchfeedback@loopnet.com