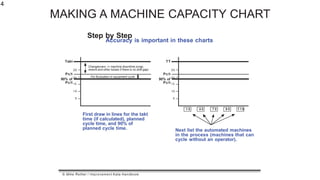
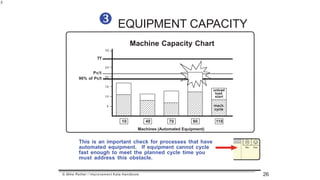
This document discusses assessing the capacity of equipment in a manufacturing process to determine if it can support the planned cycle time. It provides steps to create a machine capacity chart, which graphs the cycle times of automated equipment against the planned cycle time and takt time. This helps identify if any machines may become a bottleneck if they cannot cycle fast enough. The guideline is that a machine's total cycle time should be no more than 90% of the planned cycle time to allow for consistent one-piece flow.
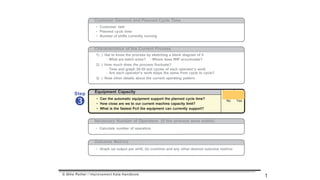
![This guideline applies only to automated machines that are able to cycle while
the operator does something else. Do not include machines that
require operator guidance, such as hand tools, hand welders, arbor presses,
etc. Those cycles are naturally included when you measure operator times.
The basic point: It's OK for a machine to finish cycling and wait for the
operator to return, but an operator should never have to wait for a
machine to finish. A machine only needs to cycle once per takt.
Total machine cycle should be no > 90% of Pc/t in order to make a
consistent 1x1 flow possible. (In fully automated lines 95% of Pc/t may
be acceptable.) [This guideline applies to machines, not operators.]
1. If machine utilization is too high workstations become close-
coupled and small cycle variations telegraph up- and
downstream. This causes instability and leads to buffers.
2. If machine utilization is too high operators will have to wait for a
machine to finish at some workstations, which interrupts their
work cycle and causes instability.
The fastest Pc/t a line can run a 1x1 flow (current capacity) is:
Longest total machine cycle time
0.90
MACHINE CYCLE 90% GUIDELINE
© Mike Rother / Improvement Kata Handbook
3](https://image.slidesharecdn.com/kata13-160713160745/85/Equipment-Capacity-3-320.jpg)