Downloaded 10 times


![MC Simulation
• Define domain of possible inputs
• Generate inputs randomly from domain
• Perform a computation
• Aggregate result
[source: Wikipedia]
Statistical sampling based simulation](https://image.slidesharecdn.com/actionable-metrics-v8-london-conf-share-version-170616124441/85/Improving-predictability-by-managing-flow-68-320.jpg)


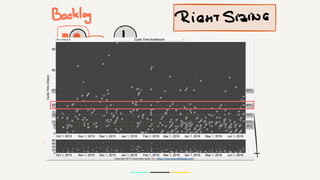
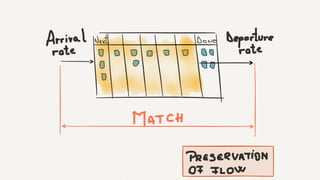
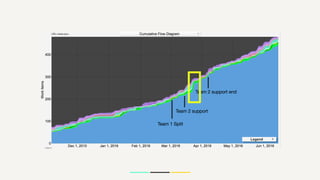
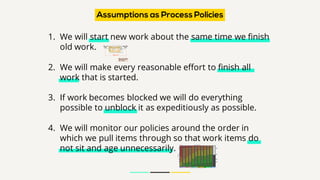
The document discusses a #noestimates approach to improving predictability in agile delivery projects using a Kanban system and key metrics like cycle time, throughput, and work in progress. It emphasizes the importance of adhering to assumptions from Little’s Law for maintaining process predictability and introduces Monte Carlo simulations for forecasting project timelines. The overall aim is to enhance flow management and resource efficiency in project delivery.


![[Talk] Manage flow - Metrics and Analytics for predictability and flow](https://cdn.slidesharecdn.com/ss_thumbnails/lkna-manageflow-metricsandanalyticsforpredictabilityandflow-190527041051-thumbnail.jpg?width=640&height=640&fit=bounds)


