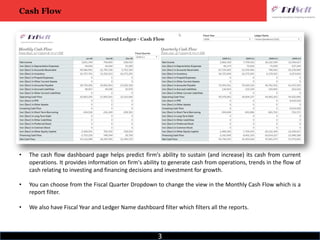
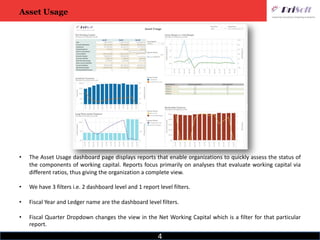
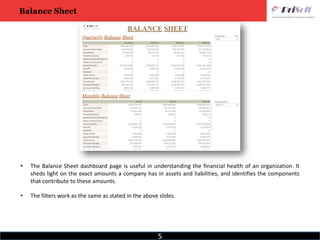
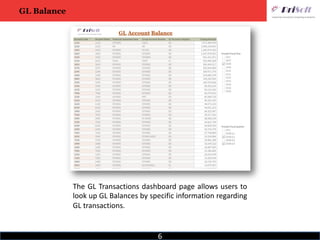
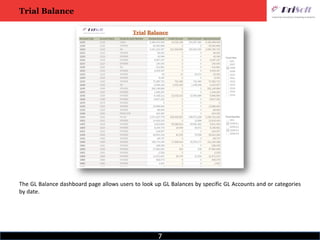
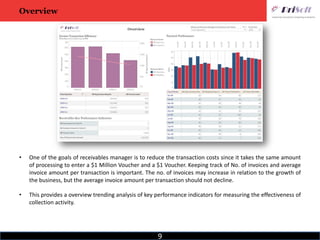
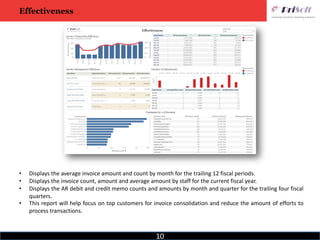
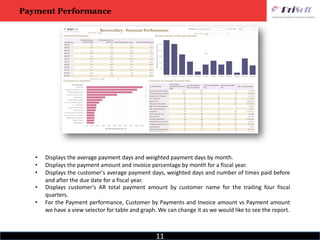
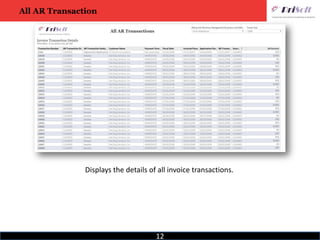
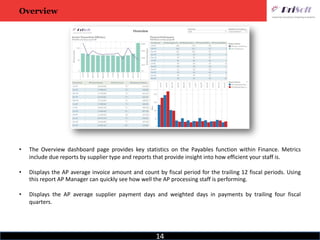
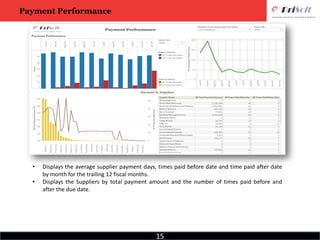
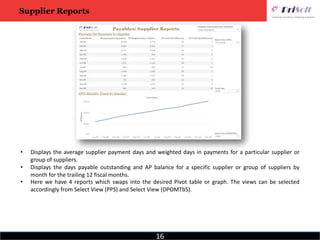
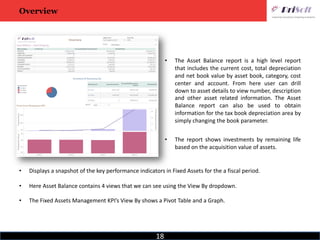
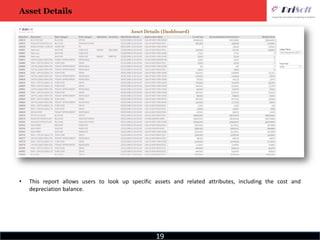
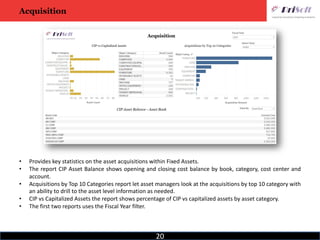
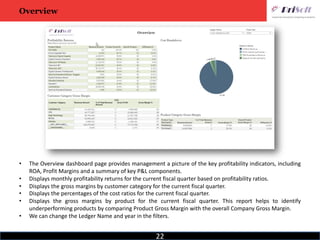
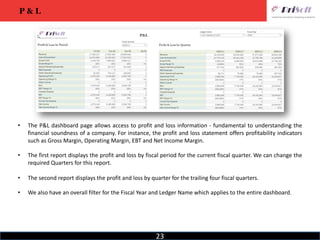
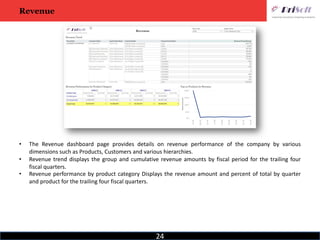
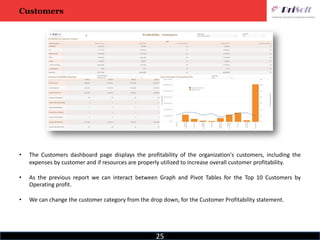
SlideShare a Scribd company logo
www.prisoft.com
2
3
• The cash flow dashboard page helps predict firm's ability to sustain (and increase) its cash from current
operations. It provides information on firm's ability to generate cash from operations, trends in the flow of
cash relating to investing and financing decisions and investment for growth.
• You can choose from the Fiscal Quarter Dropdown to change the view in the Monthly Cash Flow which is a
report filter.
• We also have Fiscal Year and Ledger Name dashboard filter which filters all the reports.
Cash Flow
4
Asset Usage
• The Asset Usage dashboard page displays reports that enable organizations to quickly assess the status of
the components of working capital. Reports focus primarily on analyses that evaluate working capital via
different ratios, thus giving the organization a complete view.
• We have 3 filters i.e. 2 dashboard level and 1 report level filters.
• Fiscal Year and Ledger name are the dashboard level filters.
• Fiscal Quarter Dropdown changes the view in the Net Working Capital which is a filter for that particular
report.
5
Balance Sheet
• The Balance Sheet dashboard page is useful in understanding the financial health of an organization. It
sheds light on the exact amounts a company has in assets and liabilities, and identifies the components
that contribute to these amounts.
• The filters work as the same as stated in the above slides.
6
The GL Transactions dashboard page allows users to
look up GL Balances by specific information regarding
GL transactions.
GL Balance
7
Trial Balance
The GL Balance dashboard page allows users to look up GL Balances by specific GL Accounts and or categories
by date.
8
9
Overview
• One of the goals of receivables manager is to reduce the transaction costs since it takes the same amount
of processing to enter a $1 Million Voucher and a $1 Voucher. Keeping track of No. of invoices and average
invoice amount per transaction is important. The no. of invoices may increase in relation to the growth of
the business, but the average invoice amount per transaction should not decline.
• This provides a overview trending analysis of key performance indicators for measuring the effectiveness of
collection activity.
10
Effectiveness
• Displays the average invoice amount and count by month for the trailing 12 fiscal periods.
• Displays the invoice count, amount and average amount by staff for the current fiscal year.
• Displays the AR debit and credit memo counts and amounts by month and quarter for the trailing four fiscal
quarters.
• This report will help focus on top customers for invoice consolidation and reduce the amount of efforts to
process transactions.
11
Payment Performance
• Displays the average payment days and weighted payment days by month.
• Displays the payment amount and invoice percentage by month for a fiscal year.
• Displays the customer's average payment days, weighted days and number of times paid before
and after the due date for a fiscal year.
• Displays customer's AR total payment amount by customer name for the trailing four fiscal
quarters.
• For the Payment performance, Customer by Payments and Invoice amount vs Payment amount
we have a view selector for table and graph. We can change it as we would like to see the report.
12
Displays the details of all invoice transactions.
All AR Transaction
13
14
Overview
• The Overview dashboard page provides key statistics on the Payables function within Finance. Metrics
include due reports by supplier type and reports that provide insight into how efficient your staff is.
• Displays the AP average invoice amount and count by fiscal period for the trailing 12 fiscal periods. Using
this report AP Manager can quickly see how well the AP processing staff is performing.
• Displays the AP average supplier payment days and weighted days in payments by trailing four fiscal
quarters.
15
Payment Performance
• Displays the average supplier payment days, times paid before date and time paid after date
by month for the trailing 12 fiscal months.
• Displays the Suppliers by total payment amount and the number of times paid before and
after the due date.
16
• Displays the average supplier payment days and weighted days in payments for a particular supplier or
group of suppliers.
• Displays the days payable outstanding and AP balance for a specific supplier or group of suppliers by
month for the trailing 12 fiscal months.
• Here we have 4 reports which swaps into the desired Pivot table or graph. The views can be selected
accordingly from Select View (PPS) and Select View (DPOMTbS).
Supplier Reports
17
18
Overview
• The Asset Balance report is a high level report
that includes the current cost, total depreciation
and net book value by asset book, category, cost
center and account. From here user can drill
down to asset details to view number, description
and other asset related information. The Asset
Balance report can also be used to obtain
information for the tax book depreciation area by
simply changing the book parameter.
• The report shows investments by remaining life
based on the acquisition value of assets.
• Displays a snapshot of the key performance indicators in Fixed Assets for the a fiscal period.
• Here Asset Balance contains 4 views that we can see using the View By dropdown.
• The Fixed Assets Management KPI’s View By shows a Pivot Table and a Graph.
19
Asset Details
• This report allows users to look up specific assets and related attributes, including the cost and
depreciation balance.
20
Acquisition
• Provides key statistics on the asset acquisitions within Fixed Assets.
• The report CIP Asset Balance shows opening and closing cost balance by book, category, cost center and
account.
• Acquisitions by Top 10 Categories report let asset managers look at the acquisitions by top 10 category with
an ability to drill to the asset level information as needed.
• CIP vs Capitalized Assets the report shows percentage of CIP vs capitalized assets by asset category.
• The first two reports uses the Fiscal Year filter.
21
22
• The Overview dashboard page provides management a picture of the key profitability indicators, including
ROA, Profit Margins and a summary of key P&L components.
• Displays monthly profitability returns for the current fiscal quarter based on profitability ratios.
• Displays the gross margins by customer category for the current fiscal quarter.
• Displays the percentages of the cost ratios for the current fiscal quarter.
• Displays the gross margins by product for the current fiscal quarter. This report helps to identify
underperforming products by comparing Product Gross Margin with the overall Company Gross Margin.
• We can change the Ledger Name and year in the filters.
Overview
23
• The P&L dashboard page allows access to profit and loss information - fundamental to understanding the
financial soundness of a company. For instance, the profit and loss statement offers profitability indicators
such as Gross Margin, Operating Margin, EBT and Net Income Margin.
• The first report displays the profit and loss by fiscal period for the current fiscal quarter. We can change the
required Quarters for this report.
• The second report displays the profit and loss by quarter for the trailing four fiscal quarters.
• We also have an overall filter for the Fiscal Year and Ledger Name which applies to the entire dashboard.
P & L
24
Revenue
• The Revenue dashboard page provides details on revenue performance of the company by various
dimensions such as Products, Customers and various hierarchies.
• Revenue trend displays the group and cumulative revenue amounts by fiscal period for the trailing four
fiscal quarters.
• Revenue performance by product category Displays the revenue amount and percent of total by quarter
and product for the trailing four fiscal quarters.
25
Customers
• The Customers dashboard page displays the profitability of the organization's customers, including the
expenses by customer and if resources are properly utilized to increase overall customer profitability.
• As the previous report we can interact between Graph and Pivot Tables for the Top 10 Customers by
Operating profit.
• We can change the customer category from the drop down, for the Customer Profitability statement.
26

More Related Content

What's hot

Accounting Firm Singapore
Accounting Firm SingaporeAccounting Firm Singapore
Accounting Firm Singapore
YK Global Pte. Ltd.
 
Financial accounting vs management accounting By Aneek Gupta
Financial accounting vs management accounting By Aneek GuptaFinancial accounting vs management accounting By Aneek Gupta
Financial accounting vs management accounting By Aneek Gupta
Dr Aneek Gupta
 
Presentation of financial statements 07 08-07
Presentation of financial statements 07 08-07Presentation of financial statements 07 08-07
Presentation of financial statements 07 08-07premsruthi
 
Fixed assets enduser_training_manual
Fixed assets enduser_training_manualFixed assets enduser_training_manual
Fixed assets enduser_training_manualRoshan55
 
Economy and politics
Economy and politicsEconomy and politics
Economy and politics
Real Estate Services
 
Financial analysis
Financial analysisFinancial analysis
Financial analysis
Real Estate Services
 
Accounting Information System (AIS)
Accounting Information System (AIS)Accounting Information System (AIS)
Accounting Information System (AIS)
Osareme Erhomosele
 
Ais Romney 2006 Slides 14 General Ledger And Reporting System
Ais Romney 2006 Slides 14 General Ledger And Reporting SystemAis Romney 2006 Slides 14 General Ledger And Reporting System
Ais Romney 2006 Slides 14 General Ledger And Reporting System
Sharing Slides Training
 
Chart Of Accounts Considerations
Chart Of Accounts ConsiderationsChart Of Accounts Considerations
Chart Of Accounts Considerations
duffyri
 
Sap fi overview
Sap fi overviewSap fi overview
Sap fi overview
compugrainc
 
SAP FICO Overview
SAP FICO OverviewSAP FICO Overview
SAP FICO Overview
Vikram P Madduri
 
Accounting for Managers - Brief Overview
Accounting for Managers - Brief OverviewAccounting for Managers - Brief Overview
Accounting for Managers - Brief Overview
'Nipun Jain'
 
Sap Best Practices Financial Accounting
Sap Best Practices Financial AccountingSap Best Practices Financial Accounting
Sap Best Practices Financial AccountingPamela Meyers
 
SAP - FIXED ASSETS ACCOUNTING
SAP - FIXED ASSETS ACCOUNTINGSAP - FIXED ASSETS ACCOUNTING
SAP - FIXED ASSETS ACCOUNTING
saiprasadbagrecha
 
Kap7a
Kap7aKap7a
Kap7a
Rajesh Kv
 
SAP FICO Online Training
SAP FICO Online Training SAP FICO Online Training
SAP FICO Online Training
Thanusha154
 
Fico ppt
Fico  pptFico  ppt
Fico ppt
sriram022
 
Management Accounting: An Overview
Management Accounting: An OverviewManagement Accounting: An Overview
Management Accounting: An OverviewAshish Srivastava
 
Annual report
Annual reportAnnual report
Annual report
Jaladhi Shukla
 

What's hot (19)

Accounting Firm Singapore
Accounting Firm SingaporeAccounting Firm Singapore
Accounting Firm Singapore
 
Financial accounting vs management accounting By Aneek Gupta
Financial accounting vs management accounting By Aneek GuptaFinancial accounting vs management accounting By Aneek Gupta
Financial accounting vs management accounting By Aneek Gupta
 
Presentation of financial statements 07 08-07
Presentation of financial statements 07 08-07Presentation of financial statements 07 08-07
Presentation of financial statements 07 08-07
 
Fixed assets enduser_training_manual
Fixed assets enduser_training_manualFixed assets enduser_training_manual
Fixed assets enduser_training_manual
 
Economy and politics
Economy and politicsEconomy and politics
Economy and politics
 
Financial analysis
Financial analysisFinancial analysis
Financial analysis
 
Accounting Information System (AIS)
Accounting Information System (AIS)Accounting Information System (AIS)
Accounting Information System (AIS)
 
Ais Romney 2006 Slides 14 General Ledger And Reporting System
Ais Romney 2006 Slides 14 General Ledger And Reporting SystemAis Romney 2006 Slides 14 General Ledger And Reporting System
Ais Romney 2006 Slides 14 General Ledger And Reporting System
 
Chart Of Accounts Considerations
Chart Of Accounts ConsiderationsChart Of Accounts Considerations
Chart Of Accounts Considerations
 
Sap fi overview
Sap fi overviewSap fi overview
Sap fi overview
 
SAP FICO Overview
SAP FICO OverviewSAP FICO Overview
SAP FICO Overview
 
Accounting for Managers - Brief Overview
Accounting for Managers - Brief OverviewAccounting for Managers - Brief Overview
Accounting for Managers - Brief Overview
 
Sap Best Practices Financial Accounting
Sap Best Practices Financial AccountingSap Best Practices Financial Accounting
Sap Best Practices Financial Accounting
 
SAP - FIXED ASSETS ACCOUNTING
SAP - FIXED ASSETS ACCOUNTINGSAP - FIXED ASSETS ACCOUNTING
SAP - FIXED ASSETS ACCOUNTING
 
Kap7a
Kap7aKap7a
Kap7a
 
SAP FICO Online Training
SAP FICO Online Training SAP FICO Online Training
SAP FICO Online Training
 
Fico ppt
Fico  pptFico  ppt
Fico ppt
 
Management Accounting: An Overview
Management Accounting: An OverviewManagement Accounting: An Overview
Management Accounting: An Overview
 
Annual report
Annual reportAnnual report
Annual report
 

Similar to Prisoft Financial Analytics

UNIT-IV MEASURING BUSINESS PERFORMANCE..
UNIT-IV MEASURING BUSINESS PERFORMANCE..UNIT-IV MEASURING BUSINESS PERFORMANCE..
UNIT-IV MEASURING BUSINESS PERFORMANCE..
pushpait
 
Basic accounting and financial management
Basic accounting and financial managementBasic accounting and financial management
Basic accounting and financial management
Kolej Professional Mara Indera Mahkota
 
Financial Statements and Business Model Canvas_Nov5th.pptx
Financial Statements and Business Model Canvas_Nov5th.pptxFinancial Statements and Business Model Canvas_Nov5th.pptx
Financial Statements and Business Model Canvas_Nov5th.pptx
Rashmi Gowda KM
 
The Basics of FINANCIAL STATEMENTS for Agricultural Producers
The Basics of FINANCIAL STATEMENTS for Agricultural ProducersThe Basics of FINANCIAL STATEMENTS for Agricultural Producers
The Basics of FINANCIAL STATEMENTS for Agricultural Producers
KUNWAR THAKUR
 
Financial reporting
Financial reportingFinancial reporting
Financial reporting
MaryamAslam25
 
Ais Romney 2006 Slides 14 General Ledger And Reporting System
Ais Romney 2006 Slides 14 General Ledger And Reporting SystemAis Romney 2006 Slides 14 General Ledger And Reporting System
Ais Romney 2006 Slides 14 General Ledger And Reporting System
sharing notes123
 
Chap017.ppt
Chap017.pptChap017.ppt
Chap017.ppt
SMUddin3
 
Accounting For Managers.pptx
Accounting For Managers.pptxAccounting For Managers.pptx
Accounting For Managers.pptx
imswapnil229
 
Introduction to Business Accounting and Ratios
Introduction to Business Accounting and RatiosIntroduction to Business Accounting and Ratios
Introduction to Business Accounting and Ratios
Hazman Mat
 
Financial statements
Financial statementsFinancial statements
Financial statements
Pankaj Modi
 
Basics of accounting
Basics of accountingBasics of accounting
Basics of accounting
Joshua Sevilla
 
Week 6 Slides (3) (1).pptx
Week 6 Slides (3) (1).pptxWeek 6 Slides (3) (1).pptx
Week 6 Slides (3) (1).pptx
kwame Oduro Amoako (PhD)
 
Financial accounting
Financial accountingFinancial accounting
Financial accounting
Reba Das
 
Financial Statement Analysis
Financial Statement AnalysisFinancial Statement Analysis
Financial Statement AnalysisKevinson Tenjo
 
The Financial Analysis House©: from data to dashboards
The Financial Analysis House©: from data to dashboardsThe Financial Analysis House©: from data to dashboards
The Financial Analysis House©: from data to dashboards
Dr. Basel Omar Abu-Ali
 
Objective and Types of Financial Statements
Objective and Types of Financial StatementsObjective and Types of Financial Statements
Objective and Types of Financial Statements
Bench Mate
 
Cb12e basic ppt ch16
Cb12e basic ppt ch16Cb12e basic ppt ch16
Cb12e basic ppt ch16Eric
 
Accounting basics .pptx
Accounting basics .pptxAccounting basics .pptx
Accounting basics .pptx
MostafaGamal216952
 

Similar to Prisoft Financial Analytics (20)

UNIT-IV MEASURING BUSINESS PERFORMANCE..
UNIT-IV MEASURING BUSINESS PERFORMANCE..UNIT-IV MEASURING BUSINESS PERFORMANCE..
UNIT-IV MEASURING BUSINESS PERFORMANCE..
 
Basic accounting and financial management
Basic accounting and financial managementBasic accounting and financial management
Basic accounting and financial management
 
Financial Statements and Business Model Canvas_Nov5th.pptx
Financial Statements and Business Model Canvas_Nov5th.pptxFinancial Statements and Business Model Canvas_Nov5th.pptx
Financial Statements and Business Model Canvas_Nov5th.pptx
 
The Basics of FINANCIAL STATEMENTS for Agricultural Producers
The Basics of FINANCIAL STATEMENTS for Agricultural ProducersThe Basics of FINANCIAL STATEMENTS for Agricultural Producers
The Basics of FINANCIAL STATEMENTS for Agricultural Producers
 
Financial reporting
Financial reportingFinancial reporting
Financial reporting
 
Ais Romney 2006 Slides 14 General Ledger And Reporting System
Ais Romney 2006 Slides 14 General Ledger And Reporting SystemAis Romney 2006 Slides 14 General Ledger And Reporting System
Ais Romney 2006 Slides 14 General Ledger And Reporting System
 
6 ratio analysis
6   ratio analysis6   ratio analysis
6 ratio analysis
 
Chap017.ppt
Chap017.pptChap017.ppt
Chap017.ppt
 
Accounting For Managers.pptx
Accounting For Managers.pptxAccounting For Managers.pptx
Accounting For Managers.pptx
 
Introduction to Business Accounting and Ratios
Introduction to Business Accounting and RatiosIntroduction to Business Accounting and Ratios
Introduction to Business Accounting and Ratios
 
Financial statements
Financial statementsFinancial statements
Financial statements
 
Basics of accounting
Basics of accountingBasics of accounting
Basics of accounting
 
Week 6 Slides (3) (1).pptx
Week 6 Slides (3) (1).pptxWeek 6 Slides (3) (1).pptx
Week 6 Slides (3) (1).pptx
 
Financial accounting
Financial accountingFinancial accounting
Financial accounting
 
Financial Statement Analysis
Financial Statement AnalysisFinancial Statement Analysis
Financial Statement Analysis
 
The Financial Analysis House©: from data to dashboards
The Financial Analysis House©: from data to dashboardsThe Financial Analysis House©: from data to dashboards
The Financial Analysis House©: from data to dashboards
 
Objective and Types of Financial Statements
Objective and Types of Financial StatementsObjective and Types of Financial Statements
Objective and Types of Financial Statements
 
Cb12e basic ppt ch16
Cb12e basic ppt ch16Cb12e basic ppt ch16
Cb12e basic ppt ch16
 
Chapter05
Chapter05Chapter05
Chapter05
 
Accounting basics .pptx
Accounting basics .pptxAccounting basics .pptx
Accounting basics .pptx
 

Recently uploaded

Jpolillo Amazon PPC - Bid Optimization Sample
Jpolillo Amazon PPC - Bid Optimization SampleJpolillo Amazon PPC - Bid Optimization Sample
Jpolillo Amazon PPC - Bid Optimization Sample
James Polillo
 
Adjusting primitives for graph : SHORT REPORT / NOTES
Adjusting primitives for graph : SHORT REPORT / NOTESAdjusting primitives for graph : SHORT REPORT / NOTES
Adjusting primitives for graph : SHORT REPORT / NOTES
Subhajit Sahu
 
一比一原版(QU毕业证)皇后大学毕业证成绩单
一比一原版(QU毕业证)皇后大学毕业证成绩单一比一原版(QU毕业证)皇后大学毕业证成绩单
一比一原版(QU毕业证)皇后大学毕业证成绩单
enxupq
 
一比一原版(CU毕业证)卡尔顿大学毕业证成绩单
一比一原版(CU毕业证)卡尔顿大学毕业证成绩单一比一原版(CU毕业证)卡尔顿大学毕业证成绩单
一比一原版(CU毕业证)卡尔顿大学毕业证成绩单
yhkoc
 
一比一原版(TWU毕业证)西三一大学毕业证成绩单
一比一原版(TWU毕业证)西三一大学毕业证成绩单一比一原版(TWU毕业证)西三一大学毕业证成绩单
一比一原版(TWU毕业证)西三一大学毕业证成绩单
ocavb
 
社内勉強会資料_LLM Agents                              .
社内勉強会資料_LLM Agents                              .社内勉強会資料_LLM Agents                              .
社内勉強会資料_LLM Agents                              .
NABLAS株式会社
 
Sample_Global Non-invasive Prenatal Testing (NIPT) Market, 2019-2030.pdf
Sample_Global Non-invasive Prenatal Testing (NIPT) Market, 2019-2030.pdfSample_Global Non-invasive Prenatal Testing (NIPT) Market, 2019-2030.pdf
Sample_Global Non-invasive Prenatal Testing (NIPT) Market, 2019-2030.pdf
Linda486226
 
Innovative Methods in Media and Communication Research by Sebastian Kubitschk...
Innovative Methods in Media and Communication Research by Sebastian Kubitschk...Innovative Methods in Media and Communication Research by Sebastian Kubitschk...
Innovative Methods in Media and Communication Research by Sebastian Kubitschk...
correoyaya
 
一比一原版(RUG毕业证)格罗宁根大学毕业证成绩单
一比一原版(RUG毕业证)格罗宁根大学毕业证成绩单一比一原版(RUG毕业证)格罗宁根大学毕业证成绩单
一比一原版(RUG毕业证)格罗宁根大学毕业证成绩单
vcaxypu
 
Criminal IP - Threat Hunting Webinar.pdf
Criminal IP - Threat Hunting Webinar.pdfCriminal IP - Threat Hunting Webinar.pdf
Criminal IP - Threat Hunting Webinar.pdf
Criminal IP
 
Tabula.io Cheatsheet: automate your data workflows
Tabula.io Cheatsheet: automate your data workflowsTabula.io Cheatsheet: automate your data workflows
Tabula.io Cheatsheet: automate your data workflows
alex933524
 
一比一原版(CBU毕业证)不列颠海角大学毕业证成绩单
一比一原版(CBU毕业证)不列颠海角大学毕业证成绩单一比一原版(CBU毕业证)不列颠海角大学毕业证成绩单
一比一原版(CBU毕业证)不列颠海角大学毕业证成绩单
nscud
 
一比一原版(BU毕业证)波士顿大学毕业证成绩单
一比一原版(BU毕业证)波士顿大学毕业证成绩单一比一原版(BU毕业证)波士顿大学毕业证成绩单
一比一原版(BU毕业证)波士顿大学毕业证成绩单
ewymefz
 
standardisation of garbhpala offhgfffghh
standardisation of garbhpala offhgfffghhstandardisation of garbhpala offhgfffghh
standardisation of garbhpala offhgfffghh
ArpitMalhotra16
 
【社内勉強会資料_Octo: An Open-Source Generalist Robot Policy】
【社内勉強会資料_Octo: An Open-Source Generalist Robot Policy】【社内勉強会資料_Octo: An Open-Source Generalist Robot Policy】
【社内勉強会資料_Octo: An Open-Source Generalist Robot Policy】
NABLAS株式会社
 
Predicting Product Ad Campaign Performance: A Data Analysis Project Presentation
Predicting Product Ad Campaign Performance: A Data Analysis Project PresentationPredicting Product Ad Campaign Performance: A Data Analysis Project Presentation
Predicting Product Ad Campaign Performance: A Data Analysis Project Presentation
Boston Institute of Analytics
 
一比一原版(UVic毕业证)维多利亚大学毕业证成绩单
一比一原版(UVic毕业证)维多利亚大学毕业证成绩单一比一原版(UVic毕业证)维多利亚大学毕业证成绩单
一比一原版(UVic毕业证)维多利亚大学毕业证成绩单
ukgaet
 
Chatty Kathy - UNC Bootcamp Final Project Presentation - Final Version - 5.23...
Chatty Kathy - UNC Bootcamp Final Project Presentation - Final Version - 5.23...Chatty Kathy - UNC Bootcamp Final Project Presentation - Final Version - 5.23...
Chatty Kathy - UNC Bootcamp Final Project Presentation - Final Version - 5.23...
John Andrews
 
做(mqu毕业证书)麦考瑞大学毕业证硕士文凭证书学费发票原版一模一样
做(mqu毕业证书)麦考瑞大学毕业证硕士文凭证书学费发票原版一模一样做(mqu毕业证书)麦考瑞大学毕业证硕士文凭证书学费发票原版一模一样
做(mqu毕业证书)麦考瑞大学毕业证硕士文凭证书学费发票原版一模一样
axoqas
 
哪里卖(usq毕业证书)南昆士兰大学毕业证研究生文凭证书托福证书原版一模一样
哪里卖(usq毕业证书)南昆士兰大学毕业证研究生文凭证书托福证书原版一模一样哪里卖(usq毕业证书)南昆士兰大学毕业证研究生文凭证书托福证书原版一模一样
哪里卖(usq毕业证书)南昆士兰大学毕业证研究生文凭证书托福证书原版一模一样
axoqas
 

Recently uploaded (20)

Jpolillo Amazon PPC - Bid Optimization Sample
Jpolillo Amazon PPC - Bid Optimization SampleJpolillo Amazon PPC - Bid Optimization Sample
Jpolillo Amazon PPC - Bid Optimization Sample
 
Adjusting primitives for graph : SHORT REPORT / NOTES
Adjusting primitives for graph : SHORT REPORT / NOTESAdjusting primitives for graph : SHORT REPORT / NOTES
Adjusting primitives for graph : SHORT REPORT / NOTES
 
一比一原版(QU毕业证)皇后大学毕业证成绩单
一比一原版(QU毕业证)皇后大学毕业证成绩单一比一原版(QU毕业证)皇后大学毕业证成绩单
一比一原版(QU毕业证)皇后大学毕业证成绩单
 
一比一原版(CU毕业证)卡尔顿大学毕业证成绩单
一比一原版(CU毕业证)卡尔顿大学毕业证成绩单一比一原版(CU毕业证)卡尔顿大学毕业证成绩单
一比一原版(CU毕业证)卡尔顿大学毕业证成绩单
 
一比一原版(TWU毕业证)西三一大学毕业证成绩单
一比一原版(TWU毕业证)西三一大学毕业证成绩单一比一原版(TWU毕业证)西三一大学毕业证成绩单
一比一原版(TWU毕业证)西三一大学毕业证成绩单
 
社内勉強会資料_LLM Agents                              .
社内勉強会資料_LLM Agents                              .社内勉強会資料_LLM Agents                              .
社内勉強会資料_LLM Agents                              .
 
Sample_Global Non-invasive Prenatal Testing (NIPT) Market, 2019-2030.pdf
Sample_Global Non-invasive Prenatal Testing (NIPT) Market, 2019-2030.pdfSample_Global Non-invasive Prenatal Testing (NIPT) Market, 2019-2030.pdf
Sample_Global Non-invasive Prenatal Testing (NIPT) Market, 2019-2030.pdf
 
Innovative Methods in Media and Communication Research by Sebastian Kubitschk...
Innovative Methods in Media and Communication Research by Sebastian Kubitschk...Innovative Methods in Media and Communication Research by Sebastian Kubitschk...
Innovative Methods in Media and Communication Research by Sebastian Kubitschk...
 
一比一原版(RUG毕业证)格罗宁根大学毕业证成绩单
一比一原版(RUG毕业证)格罗宁根大学毕业证成绩单一比一原版(RUG毕业证)格罗宁根大学毕业证成绩单
一比一原版(RUG毕业证)格罗宁根大学毕业证成绩单
 
Criminal IP - Threat Hunting Webinar.pdf
Criminal IP - Threat Hunting Webinar.pdfCriminal IP - Threat Hunting Webinar.pdf
Criminal IP - Threat Hunting Webinar.pdf
 
Tabula.io Cheatsheet: automate your data workflows
Tabula.io Cheatsheet: automate your data workflowsTabula.io Cheatsheet: automate your data workflows
Tabula.io Cheatsheet: automate your data workflows
 
一比一原版(CBU毕业证)不列颠海角大学毕业证成绩单
一比一原版(CBU毕业证)不列颠海角大学毕业证成绩单一比一原版(CBU毕业证)不列颠海角大学毕业证成绩单
一比一原版(CBU毕业证)不列颠海角大学毕业证成绩单
 
一比一原版(BU毕业证)波士顿大学毕业证成绩单
一比一原版(BU毕业证)波士顿大学毕业证成绩单一比一原版(BU毕业证)波士顿大学毕业证成绩单
一比一原版(BU毕业证)波士顿大学毕业证成绩单
 
standardisation of garbhpala offhgfffghh
standardisation of garbhpala offhgfffghhstandardisation of garbhpala offhgfffghh
standardisation of garbhpala offhgfffghh
 
【社内勉強会資料_Octo: An Open-Source Generalist Robot Policy】
【社内勉強会資料_Octo: An Open-Source Generalist Robot Policy】【社内勉強会資料_Octo: An Open-Source Generalist Robot Policy】
【社内勉強会資料_Octo: An Open-Source Generalist Robot Policy】
 
Predicting Product Ad Campaign Performance: A Data Analysis Project Presentation
Predicting Product Ad Campaign Performance: A Data Analysis Project PresentationPredicting Product Ad Campaign Performance: A Data Analysis Project Presentation
Predicting Product Ad Campaign Performance: A Data Analysis Project Presentation
 
一比一原版(UVic毕业证)维多利亚大学毕业证成绩单
一比一原版(UVic毕业证)维多利亚大学毕业证成绩单一比一原版(UVic毕业证)维多利亚大学毕业证成绩单
一比一原版(UVic毕业证)维多利亚大学毕业证成绩单
 
Chatty Kathy - UNC Bootcamp Final Project Presentation - Final Version - 5.23...
Chatty Kathy - UNC Bootcamp Final Project Presentation - Final Version - 5.23...Chatty Kathy - UNC Bootcamp Final Project Presentation - Final Version - 5.23...
Chatty Kathy - UNC Bootcamp Final Project Presentation - Final Version - 5.23...
 
做(mqu毕业证书)麦考瑞大学毕业证硕士文凭证书学费发票原版一模一样
做(mqu毕业证书)麦考瑞大学毕业证硕士文凭证书学费发票原版一模一样做(mqu毕业证书)麦考瑞大学毕业证硕士文凭证书学费发票原版一模一样
做(mqu毕业证书)麦考瑞大学毕业证硕士文凭证书学费发票原版一模一样
 
哪里卖(usq毕业证书)南昆士兰大学毕业证研究生文凭证书托福证书原版一模一样
哪里卖(usq毕业证书)南昆士兰大学毕业证研究生文凭证书托福证书原版一模一样哪里卖(usq毕业证书)南昆士兰大学毕业证研究生文凭证书托福证书原版一模一样
哪里卖(usq毕业证书)南昆士兰大学毕业证研究生文凭证书托福证书原版一模一样
 

Prisoft Financial Analytics

  • 2. 2
  • 3. 3 • The cash flow dashboard page helps predict firm's ability to sustain (and increase) its cash from current operations. It provides information on firm's ability to generate cash from operations, trends in the flow of cash relating to investing and financing decisions and investment for growth. • You can choose from the Fiscal Quarter Dropdown to change the view in the Monthly Cash Flow which is a report filter. • We also have Fiscal Year and Ledger Name dashboard filter which filters all the reports. Cash Flow
  • 4. 4 Asset Usage • The Asset Usage dashboard page displays reports that enable organizations to quickly assess the status of the components of working capital. Reports focus primarily on analyses that evaluate working capital via different ratios, thus giving the organization a complete view. • We have 3 filters i.e. 2 dashboard level and 1 report level filters. • Fiscal Year and Ledger name are the dashboard level filters. • Fiscal Quarter Dropdown changes the view in the Net Working Capital which is a filter for that particular report.
  • 5. 5 Balance Sheet • The Balance Sheet dashboard page is useful in understanding the financial health of an organization. It sheds light on the exact amounts a company has in assets and liabilities, and identifies the components that contribute to these amounts. • The filters work as the same as stated in the above slides.
  • 6. 6 The GL Transactions dashboard page allows users to look up GL Balances by specific information regarding GL transactions. GL Balance
  • 7. 7 Trial Balance The GL Balance dashboard page allows users to look up GL Balances by specific GL Accounts and or categories by date.
  • 8. 8
  • 9. 9 Overview • One of the goals of receivables manager is to reduce the transaction costs since it takes the same amount of processing to enter a $1 Million Voucher and a $1 Voucher. Keeping track of No. of invoices and average invoice amount per transaction is important. The no. of invoices may increase in relation to the growth of the business, but the average invoice amount per transaction should not decline. • This provides a overview trending analysis of key performance indicators for measuring the effectiveness of collection activity.
  • 10. 10 Effectiveness • Displays the average invoice amount and count by month for the trailing 12 fiscal periods. • Displays the invoice count, amount and average amount by staff for the current fiscal year. • Displays the AR debit and credit memo counts and amounts by month and quarter for the trailing four fiscal quarters. • This report will help focus on top customers for invoice consolidation and reduce the amount of efforts to process transactions.
  • 11. 11 Payment Performance • Displays the average payment days and weighted payment days by month. • Displays the payment amount and invoice percentage by month for a fiscal year. • Displays the customer's average payment days, weighted days and number of times paid before and after the due date for a fiscal year. • Displays customer's AR total payment amount by customer name for the trailing four fiscal quarters. • For the Payment performance, Customer by Payments and Invoice amount vs Payment amount we have a view selector for table and graph. We can change it as we would like to see the report.
  • 12. 12 Displays the details of all invoice transactions. All AR Transaction
  • 13. 13
  • 14. 14 Overview • The Overview dashboard page provides key statistics on the Payables function within Finance. Metrics include due reports by supplier type and reports that provide insight into how efficient your staff is. • Displays the AP average invoice amount and count by fiscal period for the trailing 12 fiscal periods. Using this report AP Manager can quickly see how well the AP processing staff is performing. • Displays the AP average supplier payment days and weighted days in payments by trailing four fiscal quarters.
  • 15. 15 Payment Performance • Displays the average supplier payment days, times paid before date and time paid after date by month for the trailing 12 fiscal months. • Displays the Suppliers by total payment amount and the number of times paid before and after the due date.
  • 16. 16 • Displays the average supplier payment days and weighted days in payments for a particular supplier or group of suppliers. • Displays the days payable outstanding and AP balance for a specific supplier or group of suppliers by month for the trailing 12 fiscal months. • Here we have 4 reports which swaps into the desired Pivot table or graph. The views can be selected accordingly from Select View (PPS) and Select View (DPOMTbS). Supplier Reports
  • 17. 17
  • 18. 18 Overview • The Asset Balance report is a high level report that includes the current cost, total depreciation and net book value by asset book, category, cost center and account. From here user can drill down to asset details to view number, description and other asset related information. The Asset Balance report can also be used to obtain information for the tax book depreciation area by simply changing the book parameter. • The report shows investments by remaining life based on the acquisition value of assets. • Displays a snapshot of the key performance indicators in Fixed Assets for the a fiscal period. • Here Asset Balance contains 4 views that we can see using the View By dropdown. • The Fixed Assets Management KPI’s View By shows a Pivot Table and a Graph.
  • 19. 19 Asset Details • This report allows users to look up specific assets and related attributes, including the cost and depreciation balance.
  • 20. 20 Acquisition • Provides key statistics on the asset acquisitions within Fixed Assets. • The report CIP Asset Balance shows opening and closing cost balance by book, category, cost center and account. • Acquisitions by Top 10 Categories report let asset managers look at the acquisitions by top 10 category with an ability to drill to the asset level information as needed. • CIP vs Capitalized Assets the report shows percentage of CIP vs capitalized assets by asset category. • The first two reports uses the Fiscal Year filter.
  • 21. 21
  • 22. 22 • The Overview dashboard page provides management a picture of the key profitability indicators, including ROA, Profit Margins and a summary of key P&L components. • Displays monthly profitability returns for the current fiscal quarter based on profitability ratios. • Displays the gross margins by customer category for the current fiscal quarter. • Displays the percentages of the cost ratios for the current fiscal quarter. • Displays the gross margins by product for the current fiscal quarter. This report helps to identify underperforming products by comparing Product Gross Margin with the overall Company Gross Margin. • We can change the Ledger Name and year in the filters. Overview
  • 23. 23 • The P&L dashboard page allows access to profit and loss information - fundamental to understanding the financial soundness of a company. For instance, the profit and loss statement offers profitability indicators such as Gross Margin, Operating Margin, EBT and Net Income Margin. • The first report displays the profit and loss by fiscal period for the current fiscal quarter. We can change the required Quarters for this report. • The second report displays the profit and loss by quarter for the trailing four fiscal quarters. • We also have an overall filter for the Fiscal Year and Ledger Name which applies to the entire dashboard. P & L
  • 24. 24 Revenue • The Revenue dashboard page provides details on revenue performance of the company by various dimensions such as Products, Customers and various hierarchies. • Revenue trend displays the group and cumulative revenue amounts by fiscal period for the trailing four fiscal quarters. • Revenue performance by product category Displays the revenue amount and percent of total by quarter and product for the trailing four fiscal quarters.
  • 25. 25 Customers • The Customers dashboard page displays the profitability of the organization's customers, including the expenses by customer and if resources are properly utilized to increase overall customer profitability. • As the previous report we can interact between Graph and Pivot Tables for the Top 10 Customers by Operating profit. • We can change the customer category from the drop down, for the Customer Profitability statement.
  • 26. 26