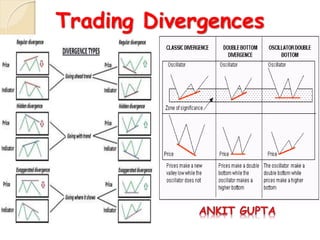
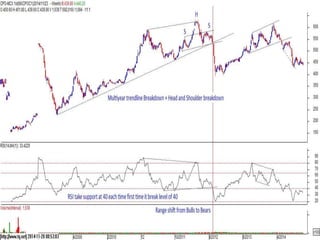
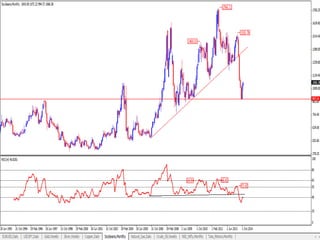
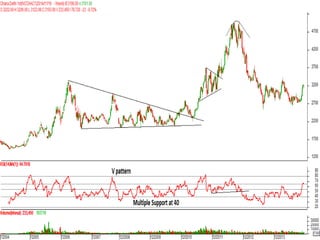
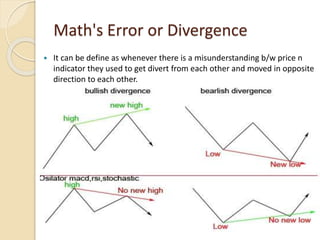
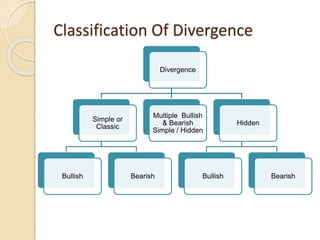
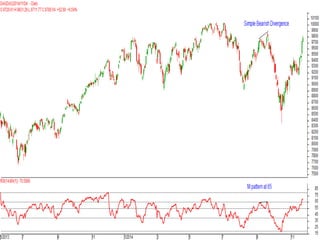
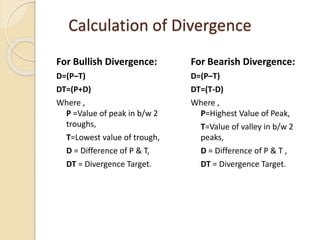
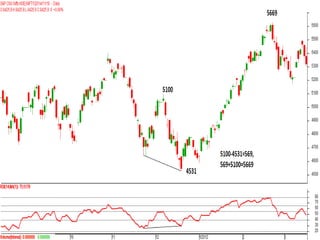
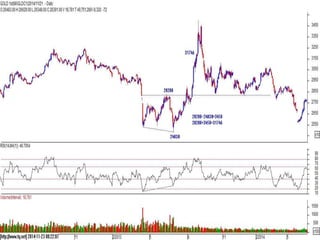
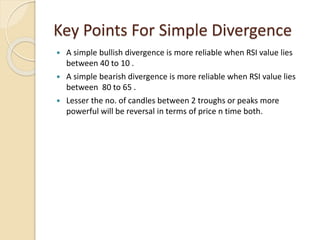
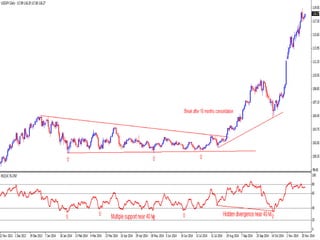
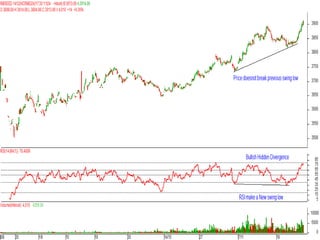
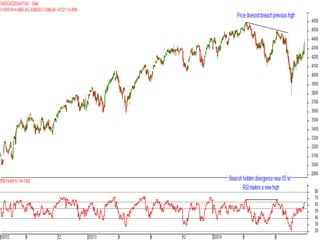
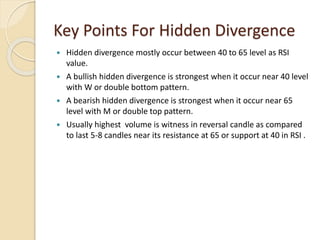
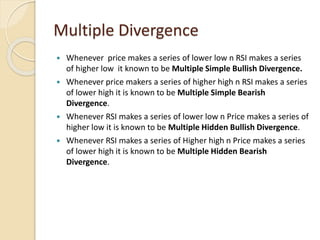
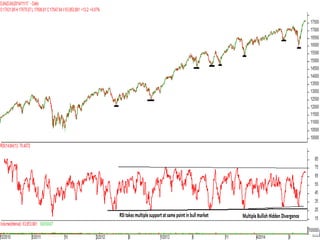
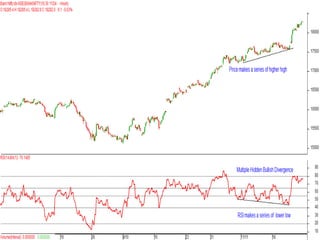
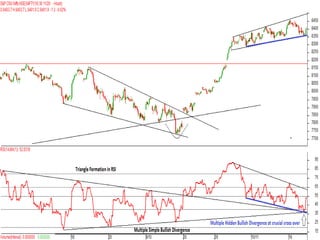
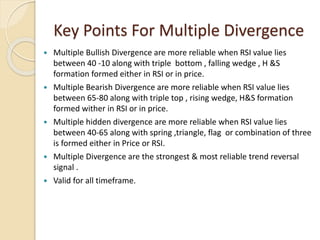
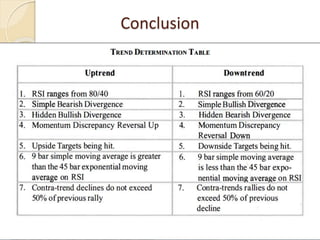
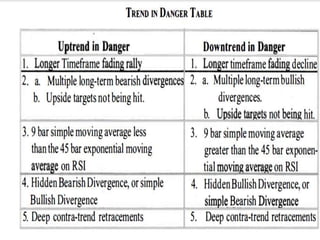
Trading Divergences
Topics:
 RSI
 RSI Math's
 Internal Characteristics
 Ratio Analysis
 Trend Determination
 Range Shift
 Various patterns n their Reliability.
 Math Error/Divergence
 Classification of Divergence.
 Simple Divergence
 Calculation of Divergence.
 Cheat sheet of Simple Divergence
 Hidden Divergence
 Cheat Sheet of Hidden Divergence
 Multiple Divergence
 Cheat Sheet of multiple Divergence
 Conclusion
Relative Strength Index(RSI)
 In June 1978, Welles Wilder introduced the Relative Strength
Index.
 It represents a ratio of the average 'gains' to the average 'losses'
calculated over a number of time periods.
 It is a formula based indicator which is usually assume to test the
strength and movement in the market.
 It is a range bound Oscillator which has upper boundary at 100 &
lower boundary at 0.
 RSI is considered overbought when above 70 and oversold when
below 30.
 Signals can also be generated by looking for divergences, failure
swings and centerline crossovers.
 RSI can also be used to identify the general trend.
RSI MATHS
 RSI Formula can be defined as
RSI = 100 - 100
(1+RS)
RS is defined as ratio between average gain to average loss over a
certain period of time
Average Gain over “n” period of times
Average Loss over “n” period of times
Where n can be defined by user
Generally it is used as 14 days of period.
Internal Characteristics Of RSI
Ratio Analysis
 The RSI behaves like a logarithmic curve.
 Anytime the ratio exceeds 10: 1 , the market has been experiencing
a very strong move up.
 Anytime the ratio exceeds 1 : 10, the market has been experiencing
a very strong down move.
 The largest increase or decrease in the RSI value occurs when the
ratio changes from 1 : 1 to the next whole number (2: 1 or 1 :2).
 The RSI value experiences its largest changes in value as it
oscillates between the index values of 40 and 60.
 In other words the RSI is most sensitive to price change when the
RSI is oscillating between 40 and 60.
 When the ratio is 20: 1 , The RSI value at this time is only
95.24/4.76. This is a market condition that almost never occurs
when the look back period is 14 bars.
Determination Of Trend
 In a Bull market RSI value tends to travel in between 40-80 zones.
 In a Bear Market RSI value tends to travel in Between 60-20 zones.
 In Sideways market RSI Value tends to travel in between 40-65
zones.
 In extreme or very strong Bull market RSI bound in 60-90 levels.
 In extreme or very strong Bear market RSI bound in 40-10 levels.
 Value above 95 and below 5 are very rare. As above or below this
this level RSI behave logarithmically means change in RS is very
minute to notice .
 Above levels are applicable in any timeframe.
Range Shift
 Range Shift simply means when a security changes its trend .
1. From uptrend to downtrend.
2. From Downtrend to uptrend.
3. From Sideways to uptrend/downtrend.
4. From Uptrend/Downtrend to Sideways.
Various Patterns n Their Reliability
 M pattern
 W pattern
 V pattern
 Double Top/Bottom
 Head n Shoulder
 Flag
 Triangles
 Spring
 Wedges
Math's Error or Divergence
 It can be define as whenever there is a misunderstanding b/w price n
indicator they used to get divert from each other and moved in opposite
direction to each other.
Classification Of Divergence
Divergence
Simple or
Classic
Bullish Bearish
Multiple Bullish
& Bearish
Simple / Hidden
Hidden
Bullish Bearish
Simple or Classic Divergence
 Whenever price makes a higher high n RSI makes lower high then it
is said to be Simple Bearish Divergence.
 Whenever price makes a lower low n RSI makes higher low then it
is said to be Simple Bullish Divergence.
 Simple Bullish Divergence occur in bear market, commonly known
as short covering.
 Simple Bearish Divergence occur in bull market, commonly known
as retracement or correction.
Calculation of Divergence
For Bullish Divergence:
D=(P–T)
DT=(P+D)
Where ,
P =Value of peak in b/w 2
troughs,
T=Lowest value of trough,
D = Difference of P & T,
DT = Divergence Target.
For Bearish Divergence:
D=(P–T)
DT=(T-D)
Where ,
P=Highest Value of Peak,
T=Value of valley in b/w 2
peaks,
D = Difference of P & T ,
DT = Divergence Target.
Key Points For Simple Divergence
 A simple bullish divergence is more reliable when RSI value lies
between 40 to 10 .
 A simple bearish divergence is more reliable when RSI value lies
between 80 to 65 .
 Lesser the no. of candles between 2 troughs or peaks more
powerful will be reversal in terms of price n time both.
Hidden Divergence
 Whenever RSI makes a Higher high & price makes a lower high
then it is said to be Bearish Hidden Divergence.
 Whenever RSI makes a lower low & price makes a higher low then
it is said to be Bullish Hidden Divergence.
Key Points For Hidden Divergence
 Hidden divergence mostly occur between 40 to 65 level as RSI
value.
 A bullish hidden divergence is strongest when it occur near 40 level
with W or double bottom pattern.
 A bearish hidden divergence is strongest when it occur near 65
level with M or double top pattern.
 Usually highest volume is witness in reversal candle as compared
to last 5-8 candles near its resistance at 65 or support at 40 in RSI .
Multiple Divergence
 Whenever price makes a series of lower low n RSI makes a series
of higher low it known to be Multiple Simple Bullish Divergence.
 Whenever price makers a series of higher high n RSI makes a series
of lower high it is known to be Multiple Simple Bearish
Divergence.
 Whenever RSI makes a series of lower low n Price makes a series of
higher low it is known to be Multiple Hidden Bullish Divergence.
 Whenever RSI makes a series of Higher high n Price makes a series
of lower high it is known to be Multiple Hidden Bearish
Divergence.
Key Points For Multiple Divergence
 Multiple Bullish Divergence are more reliable when RSI value lies
between 40 -10 along with triple bottom , falling wedge , H &S
formation formed either in RSI or in price.
 Multiple Bearish Divergence are more reliable when RSI value lies
between 65-80 along with triple top , rising wedge, H&S formation
formed wither in RSI or in price.
 Multiple hidden divergence are more reliable when RSI value lies
between 40-65 along with spring ,triangle, flag or combination of three
is formed either in Price or RSI.
 Multiple Divergence are the strongest & most reliable trend reversal
signal .
 Valid for all timeframe.
Conclusion
THANK YOU

Trading divergences

  • 1.
  • 2.
    Topics:  RSI  RSIMath's  Internal Characteristics  Ratio Analysis  Trend Determination  Range Shift  Various patterns n their Reliability.  Math Error/Divergence  Classification of Divergence.  Simple Divergence  Calculation of Divergence.  Cheat sheet of Simple Divergence  Hidden Divergence  Cheat Sheet of Hidden Divergence  Multiple Divergence  Cheat Sheet of multiple Divergence  Conclusion
  • 3.
    Relative Strength Index(RSI) In June 1978, Welles Wilder introduced the Relative Strength Index.  It represents a ratio of the average 'gains' to the average 'losses' calculated over a number of time periods.  It is a formula based indicator which is usually assume to test the strength and movement in the market.  It is a range bound Oscillator which has upper boundary at 100 & lower boundary at 0.  RSI is considered overbought when above 70 and oversold when below 30.  Signals can also be generated by looking for divergences, failure swings and centerline crossovers.  RSI can also be used to identify the general trend.
  • 4.
    RSI MATHS  RSIFormula can be defined as RSI = 100 - 100 (1+RS) RS is defined as ratio between average gain to average loss over a certain period of time Average Gain over “n” period of times Average Loss over “n” period of times Where n can be defined by user Generally it is used as 14 days of period.
  • 5.
  • 6.
    Ratio Analysis  TheRSI behaves like a logarithmic curve.  Anytime the ratio exceeds 10: 1 , the market has been experiencing a very strong move up.  Anytime the ratio exceeds 1 : 10, the market has been experiencing a very strong down move.  The largest increase or decrease in the RSI value occurs when the ratio changes from 1 : 1 to the next whole number (2: 1 or 1 :2).  The RSI value experiences its largest changes in value as it oscillates between the index values of 40 and 60.  In other words the RSI is most sensitive to price change when the RSI is oscillating between 40 and 60.  When the ratio is 20: 1 , The RSI value at this time is only 95.24/4.76. This is a market condition that almost never occurs when the look back period is 14 bars.
  • 8.
    Determination Of Trend In a Bull market RSI value tends to travel in between 40-80 zones.  In a Bear Market RSI value tends to travel in Between 60-20 zones.  In Sideways market RSI Value tends to travel in between 40-65 zones.  In extreme or very strong Bull market RSI bound in 60-90 levels.  In extreme or very strong Bear market RSI bound in 40-10 levels.  Value above 95 and below 5 are very rare. As above or below this this level RSI behave logarithmically means change in RS is very minute to notice .  Above levels are applicable in any timeframe.
  • 16.
    Range Shift  RangeShift simply means when a security changes its trend . 1. From uptrend to downtrend. 2. From Downtrend to uptrend. 3. From Sideways to uptrend/downtrend. 4. From Uptrend/Downtrend to Sideways.
  • 22.
    Various Patterns nTheir Reliability  M pattern  W pattern  V pattern  Double Top/Bottom  Head n Shoulder  Flag  Triangles  Spring  Wedges
  • 30.
    Math's Error orDivergence  It can be define as whenever there is a misunderstanding b/w price n indicator they used to get divert from each other and moved in opposite direction to each other.
  • 31.
    Classification Of Divergence Divergence Simpleor Classic Bullish Bearish Multiple Bullish & Bearish Simple / Hidden Hidden Bullish Bearish
  • 32.
    Simple or ClassicDivergence  Whenever price makes a higher high n RSI makes lower high then it is said to be Simple Bearish Divergence.  Whenever price makes a lower low n RSI makes higher low then it is said to be Simple Bullish Divergence.  Simple Bullish Divergence occur in bear market, commonly known as short covering.  Simple Bearish Divergence occur in bull market, commonly known as retracement or correction.
  • 34.
    Calculation of Divergence ForBullish Divergence: D=(P–T) DT=(P+D) Where , P =Value of peak in b/w 2 troughs, T=Lowest value of trough, D = Difference of P & T, DT = Divergence Target. For Bearish Divergence: D=(P–T) DT=(T-D) Where , P=Highest Value of Peak, T=Value of valley in b/w 2 peaks, D = Difference of P & T , DT = Divergence Target.
  • 41.
    Key Points ForSimple Divergence  A simple bullish divergence is more reliable when RSI value lies between 40 to 10 .  A simple bearish divergence is more reliable when RSI value lies between 80 to 65 .  Lesser the no. of candles between 2 troughs or peaks more powerful will be reversal in terms of price n time both.
  • 42.
    Hidden Divergence  WheneverRSI makes a Higher high & price makes a lower high then it is said to be Bearish Hidden Divergence.  Whenever RSI makes a lower low & price makes a higher low then it is said to be Bullish Hidden Divergence.
  • 49.
    Key Points ForHidden Divergence  Hidden divergence mostly occur between 40 to 65 level as RSI value.  A bullish hidden divergence is strongest when it occur near 40 level with W or double bottom pattern.  A bearish hidden divergence is strongest when it occur near 65 level with M or double top pattern.  Usually highest volume is witness in reversal candle as compared to last 5-8 candles near its resistance at 65 or support at 40 in RSI .
  • 50.
    Multiple Divergence  Wheneverprice makes a series of lower low n RSI makes a series of higher low it known to be Multiple Simple Bullish Divergence.  Whenever price makers a series of higher high n RSI makes a series of lower high it is known to be Multiple Simple Bearish Divergence.  Whenever RSI makes a series of lower low n Price makes a series of higher low it is known to be Multiple Hidden Bullish Divergence.  Whenever RSI makes a series of Higher high n Price makes a series of lower high it is known to be Multiple Hidden Bearish Divergence.
  • 57.
    Key Points ForMultiple Divergence  Multiple Bullish Divergence are more reliable when RSI value lies between 40 -10 along with triple bottom , falling wedge , H &S formation formed either in RSI or in price.  Multiple Bearish Divergence are more reliable when RSI value lies between 65-80 along with triple top , rising wedge, H&S formation formed wither in RSI or in price.  Multiple hidden divergence are more reliable when RSI value lies between 40-65 along with spring ,triangle, flag or combination of three is formed either in Price or RSI.  Multiple Divergence are the strongest & most reliable trend reversal signal .  Valid for all timeframe.
  • 58.
  • 60.