Download to read offline

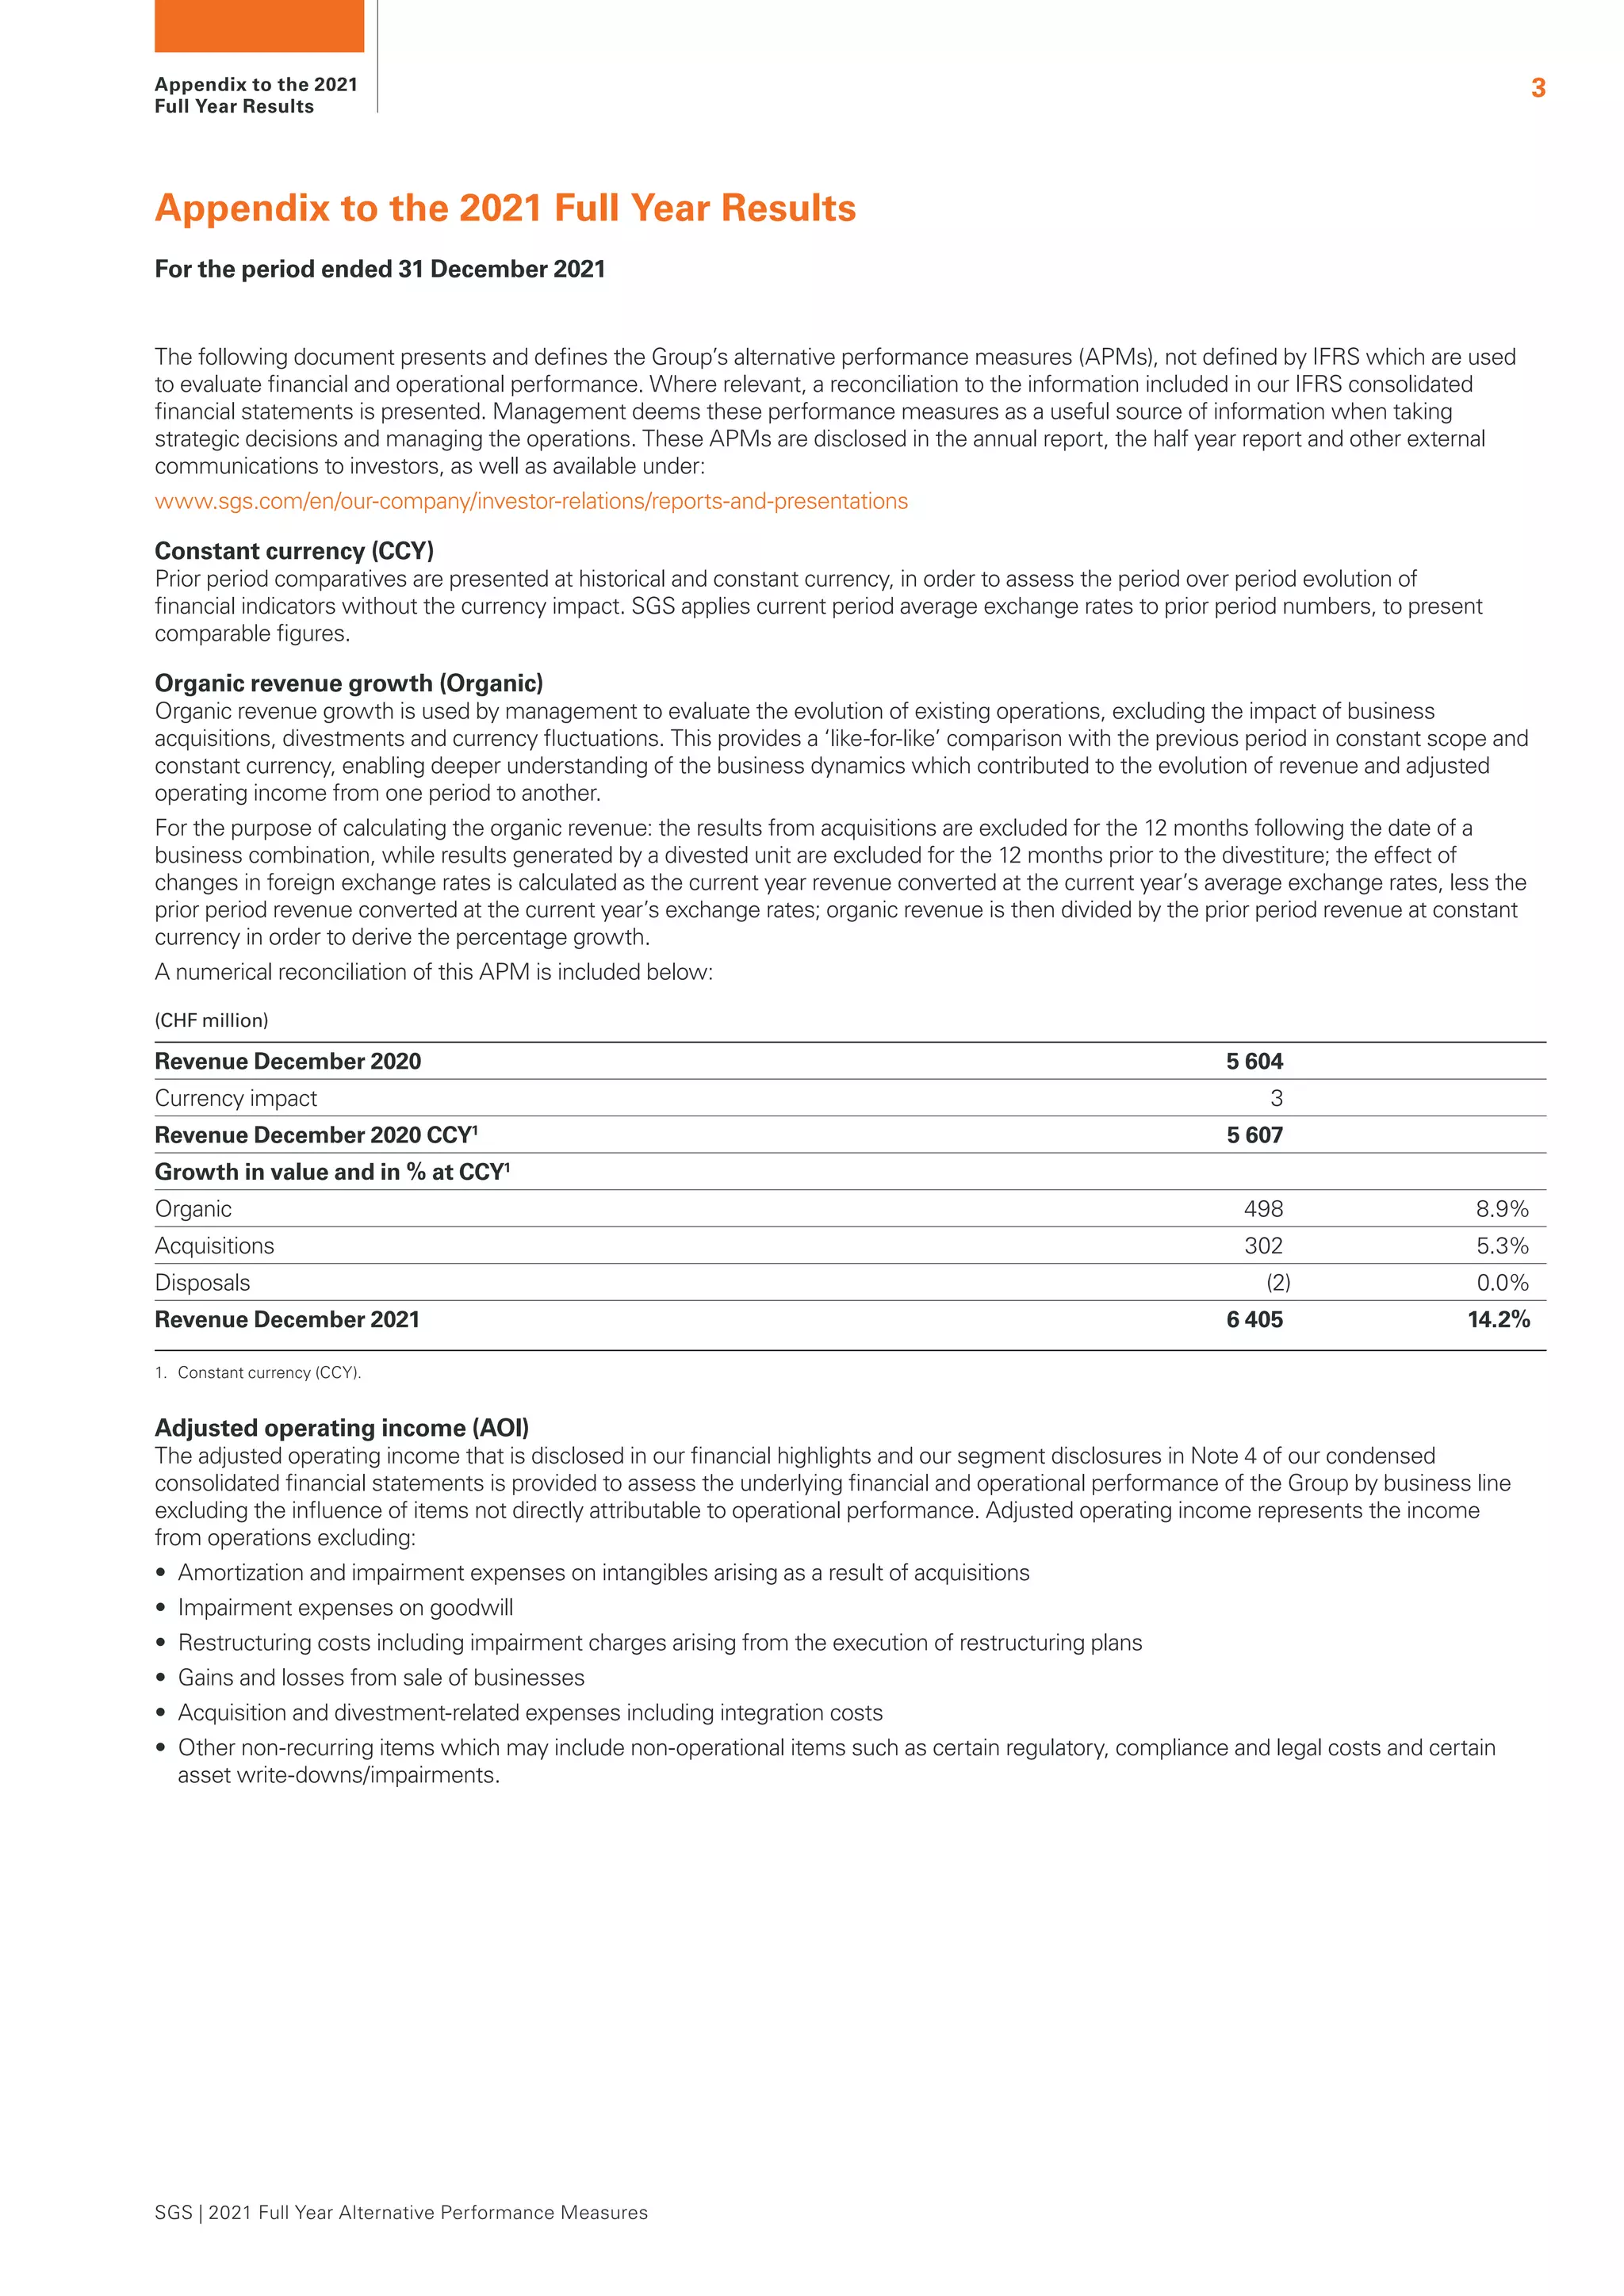
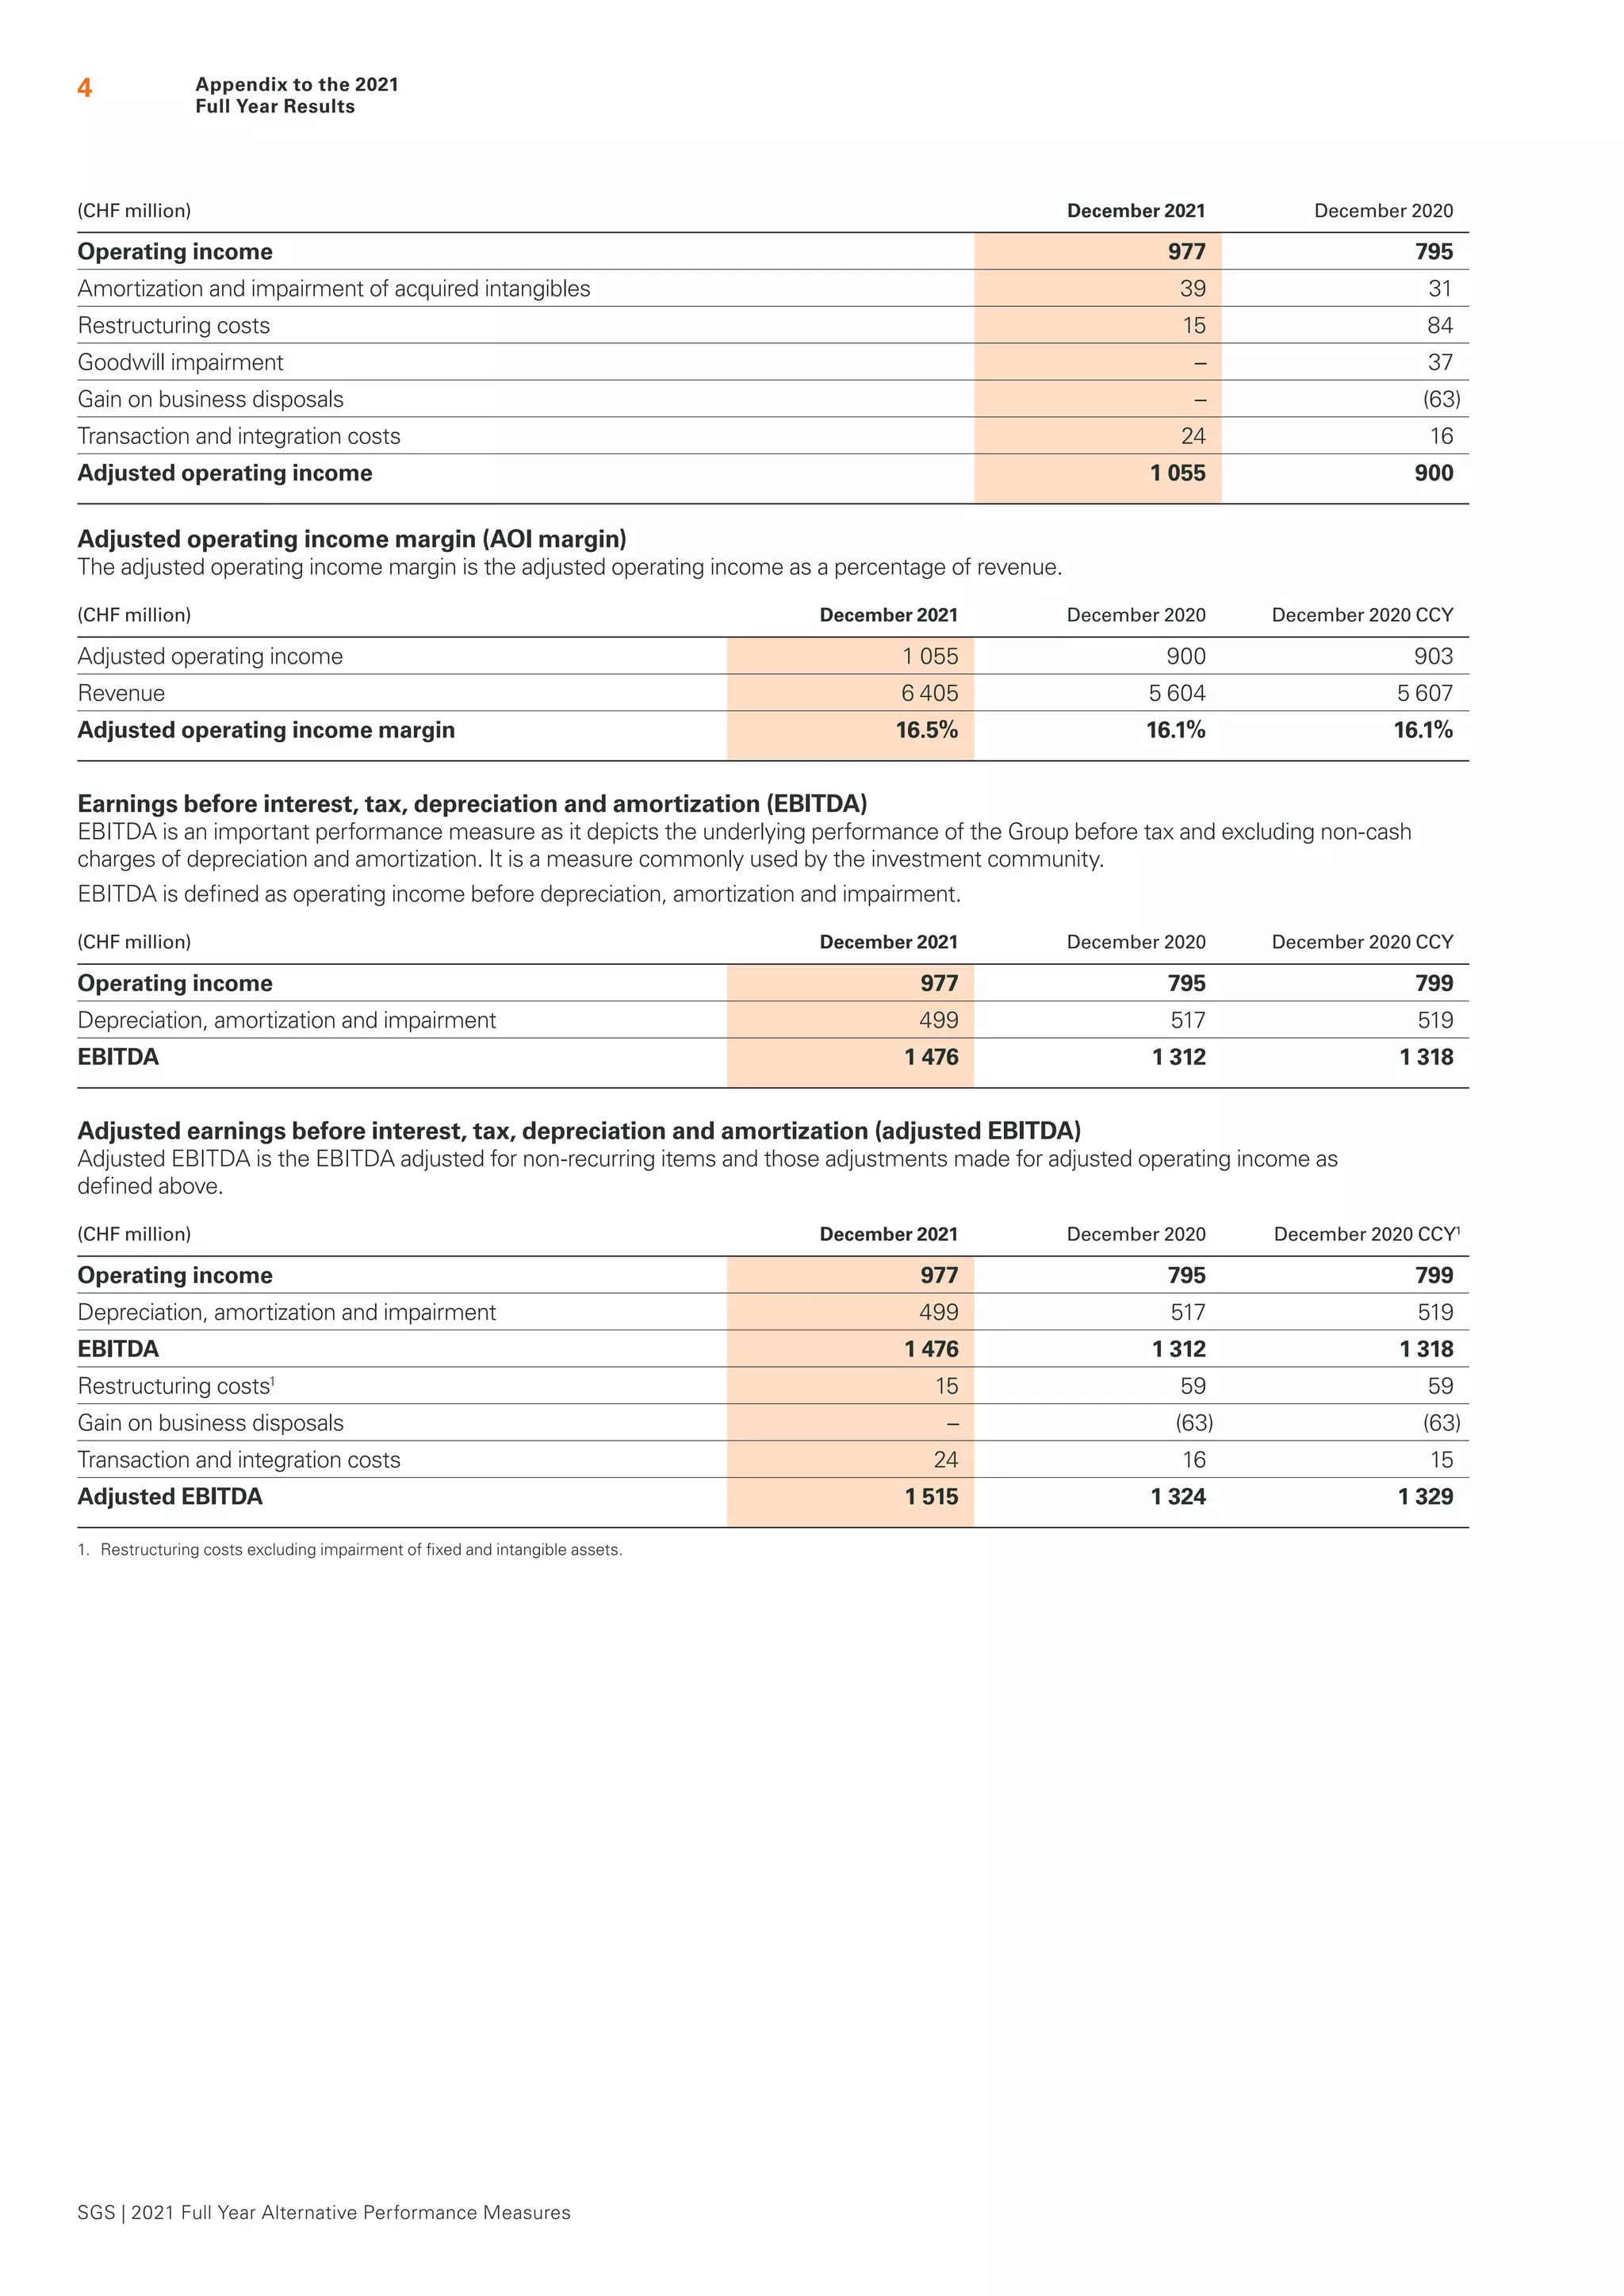
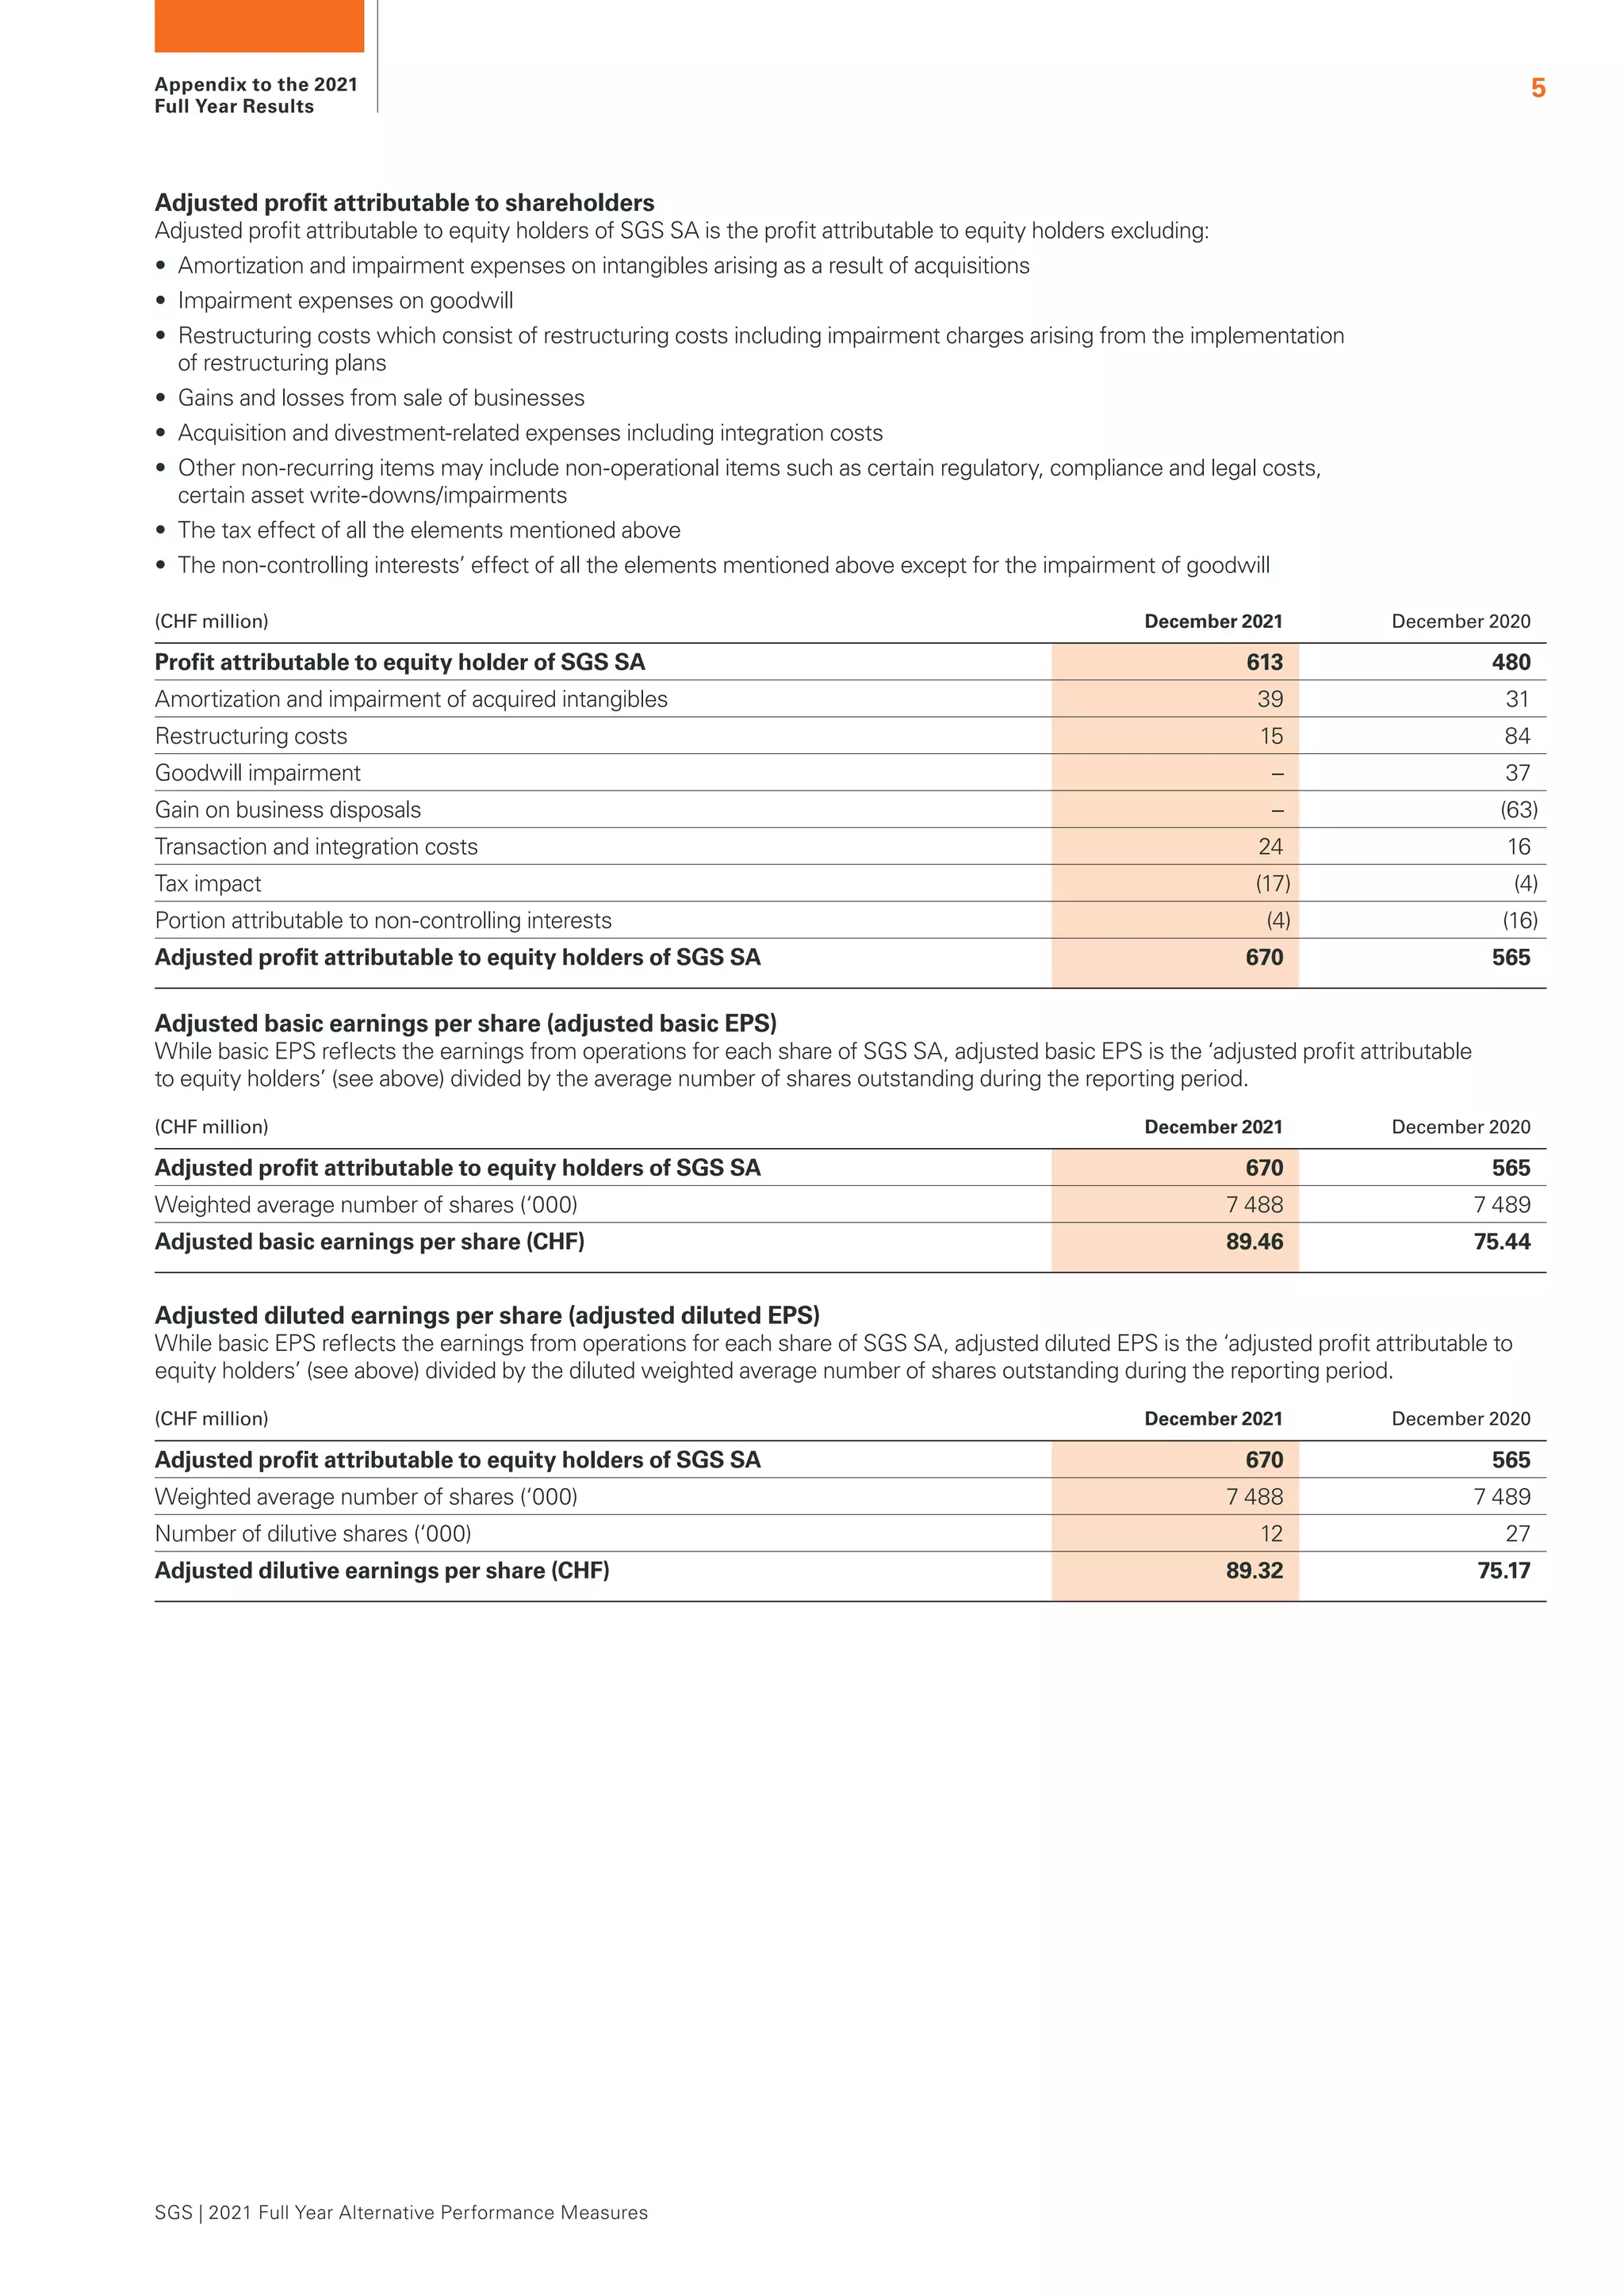
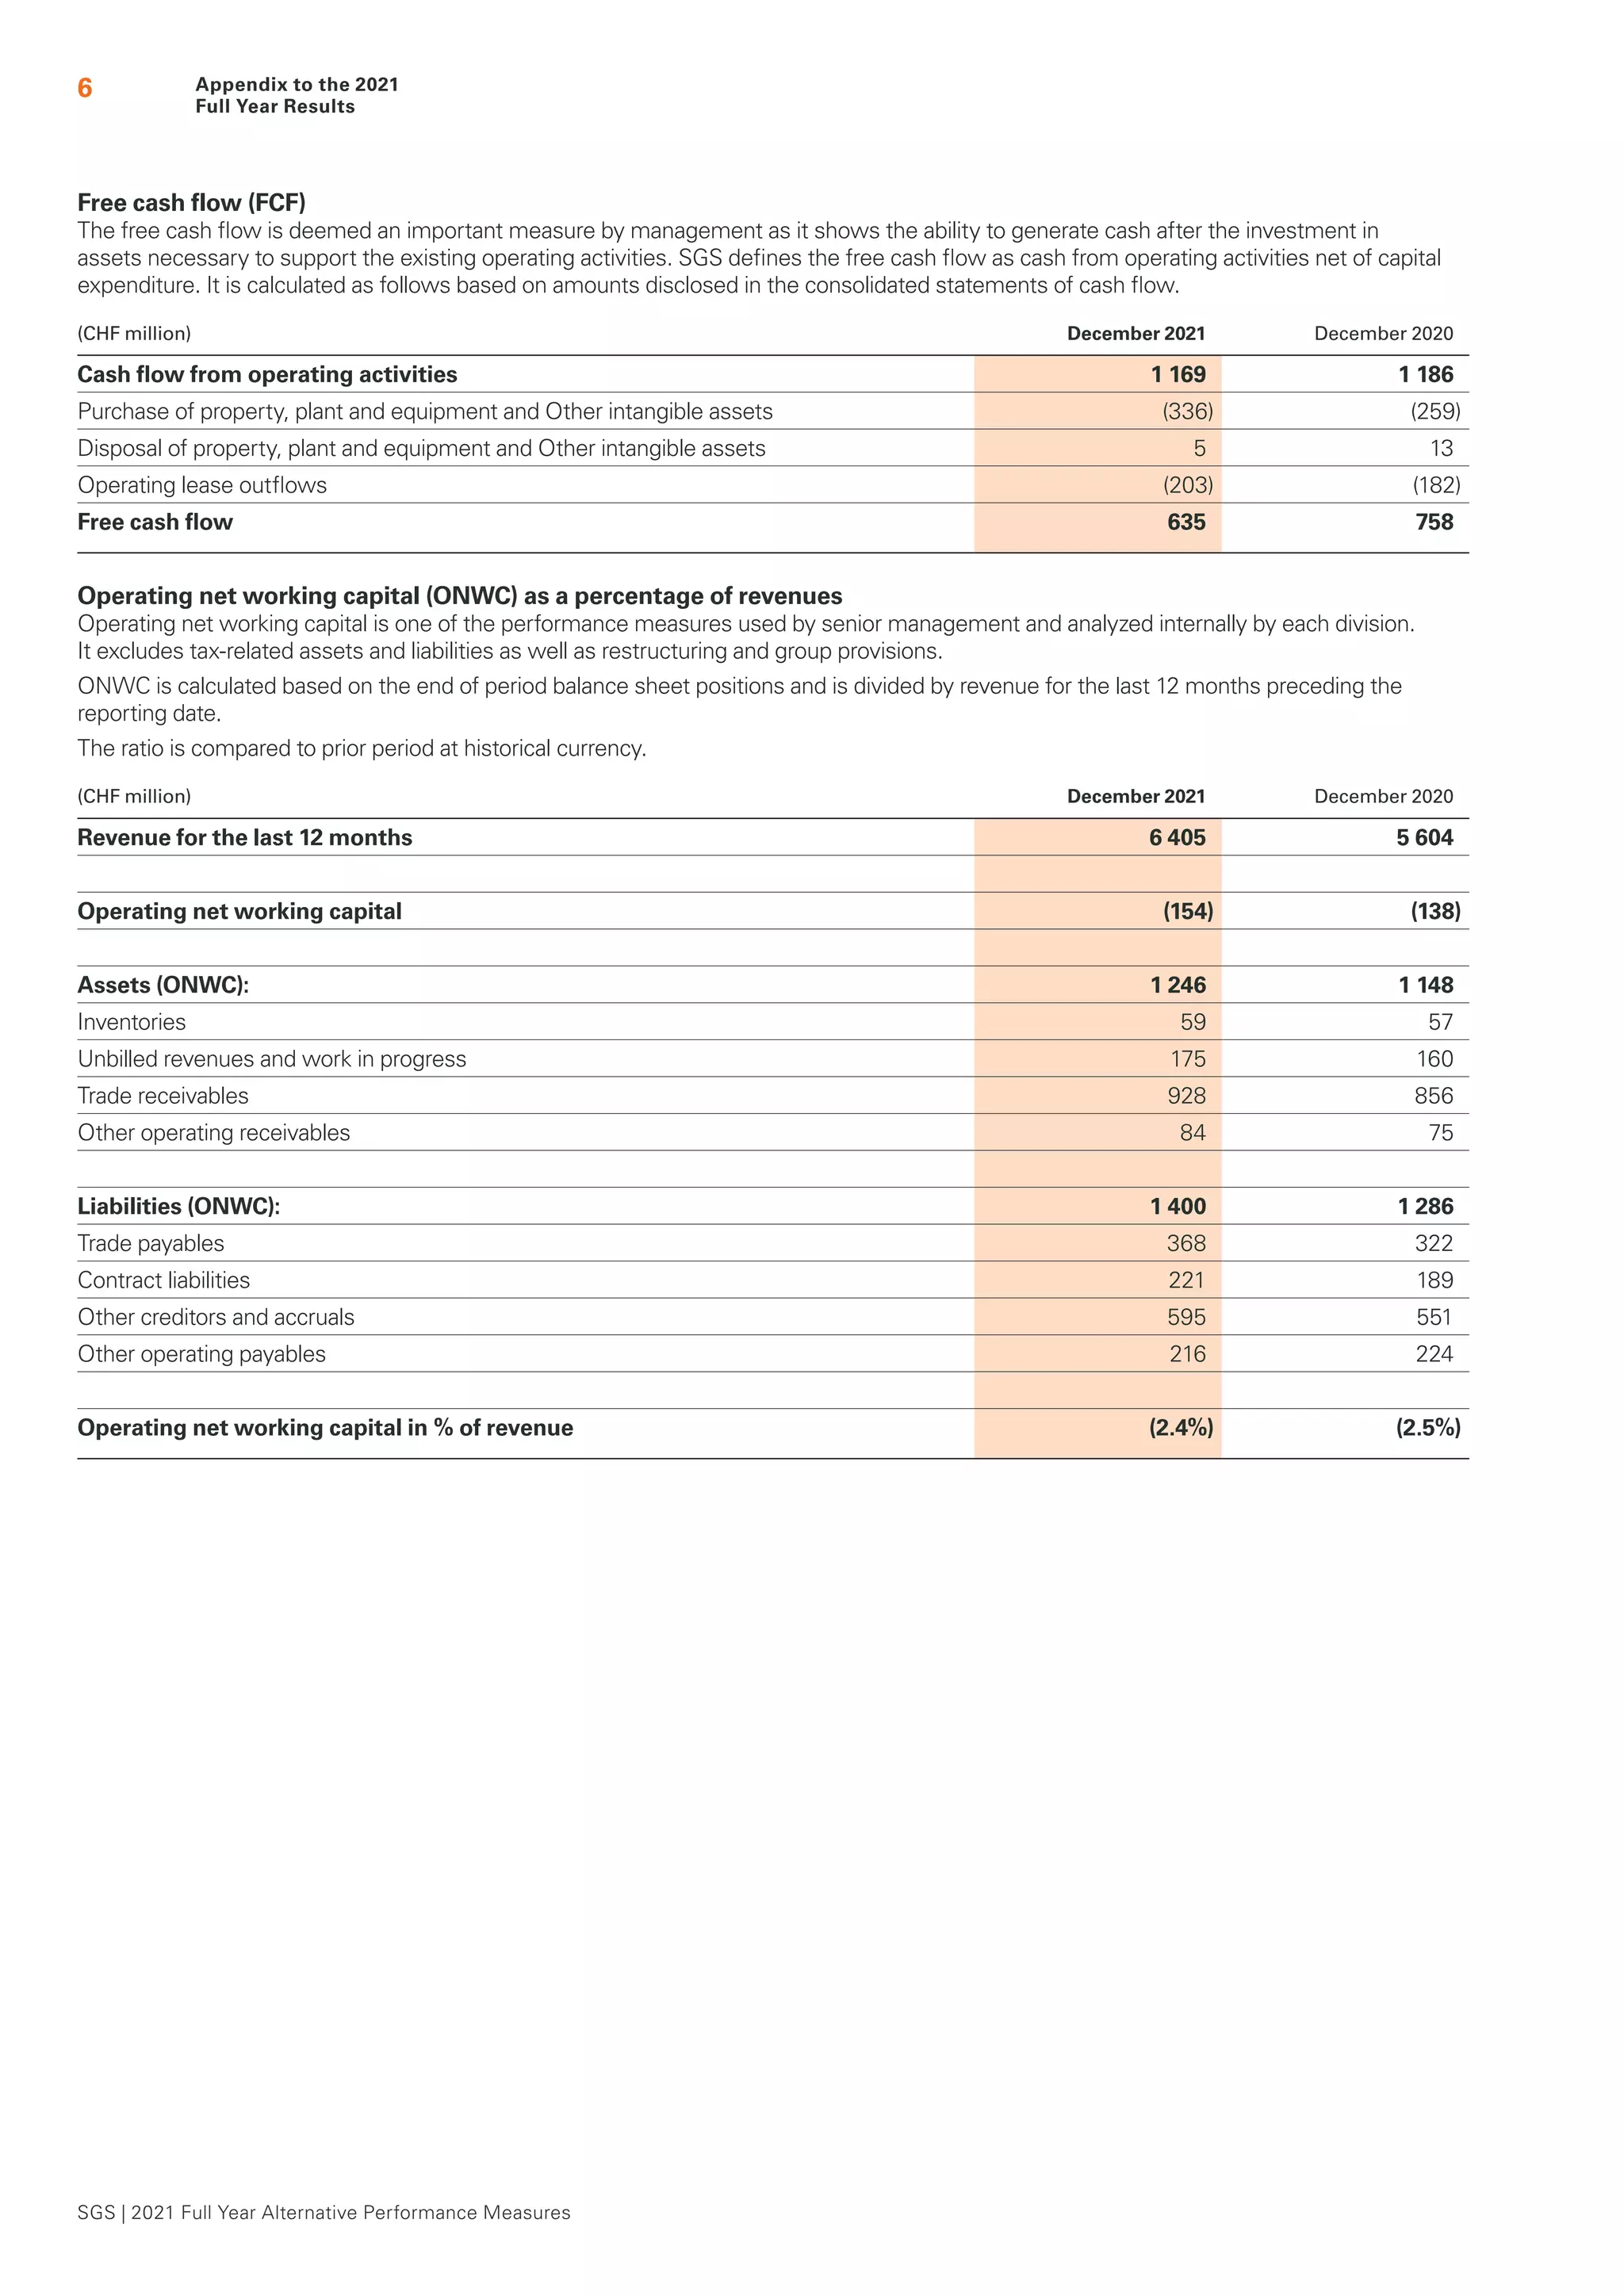
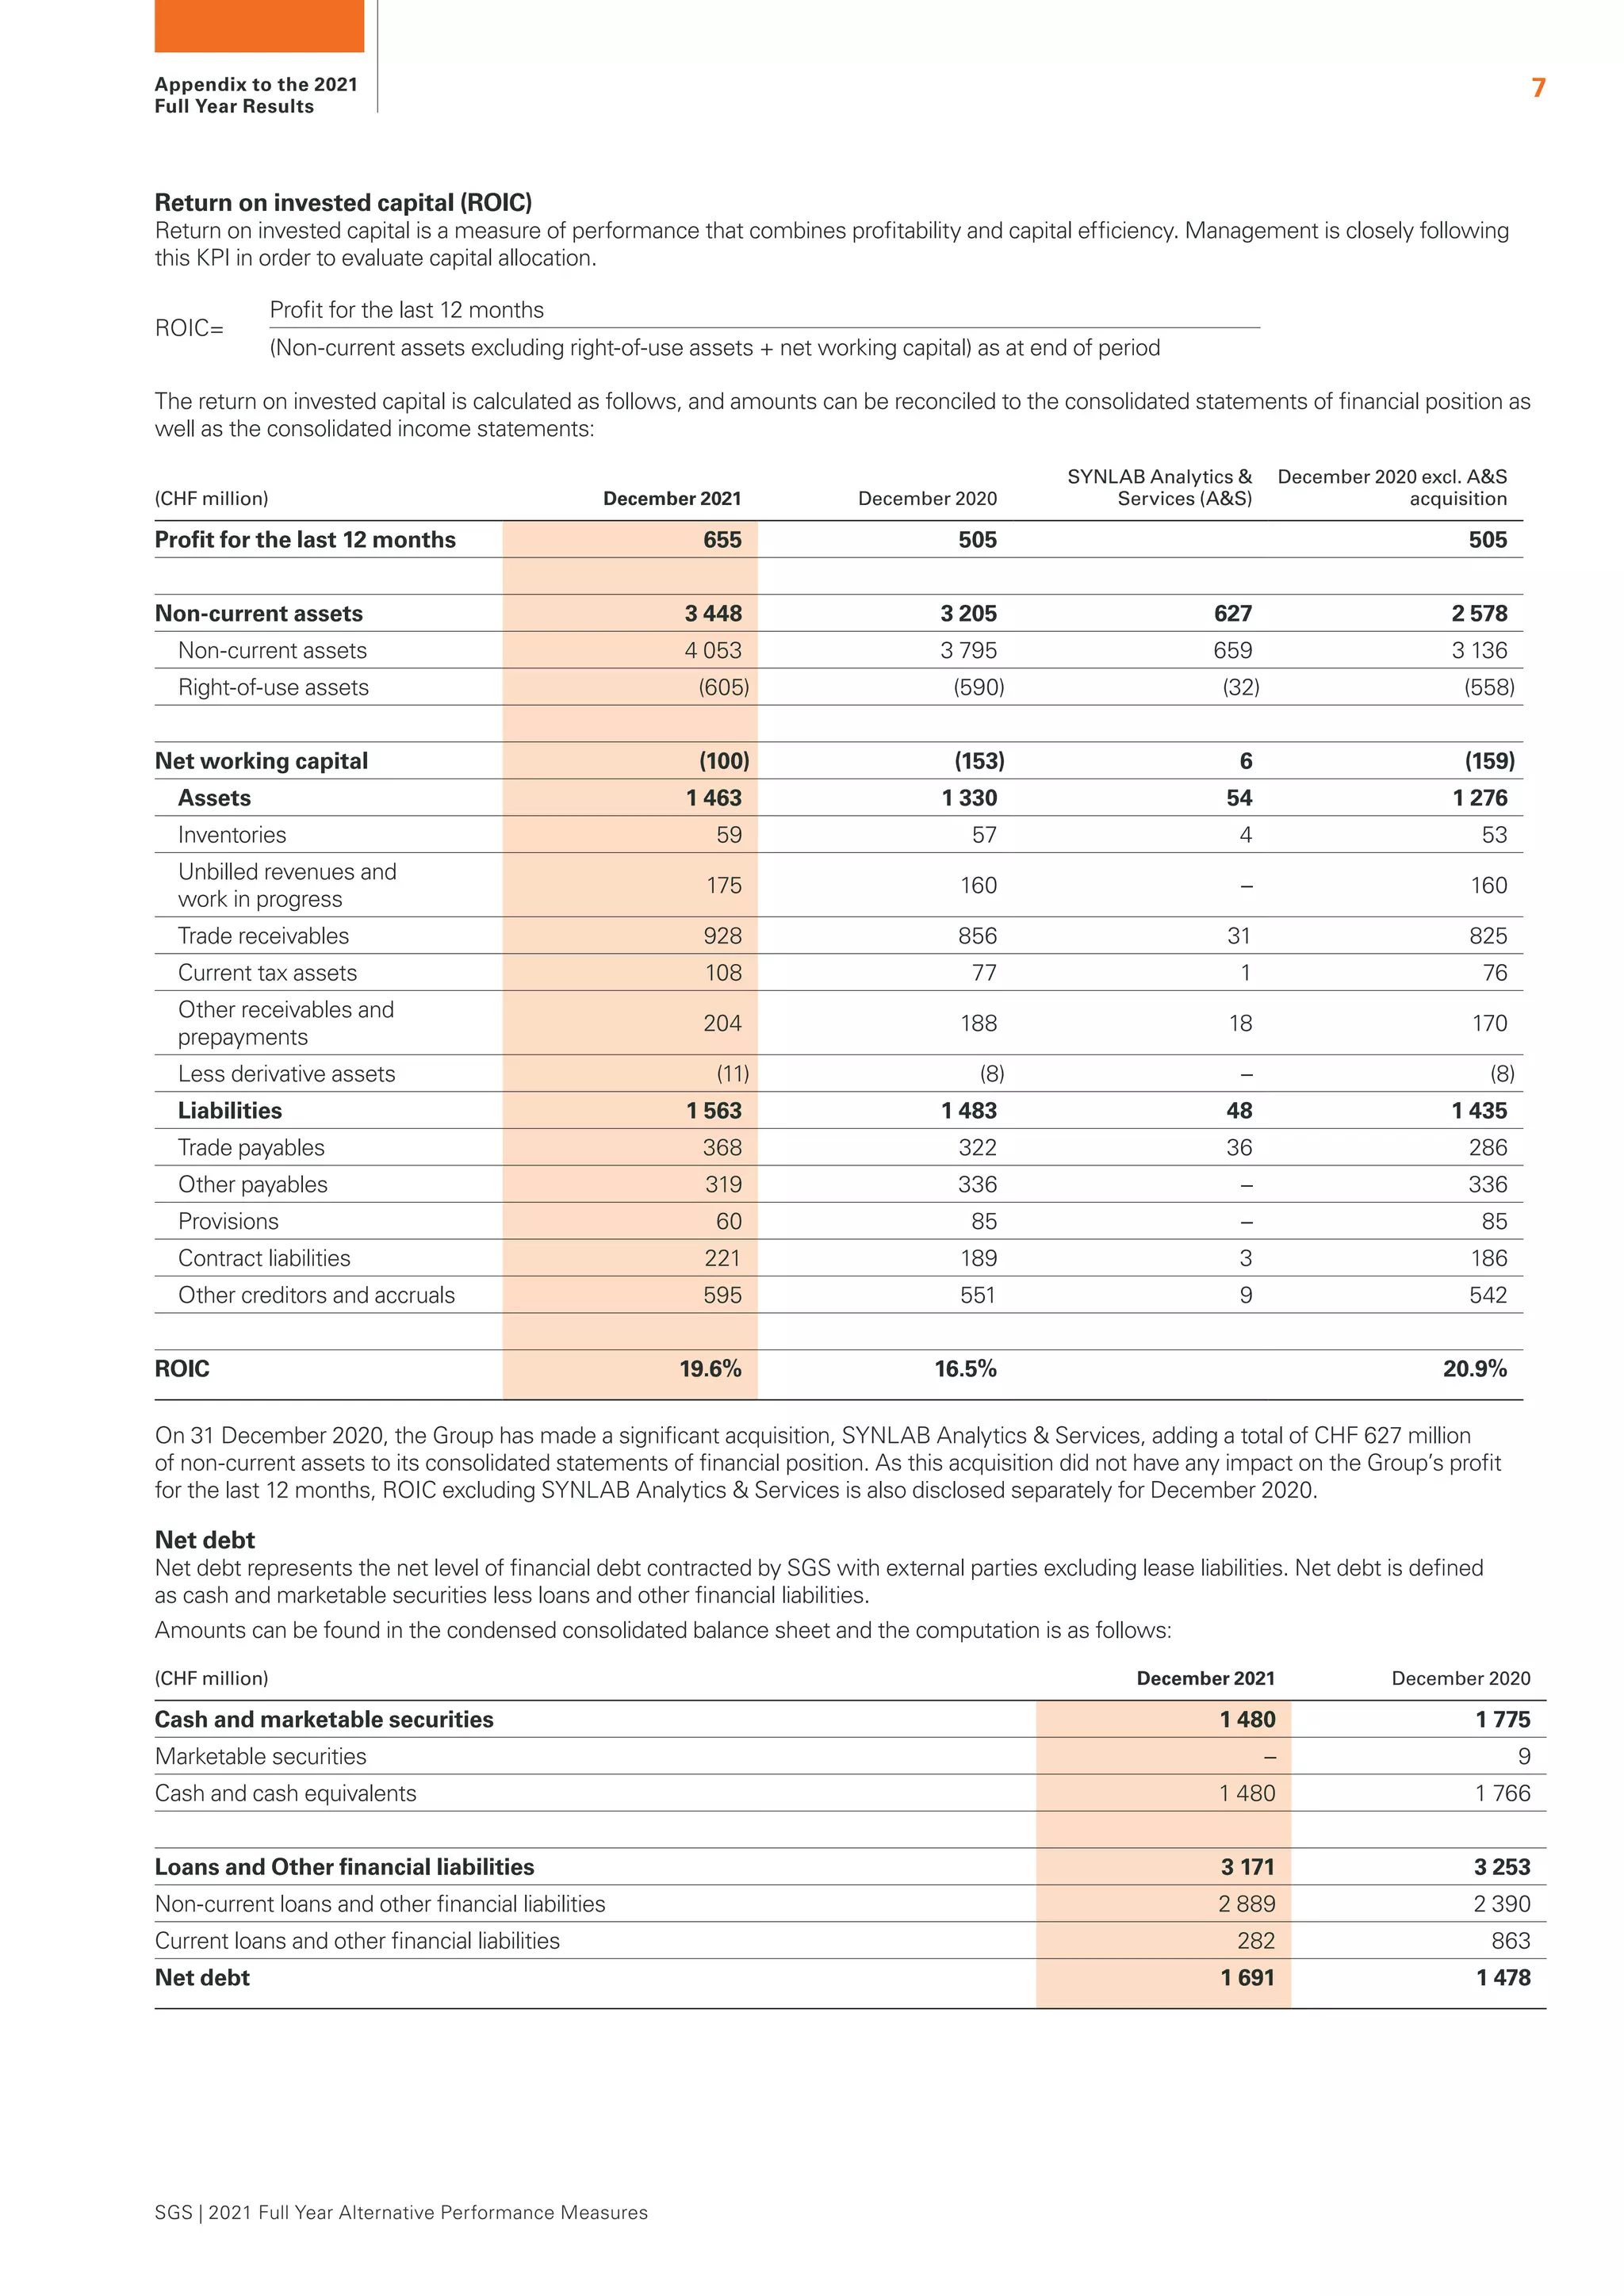


The document outlines SGS's alternative performance measures (APMs) for evaluating financial and operational performance not defined by IFRS, including reconciliations to IFRS consolidated financial statements. Key metrics discussed include organic revenue growth, adjusted operating income, EBITDA, and free cash flow, along with their definitions and calculations. It also details the company's financial results for 2021, including comparisons to 2020, and highlights important performance indicators like return on invested capital and net debt.


